

Review
doi: 10.1039/c6lc01063f.
Review: imaging technologies for flow cytometry
Affiliations
- PMID: 27830849
- PMCID: PMC5311077
- DOI: 10.1039/c6lc01063f
Item in Clipboard
Review
Review: imaging technologies for flow cytometry
Lab Chip.
.
Abstract
High-throughput single cell imaging is a critical enabling and driving technology in molecular and cellular biology, biotechnology, medicine and related areas. Imaging flow cytometry combines the single-cell imaging capabilities of microscopy with the high-throughput capabilities of conventional flow cytometry. Recent advances in imaging flow cytometry are remarkably revolutionizing single-cell analysis. This article describes recent imaging flow cytometry technologies and their challenges.
Figures

Optics of ImageStream. Reproduced from Ref. with permission from the EMD Millipore Corporation.
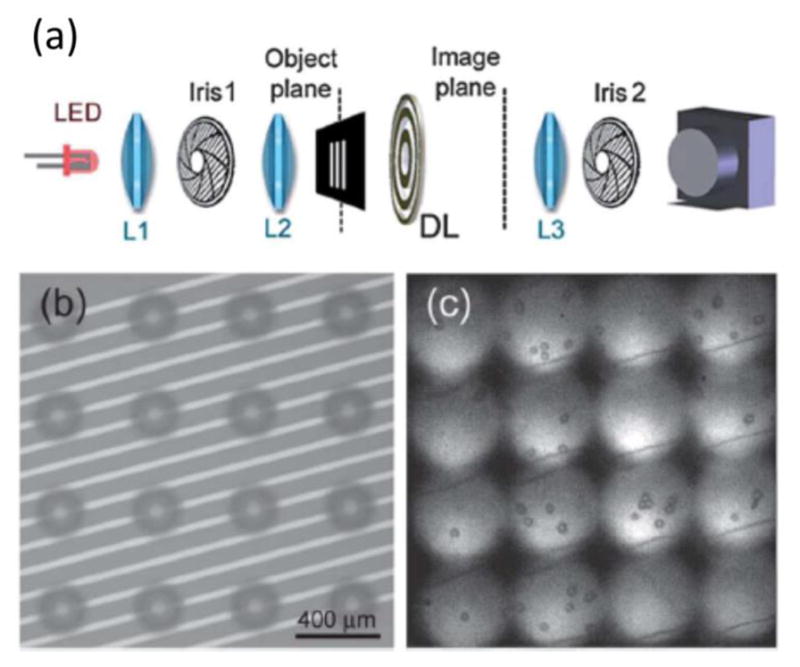
Multiple Field of View Imaging Flow Cytometer. (a) Diffractive lens wide field imaging system. L1 collimates the LED, L2 is a condenser that images Iris 1 onto the object plane. DL is the diffractive lens providing multiple field of view. L3 is a relay lens. (b) 16 object planes. (c) 16 imaging planes. Sample: 3.5um latex beads. Reproduced from Ref. with permission from the Royal Society of Chemistry.
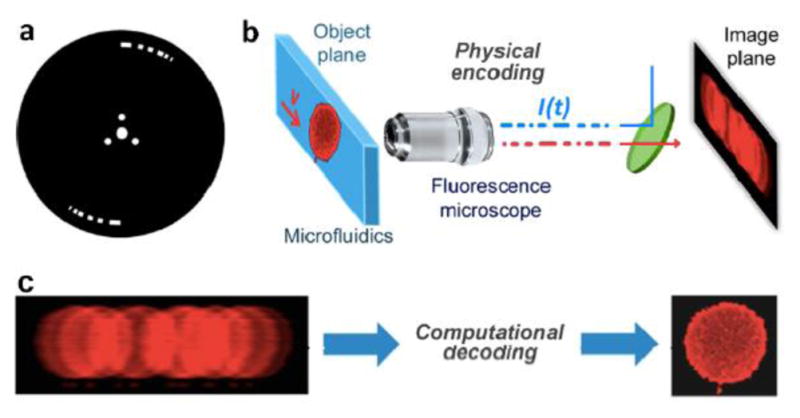
Coded excitation fluorescence microscope. (a) Chopper wheel that modulates the excitation beam with a pseudo-random code. (b) a microfluidic device imaged by 40X fluorescent imaging microscope. (c) Raw blur encoded images captured by the camera and decoded images after computational approach. Reproduced from Ref. with permission from the Optical Society.
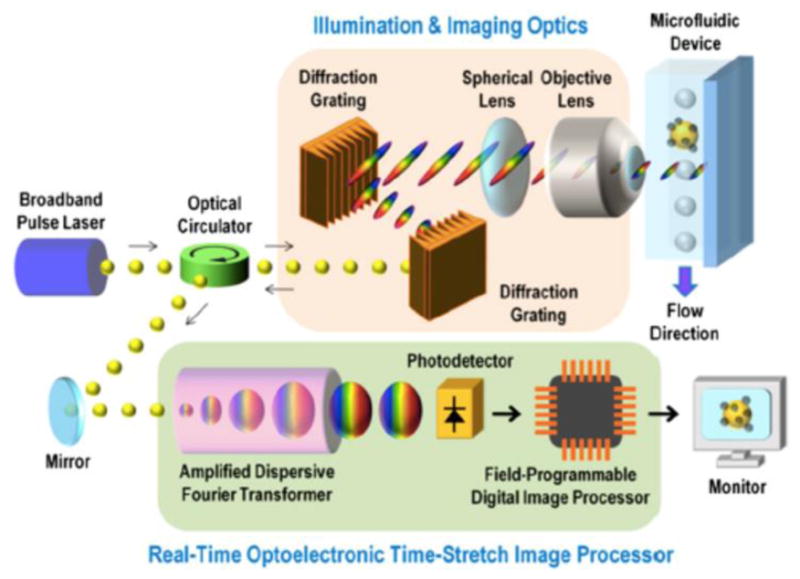
Schematic of the STEAM flow analyzer. Imaging and illumination optics takes blur-free images by encoding object location information into spectral domain. ADFT converts spectral information into time domain through time-stretch method and processed by real-time imaging processor. Reproduced from Ref. with permission from the PNAS.

FIRE microscopy. a, Schematic diagram of the FIRE microscope. BS, beamsplitter; AOD, acousto-optic deflector; AOFS, acousto-optic frequency shifter; DM, dichroic mirror; EF, fluorescence emission filter; OL, objective lens; PMT, photomultiplier tube; DIG, 250 MS digital recording oscilloscope; RS, resonant scanning mirror. Upper inset: the AOD produces a single diffracted first-order beam for each radiofrequency comb frequency. Lower inset: beat frequency generation at the MZI output. b, Gabor lattice diagram of FIRE’s frequency-domain multiplexing approach. Points in same horizontal line are excited in parallel at distinct radiofrequencies. The horizontal line is scanned by a galvo-mirror to acquire a 2D image. Reproduced from Ref. with permission from the Nature Publishing Group.
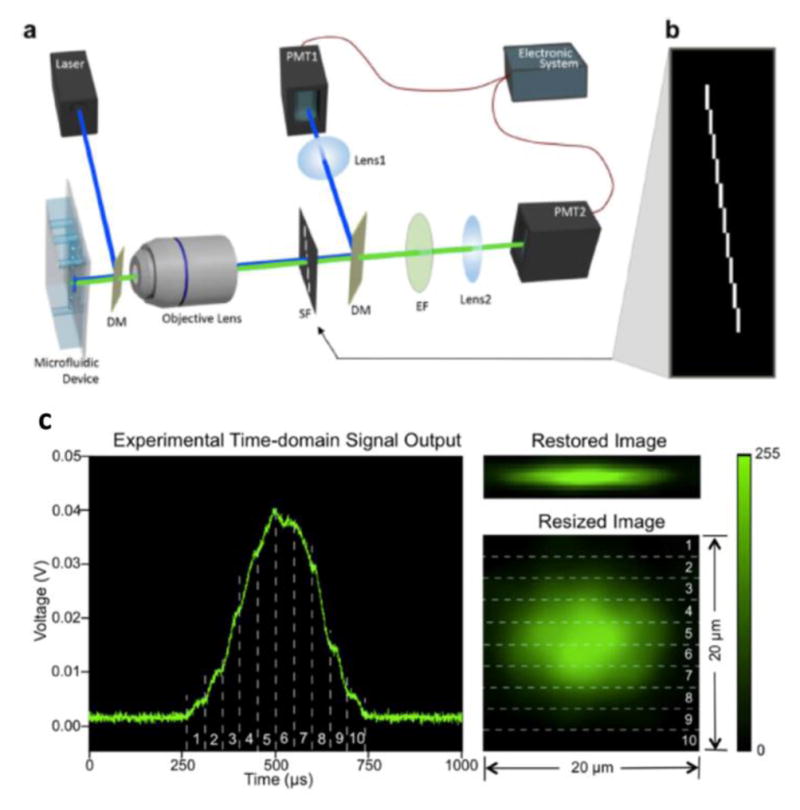
Implementation of spatial-temporal transformation-based IFC. (a) Schematic diagram of the imaging flow cytometer system. DM, dichroic mirror; SF, spatial filter; EF, emission filter; PMT, photomultiplier tube. (b) Spatial filter design that has ten 100 μm by 1 mm slits positioned apart in the way of one is immediately after another in both x-direction and y-direction. (c) Experimental result: time-domain PMT output signal of fluorescent light from a A549 cell stained with CellTrace CFSE, corresponding original fluorescence image restored by algorithm, and corresponding resized fluorescence image to show the real size of the cell. The numbered regions segmented by dashed lines demonstrate the correspondence between the time-domain signal and the resulting image. Size is labelled in figure. Reproduced from Ref. with permission from the Nature Publishing Group.

Demonstration of bright-field, two-color fluorescence and backscattering cell images. Scale bars are 5 μm. (a) Bright-field images of MDA-MB-231 human breast cancer cells flowing at 0.2 m/s. (b) Representative two-color fluorescent images of MDAMB-231 human breast cancer cells stained with CellTrace CFSE, cell membrane bond with 1 μm fluorescent beads, flowing in the microfluidic channel at 0.25 m/s. Ref. (b) Representative fluorescence plus backscattering cell images from spatial filter based imaging flow cytometry. All images are of A549 human lung adenocarcinoma epithelial cells, stained with CellTrace CFSE, flowing at a velocity of 0.2 m/s. Reproduced from Ref. with permission from the Nature Publishing Group.
Similar articles
-
Microfluidic Imaging Flow Cytometry by Asymmetric-detection Time-stretch Optical Microscopy (ATOM).J Vis Exp. 2017 Jun 28;(124):55840. doi: 10.3791/55840. J Vis Exp. 2017. PMID: 28715367 Free PMC article.
-
Automated analysis of the cytokinesis-block micronucleus assay for radiation biodosimetry using imaging flow cytometry.Radiat Environ Biophys. 2014 May;53(2):273-82. doi: 10.1007/s00411-014-0525-x. Epub 2014 Mar 7. Radiat Environ Biophys. 2014. PMID: 24604721
-
Label-free cell cycle analysis for high-throughput imaging flow cytometry.Nat Commun. 2016 Jan 7;7:10256. doi: 10.1038/ncomms10256. Nat Commun. 2016. PMID: 26739115 Free PMC article.
-
Optofluidic time-stretch imaging - an emerging tool for high-throughput imaging flow cytometry.Lab Chip. 2016 May 10;16(10):1743-56. doi: 10.1039/c5lc01458a. Lab Chip. 2016. PMID: 27099993 Review.
-
Moving pictures: imaging flow cytometry for drug development.Comb Chem High Throughput Screen. 2009 Nov;12(9):849-59. doi: 10.2174/138620709789383204. Comb Chem High Throughput Screen. 2009. PMID: 19929790 Review.
Cited by
-
Rapid flowing cells localization enabled by spatiotemporal manipulation of their holographic patterns.APL Bioeng. 2024 Sep 10;8(3):036114. doi: 10.1063/5.0222932. eCollection 2024 Sep. APL Bioeng. 2024. PMID: 39263370 Free PMC article.
-
HIV-1 Accessory Protein Vpr Interacts with REAF/RPRD2 To Mitigate Its Antiviral Activity.J Virol. 2020 Jan 31;94(4):e01591-19. doi: 10.1128/JVI.01591-19. Print 2020 Jan 31. J Virol. 2020. PMID: 31776272 Free PMC article.
-
Portable light-sheet optofluidic microscopy for 3D fluorescence imaging flow cytometry.Lab Chip. 2023 Feb 14;23(4):624-630. doi: 10.1039/d2lc01024k. Lab Chip. 2023. PMID: 36633262 Free PMC article.
-
High-Throughput Single-Cell Analysis of Nanoparticle-Cell Interactions.Trends Analyt Chem. 2023 Sep;166:117172. doi: 10.1016/j.trac.2023.117172. Epub 2023 Jul 10. Trends Analyt Chem. 2023. PMID: 37520860 Free PMC article.
-
Imaging Flow Cytometry and Confocal Immunofluorescence Microscopy of Virus-Host Cell Interactions.Front Cell Infect Microbiol. 2021 Oct 12;11:749039. doi: 10.3389/fcimb.2021.749039. eCollection 2021. Front Cell Infect Microbiol. 2021. PMID: 34712624 Free PMC article. Review.
References
-
- Fulwyler MJ. Electronic separation of biological cells by volume. Science (80-) 1965;150:910–911. - PubMed
-
- Hulett HR, Bonner WA, Barrett J, Herzenberg LA. Cell Sorting: Automated Separation of Mammalian Cells as a Function of Intracellular Fluorescence. Science (80-) 1969;166:747–749. - PubMed
-
- Kay DB, Cambier JL, Wheeless LL. Imaging in flow. J Histochem Cytochem. 1979;27:329–334. - PubMed
-
- Kachel V, Benker G, Lichtnau K, Valet G, Glossner E. Fast imaging in flow: a means of combining flow-cytometry and image analysis. J Histochem Cytochem. 1979;27:335–341. - PubMed
-
- Cambier JL, Kay DB, Wheeless LL. A multidimensional slit-scan flow system. J Histochem Cytochem. 1979;27:321–324. - PubMed
Publication types
MeSH terms
Grants and funding
LinkOut - more resources
Full Text Sources
Other Literature Sources