. 2016 Nov 7;5(11):e004401.
doi: 10.1161/JAHA.116.004401.

Lipid-Free Apolipoprotein A-I Reduces Progression of Atherosclerosis by Mobilizing Microdomain Cholesterol and Attenuating the Number of CD131 Expressing Cells: Monitoring Cholesterol Homeostasis Using the Cellular Ester to Total Cholesterol Ratio

Affiliations

Lipid-Free Apolipoprotein A-I Reduces Progression of Atherosclerosis by Mobilizing Microdomain Cholesterol and Attenuating the Number of CD131 Expressing Cells: Monitoring Cholesterol Homeostasis Using the Cellular Ester to Total Cholesterol Ratio

Sushma Kaul et al. J Am Heart Assoc. .

Abstract

Background: Atherosclerosis is a chronic inflammatory disorder whose development is inversely correlated with high-density lipoprotein concentration. Current therapies involve pharmaceuticals that significantly elevate plasma high-density lipoprotein cholesterol concentrations. Our studies were conducted to investigate the effects of low-dose lipid-free apolipoprotein A-I (apoA-I) on chronic inflammation. The aims of these studies were to determine how subcutaneously injected lipid-free apoA-I reduces accumulation of lipid and immune cells within the aortic root of hypercholesterolemic mice without sustained elevations in plasma high-density lipoprotein cholesterol concentrations.

Methods and results: Ldlr-/- and Ldlr-/- apoA-I-/- mice were fed a Western diet for a total of 12 weeks. After 6 weeks, a subset of mice from each group received subcutaneous injections of 200 μg of lipid-free human apoA-I 3 times a week, while the other subset received 200 μg of albumin, as a control. Mice treated with lipid-free apoA-I showed a decrease in cholesterol deposition and immune cell retention in the aortic root compared with albumin-treated mice, regardless of genotype. This reduction in atherosclerosis appeared to be directly related to a decrease in the number of CD131 expressing cells and the esterified cholesterol to total cholesterol content in several immune cell compartments. In addition, apoA-I treatment altered microdomain cholesterol composition that shifted CD131, the common β subunit of the interleukin 3 receptor, from lipid raft to nonraft fractions of the plasma membrane.

Conclusions: ApoA-I treatment reduced lipid and immune cell accumulation within the aortic root by systemically reducing microdomain cholesterol content in immune cells. These data suggest that lipid-free apoA-I mediates beneficial effects through attenuation of immune cell lipid raft cholesterol content, which affects numerous types of signal transduction pathways that rely on microdomain integrity for assembly and activation.

Keywords: apolipoprotein; apolipoprotein A‐I; cholesterol; chronic inflammation; high‐density lipoprotein; inflammation; lipid rafts; microdomains; signaling pathways.


Figures

Figure 1
Figure 1
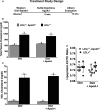
Study design and plasma lipoprotein cholesterol. A, The experimental design used throughout the course of these studies. At the time of weaning, male Ldlr −/− and Ldlr −/− apoA‐I −/− mice began a Western diet (Envigo‐Teklad) containing 42% of calories as fat and 0.2% cholesterol. After 6 weeks, the mice were divided into two groups. One group received subcutaneous (SubQ) injections of 200 μg of lipid‐free apolipoprotein A‐I (apoA‐I) 3 times a week, while the other group received 200 μg of bovine serum albumin 3 times a week. Both groups were maintained on the Western diet during the treatment phase of the study. After a total of 12 weeks on the diet, the mice were evaluated. B, The total plasma cholesterol concentration and (C) high‐density lipoprotein (HDL) cholesterol concentration in each of the groups. D, The ratio of ester cholesterol (EC) to total cholesterol (TC) in plasma lipoproteins. Data shown are the mean±SD of 5 to 10 male mice for each genotype condition. Unlike letters indicate statistical significance at P<0.02.
Figure 2
Figure 2
Atherosclerosis was reduced by administration of subcutaneous lipid‐free apolipoprotein A‐I (apoA‐I). A, Representative aortic root sections stained with Oil Red O (ORO) from Ldlr −/− and Ldlr −/− apoA‐I −/− mice fed a Western diet for 12 weeks from each treatment group, while (B) shows the quantification of the atherosclerotic lesion area as a percent of the total aortic area for the ORO‐stained aortic roots. Data show the mean±SD of 10 male mice per group. C, Representative aortic root sections stained with fluorescently labeled antibodies to CD68 from Ldlr −/− and Ldlr −/− apoA‐I −/− mice fed a Western diet for 12 weeks from each treatment group, while (D) shows quantification of the CD68+ staining over background as a percent of the total lesion area. Unlike letters indicate statistical significance at P<0.05. The fluorescence background threshold was set to the intensity of sections receiving the fluorescent‐tagged secondary antibody minus CD68 primary antibody.
Figure 3
Figure 3
CD131 expressing cells in peripheral blood decrease in response to apolipoprotein A‐I (apoA‐I) treatment. Schematic diagrams showing representative flow cytometry plots of peripheral blood mononuclear cells (PBMCs) isolated from 3 different treatment groups of Ldlr −/− mice fed either chow, Western diet, or Western diet+subcutaneously administered apoA‐I. A, Forward and side scatter of total live PBMCs from Ldlr −/− mice. B, The PBMC ester cholesterol to total cholesterol (EC/TC) ratio for individual mice of each of the indicated genotypes for each of the 3 treatment groups. C, Gating of side scatter versus for CD45+ cells from the corresponding gate above for Ldlr −/− mice fed either chow, Western diet, or Western diet±subcutaneously administered apoA‐I. D, The percentage of CD45+ cells of the total cells (left) and the total number of CD45+ cells (right) for Ldlr −/− mice fed either chow, Western diet, or Western diet±subcutaneously administered apoA‐I. E, Histograms for cells double positive for CD45+ and CD131+. F, The percent of cells expressing both CD45+ and CD131+ and the total number of CD45+, CD131+ expressing cells from Ldlr −/− mice fed either chow, Western diet, or Western diet±subcutaneously administered apoA‐I. Results shown in (B) are the average of 5 to 8 individual PBMC samples for each genotype and treatment group. The results displayed in (D and F) are the mean±SD for 10 to 15 mice per group. Unlike letters indicate statistical significance at P<0.05.
Figure 4
Figure 4
Numbers of CD131 expressing monocytes and neutrophils are reduced in response to apolipoprotein A‐I (apoA‐I) treatment. Schematic diagrams showing representative flow cytometry plots and histogram of peripheral blood mononuclear cells (PBMCs) isolated from Ldlr −/− mice fed either a Western diet or Western diet+subcutaneously administered apoA‐I. A, Gating for CD45+ cells that express CD115 and Ly6C and a histogram of CD131 expressing cells. B, The total number of inflammatory monocytes, eg, cells positive for CD45 CD131 Ly6C and CD115. C, Gating for CD45+ cells expressing Ly6G and CD11b and a histogram of CD131 expressing cells. D, The total number of neutrophils, eg, cells positive for CD45 CD131 Ly6G and CD11b+. A and C, Representative plots from Ldlr −/− mice fed either Western diet or Western diet+subcutaneously administered apoA‐I. Results shown in (B and D) are expressed as the mean±SD for 10 to 15 mice per group. Unlike letters indicate statistical significance at P<0.05.
Figure 5
Figure 5
Apolipoprotein A‐I (apoA‐I) treatment reduces CD131 expressing cells in mouse spleen and bone marrow of Ldlr −/− mice. A and D, ester cholesterol to total cholesterol (EC/TC) ratios for single‐cell suspensions prepared from Ldlr −/− and Ldlr −/− apoA‐I −/− mouse spleen and bone marrow, respectively, which were assayed for free and total cholesterol by mass spectrometry. In both genotypes and in both immune cell compartments, treatment with apoA‐I reduced the EC/TC ratio. Aliquots of cells from the same mice were analyzed for surface markers using FACS. B, Representative histogram for spleen cells expressing CD131 from Ldlr −/− mice fed chow, Western diet, or Western diet±apoA‐I, while (C) shows the quantification of the total number of CD131+ spleen cells from each of the 3 treatment groups. E, Representative histogram for bone marrow cells expressing CD131+ from Ldlr −/− mice fed chow, Western diet, or Western diet±apoA‐I, while (F) shows the quantification of the total number of CD131+ bone marrow cells from each of the 3 treatment groups. Results are expressed as the mean±SD for 4 to 15 mice per group. Unlike letters indicate statistical significant at P<0.05.
Figure 6
Figure 6
Apolipoprotein A‐I (apoA‐I) treatment reduces LSK cells expressing CD131 in the bone marrow of Ldlr −/− mice. Single‐cell suspensions were prepared from Ldlr −/− bone marrow and analyzed for surface markers using FACS. The left panel shows representative plots indicating gating of live bone marrow cells from diet‐fed Ldlr −/− mice that were linage negative (Lin) and expressing c‐Kit and Sca‐1 (LSK cells). The middle panel shows representative plots indicating gating of live bone marrow cells from diet+apoA‐I–treated Ldlr −/− mice that were linage negative (Lin) and expressing c‐Kit and Sca‐1 (LSK cells). The right panel shows representative histograms of LSK cells expressing CD131 for Ldlr −/− mice fed diet (solid line‐shaded) and diet+apoA‐I treatment (dotted line). The data are expressed as the percentage of total bone marrow cells and reflect the mean±SD for 6 to 8 mice per group.
Figure 7
Figure 7
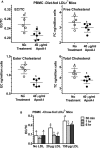
Apolipoprotein A‐I (apoA‐I) reduces cholesterol content in ex vivo peripheral blood mononuclear cells (PBMCs), while incubation with low‐density lipoprotein (LDL) increase the EC/TC ratio. A, The ester cholesterol (EC) to total cholesterol (TC) ratio, free cholesterol (FC), EC, and TC content in freshly isolated ex vivo PBMCs from diet‐fed Ldlr −/− mice expressed as ng/million cells. Approximately 3×10⁵ cells were incubated with 40 μg/mL of lipid‐free human apoA‐I in serum‐free medium for 4 hours at 37°C. Following the incubation, the cells were washed with PBS then stored at −80°C until mass spectrometry was performed, as described in the Methods section. B, The EC/TC ratio following incubation of ≈3×10⁵ PBMCs from chow‐fed Ldlr −/− mice incubated with 150 μg/mL of human LDL protein for 30 minutes, 1 hour, or 6 hours in a final volume of 1 mL of serum‐free medium. Following incubation, the cells were washed extensively with PBS then stored at −80°C until mass spectrometry was performed as described in the Methods section. Results are expressed as the mean±SD for 4 to 6 mice per group. Unlike letters indicate statistical significance at P<0.05.
Figure 8
Figure 8
Apolipoprotein A‐I (apoA‐I) treatment changed the cholesterol distribution in J774 cells and modulated lipid raft composition. Confluent J774 cells were incubated in the presence or absence of 100 μg/mL of human low‐density lipoprotein (LDL) protein for 72 hours. After pretreatment of the cells, the monolayers were washed with serum‐free medium and then incubated overnight with either 40 μg/mL of lipid‐free apoA‐I or 40 μg/mL of bovine serum albumin (BSA). The next day, cells were removed from the wells with Versene and washed, and aliquots were used for either lipid extraction or for nondetergent lipid raft isolation. A, The esterified cholesterol/total cholesterol (EC/TC) ratio in J774 cells treated with the indicated conditions showing that incubation with lipid‐free apoA‐I reduces the cellular EC even when the cells were not preloaded with LDL cholesterol. B, Western blot analysis of lipid rafts fractions from each of the indicated treatments of J774 cells following sucrose density gradient centrifugation of nondetergent extracted cells. The top panel shows lipid raft fractions from untreated J774 cells (−LDL, −apoA‐I); the middle panel shows lipid raft fractions from J774 cells treated with 100 μg/mL of LDL for 72 hours, washed and then incubated overnight with 40 μg/mL of BSA (+LDL, −apoA‐I); (B) the bottom panel shows lipid raft fractions from J774 cells treated with 100 μg/mL LDL, washed and then incubated overnight with 40 μg/mL apoA‐I (+LDL, +apoA‐I). C, The cholesterol to phospholipid ratio for each fraction from each of the indicated treatments, as determined by mass spectrometry analyses. D, The intensity ratio of flotillin normalized to the intensity of nonraft tubulin fraction #7, as determined from scans of the corresponding Western blot. E, The intensity ratio of IL‐3β receptor normalized to the intensity of nonraft tubulin fraction #7 from scans of the corresponding Western blot. These ratios are the mean±SD of 3 different raft preparations from plates of J774 cells under each of the indicated conditions.

Similar articles

Cited by

References

    1. Emerging Risk Factors Collaboration , Di Angelantonio E, Sarwar N, Perry P, Kaptoge S, Ray KK, Thompson A, Wood AM, Lewington S, Sattar N, Packard CJ, Collins R, Thompson SG, Danesh J. Major lipids, apolipoproteins, and risk of vascular disease. JAMA. 2009;302:1993–2000. - PMC - PubMed
    1. Degoma EM, Rader DJ. Novel HDL‐directed pharmacotherapeutic strategies. Nat Rev Cardiol. 2011;8:266–277. - PMC - PubMed
    1. Voight BF, Peloso GM, Orho‐Melander M, Frikke‐Schmidt R, Barbalic M, Jensen MK, Hindy G, Holm H, Ding EL, Johnson T, Schunkert H, Samani NJ, Clarke R, Hopewell JC, Thompson JF, Li M, Thorleifsson G, Newton‐Cheh C, Musunuru K, Pirruccello JP, Saleheen D, Chen L, Stewart AF, Schillert A, Thorsteinsdottir U, Thorgeirsson G, Anand S, Engert JC, Morgan T, Spertus J, Stoll M, Berger K, Martinelli N, Girelli D, McKeown PP, Patterson CC, Epstein SE, Devaney J, Burnett MS, Mooser V, Ripatti S, Surakka I, Nieminen MS, Sinisalo J, Lokki ML, Perola M, Havulinna A, de Faire U, Gigante B, Ingelsson E, Zeller T, Wild P, de Bakker PI, Klungel OH, Maitland‐van der Zee AH, Peters BJ, de Boer A, Grobbee DE, Kamphuisen PW, Deneer VH, Elbers CC, Onland‐Moret NC, Hofker MH, Wijmenga C, Verschuren WM, Boer JM, van der Schouw YT, Rasheed A, Frossard P, Demissie S, Willer C, Do R, Ordovas JM, Abecasis GR, Boehnke M, Mohlke KL, Daly MJ, Guiducci C, Burtt NP, Surti A, Gonzalez E, Purcell S, Gabriel S, Marrugat J, Peden J, Erdmann J, Diemert P, Willenborg C, Konig IR, Fischer M, Hengstenberg C, Ziegler A, Buysschaert I, Lambrechts D, Van de Werf F, Fox KA, El Mokhtari NE, Rubin D, Schrezenmeir J, Schreiber S, Schafer A, Danesh J, Blankenberg S, Roberts R, McPherson R, Watkins H, Hall AS, Overvad K, Rimm E, Boerwinkle E, Tybjaerg‐Hansen A, Cupples LA, Reilly MP, Melander O, Mannucci PM, Ardissino D, Siscovick D, Elosua R, Stefansson K, O'Donnell CJ, Salomaa V, Rader DJ, Peltonen L, Schwartz SM, Altshuler D, Kathiresan S. Plasma HDL cholesterol and risk of myocardial infarction: a Mendelian randomisation study. Lancet. 2012;380:564. - PMC - PubMed
    1. Barter PJ, Rye KA. Cholesteryl ester transfer protein inhibition is not yet dead‐pro. Arterioscler Thromb Vasc Biol. 2016;36:439–441. - PubMed
    1. Heinecke JW. Small HDL promotes cholesterol efflux by the ABCA1 pathway in macrophages: implications for therapies targeted to HDL. Circ Res. 2015;116:1101–1103. - PMC - PubMed

Publication types

MeSH terms

LinkOut - more resources