

Inhibition of citrate cotransporter Slc13a5/mINDY by RNAi improves hepatic insulin sensitivity and prevents diet-induced non-alcoholic fatty liver disease in mice
- PMID: 27818933
- PMCID: PMC5081411
- DOI: 10.1016/j.molmet.2016.08.004
Inhibition of citrate cotransporter Slc13a5/mINDY by RNAi improves hepatic insulin sensitivity and prevents diet-induced non-alcoholic fatty liver disease in mice
Abstract
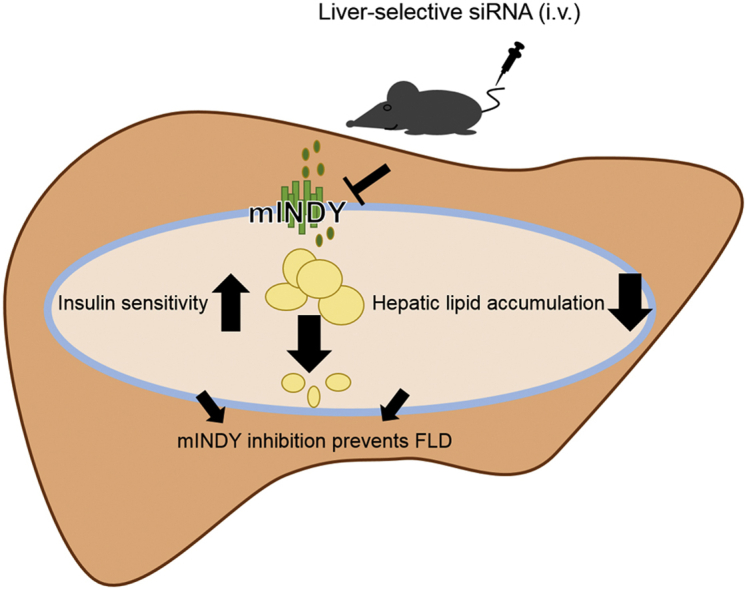
Objective: Non-alcoholic fatty liver disease is a world-wide health concern and risk factor for cardio-metabolic diseases. Citrate uptake modifies intracellular hepatic energy metabolism and is controlled by the conserved sodium-dicarboxylate cotransporter solute carrier family 13 member 5 (SLC13A5, mammalian homolog of INDY: mINDY). In Drosophila melanogaster and Caenorhabditis elegans INDY reduction decreased whole-body lipid accumulation. Genetic deletion of Slc13a5 in mice protected from diet-induced adiposity and insulin resistance. We hypothesized that inducible hepatic mINDY inhibition should prevent the development of fatty liver and hepatic insulin resistance.
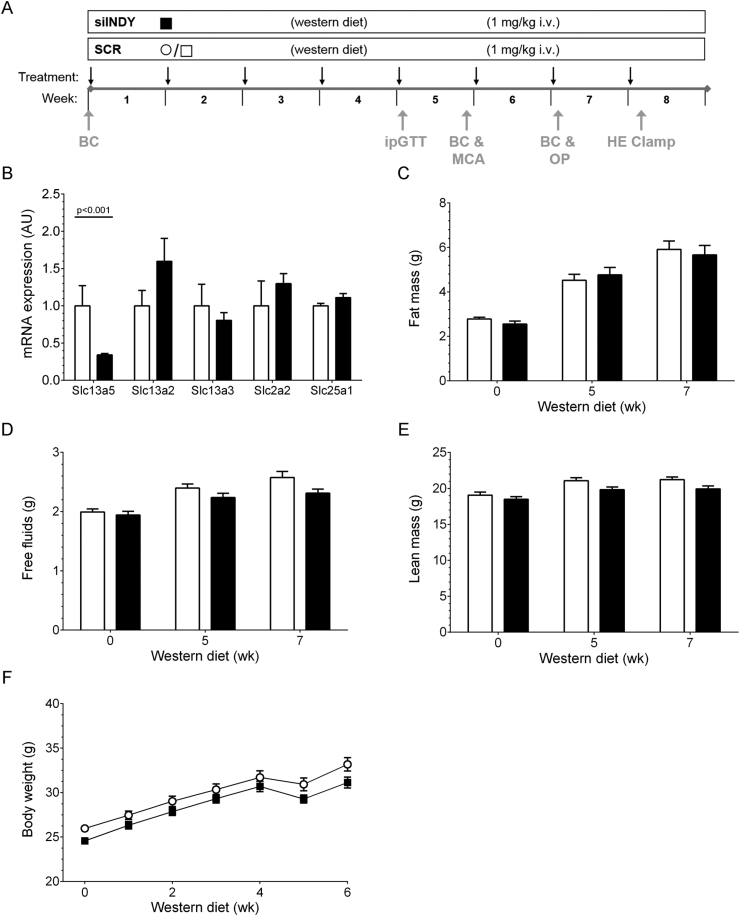
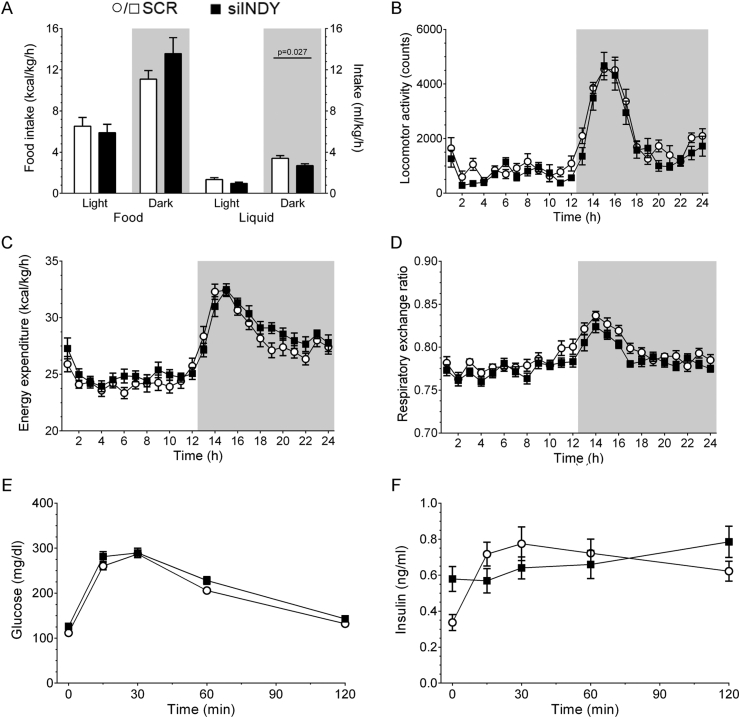
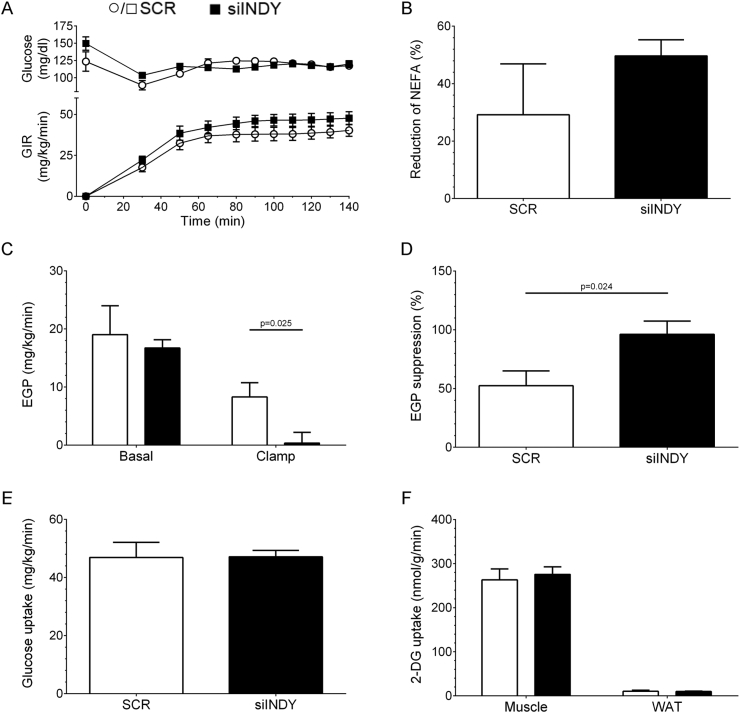
Methods: Adult C57BL/6J mice were fed a Western diet (60% kcal from fat, 21% kcal from carbohydrate) ad libitum. Knockdown of mINDY was induced by weekly injection of a chemically modified, liver-selective siRNA for 8 weeks. Mice were metabolically characterized and the effect of mINDY suppression on glucose tolerance as well as insulin sensitivity was assessed with an ipGTT and a hyperinsulinemic-euglycemic clamp. Hepatic lipid accumulation was determined by biochemical measurements and histochemistry.
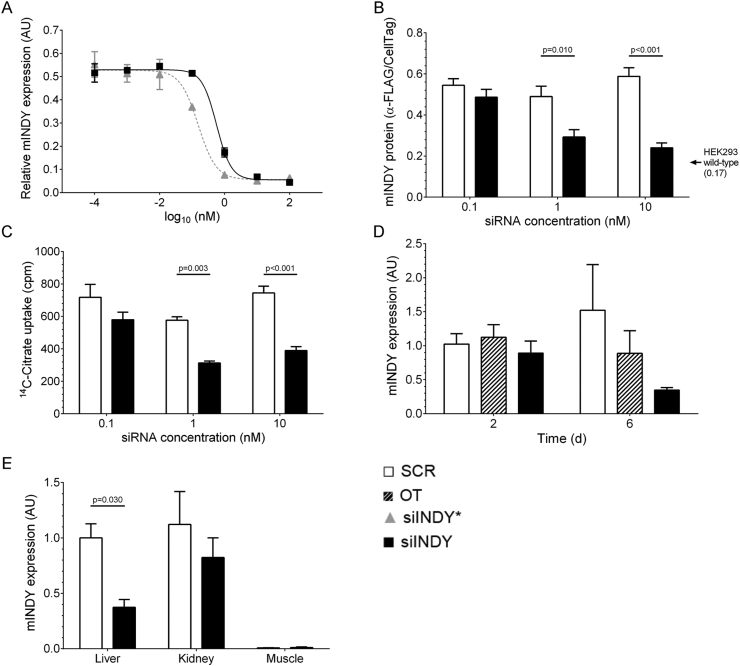
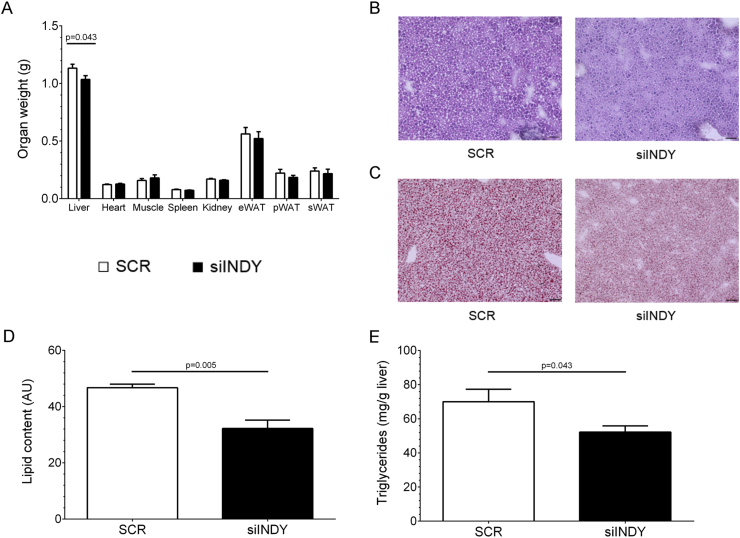
Results: Within the 8 week intervention, hepatic mINDY expression was suppressed by a liver-selective siRNA by over 60%. mINDY knockdown improved hepatic insulin sensitivity (i.e. insulin-induced suppression of endogenous glucose production) of C57BL/6J mice in the hyperinsulinemic-euglycemic clamp. Moreover, the siRNA-mediated mINDY inhibition prevented neutral lipid storage and triglyceride accumulation in the liver, while we found no effect on body weight.
Conclusions: We show that inducible mINDY inhibition improved hepatic insulin sensitivity and prevented diet-induced non-alcoholic fatty liver disease in adult C57BL6/J mice. These effects did not depend on changes of body weight or body composition.
Keywords: 2-DG, 2-Deoxy-d-glucose; Citrate transport; EE, energy expenditure; EGP, endogenous glucose production; FA, fatty acids; FLD, fatty liver disease; GIR, glucose infusion rate; HE clamp, hyperinsulinemic-euglycemic clamp; HFD, high-fat diet; IEX, anion-exchange high-performance liquid chromatography; INDY, ‘I'm not dead Yet’; INDY/Slc13a5; Insulin resistance; KO, knockout; Lipid accumulation; ORO, oil red O; RER, respiratory exchange ratio; SCR, non-silencing scrambled control siRNA; SKM, skeletal muscle; Steatosis; T2D, type-2 diabetes; TCA, tricarboxylic acid; WAT, white adipose tissue; WD, western diet; e, epididymal; mINDY, Slc13a5/SLC13A5; p, perirenal; s, subcutaneous; siINDY, mINDY-specific siRNA; siRNA; solute carrier family 13, member 5.
Figures
Similar articles
-
INDY-A New Link to Metabolic Regulation in Animals and Humans.Front Genet. 2017 May 24;8:66. doi: 10.3389/fgene.2017.00066. eCollection 2017. Front Genet. 2017. PMID: 28596784 Free PMC article. Review.
-
Prevention of diet-induced hepatic steatosis and hepatic insulin resistance by second generation antisense oligonucleotides targeted to the longevity gene mIndy (Slc13a5).Aging (Albany NY). 2015 Dec;7(12):1086-93. doi: 10.18632/aging.100854. Aging (Albany NY). 2015. PMID: 26647160 Free PMC article.
-
The longevity gene INDY (I'm Not Dead Yet) in metabolic control: Potential as pharmacological target.Pharmacol Ther. 2018 May;185:1-11. doi: 10.1016/j.pharmthera.2017.10.003. Epub 2017 Oct 5. Pharmacol Ther. 2018. PMID: 28987323 Review.
-
Arylhydrocarbon receptor-dependent mIndy (Slc13a5) induction as possible contributor to benzo[a]pyrene-induced lipid accumulation in hepatocytes.Toxicology. 2015 Nov 4;337:1-9. doi: 10.1016/j.tox.2015.08.007. Epub 2015 Aug 21. Toxicology. 2015. PMID: 26303333
-
Deletion of the mammalian INDY homolog mimics aspects of dietary restriction and protects against adiposity and insulin resistance in mice.Cell Metab. 2011 Aug 3;14(2):184-95. doi: 10.1016/j.cmet.2011.06.009. Cell Metab. 2011. PMID: 21803289 Free PMC article.
Cited by
-
Liver-Specific Knockdown of Class IIa HDACs Has Limited Efficacy on Glucose Metabolism but Entails Severe Organ Side Effects in Mice.Front Endocrinol (Lausanne). 2020 Aug 28;11:598. doi: 10.3389/fendo.2020.00598. eCollection 2020. Front Endocrinol (Lausanne). 2020. PMID: 32982982 Free PMC article.
-
Metabolic flux from the Krebs cycle to glutamate transmission tunes a neural brake on seizure onset.PLoS Genet. 2021 Oct 29;17(10):e1009871. doi: 10.1371/journal.pgen.1009871. eCollection 2021 Oct. PLoS Genet. 2021. PMID: 34714823 Free PMC article.
-
INDY-A New Link to Metabolic Regulation in Animals and Humans.Front Genet. 2017 May 24;8:66. doi: 10.3389/fgene.2017.00066. eCollection 2017. Front Genet. 2017. PMID: 28596784 Free PMC article. Review.
-
Suppressed de novo lipogenesis by plasma membrane citrate transporter inhibitor promotes apoptosis in HepG2 cells.FEBS Open Bio. 2018 May 14;8(6):986-1000. doi: 10.1002/2211-5463.12435. eCollection 2018 Jun. FEBS Open Bio. 2018. PMID: 29928578 Free PMC article.
-
Structure and inhibition mechanism of the human citrate transporter NaCT.Nature. 2021 Mar;591(7848):157-161. doi: 10.1038/s41586-021-03230-x. Epub 2021 Feb 17. Nature. 2021. PMID: 33597751 Free PMC article.
References
-
- Browning J.D., Szczepaniak L.S., Dobbins R., Nuremberg P., Horton J.D., Cohen J.C. Prevalence of hepatic steatosis in an urban population in the United States: impact of ethnicity. Hepatology. 2004;40(6):1387–1395. - PubMed
-
- Haslam D.W., James W.P. Obesity. Lancet. 2005;366(9492):1197–1209. - PubMed
-
- Aguilar-Valles A., Inoue W., Rummel C., Luheshi G.N. Obesity, adipokines and neuroinflammation. Neuropharmacology. 2015;96(Pt A):124–134. - PubMed
-
- Farrell G.C., Larter C.Z. Nonalcoholic fatty liver disease: from steatosis to cirrhosis. Hepatology. 2006;43(2 Suppl 1):S99–S112. - PubMed
Publication types
MeSH terms
Substances
LinkOut - more resources
Full Text Sources
Other Literature Sources
Medical
Research Materials
