

Renoprotection From Diabetic Complications in OVE Transgenic Mice by Endothelial Cell Specific Overexpression of Metallothionein: A TEM Stereological Analysis
- PMID: 27813325
- PMCID: PMC5309165
- DOI: 10.1002/ar.23511
Renoprotection From Diabetic Complications in OVE Transgenic Mice by Endothelial Cell Specific Overexpression of Metallothionein: A TEM Stereological Analysis
Abstract
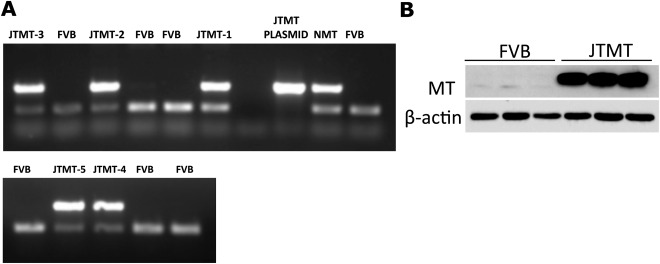
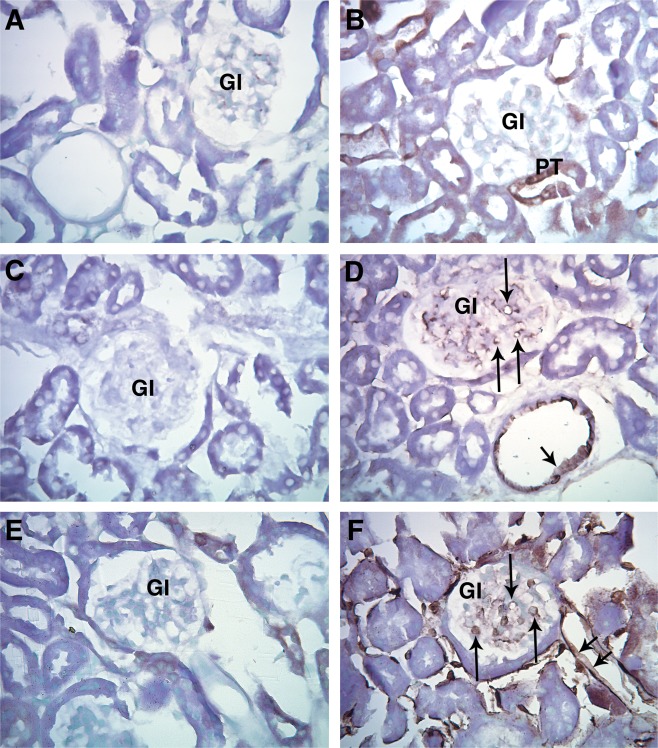
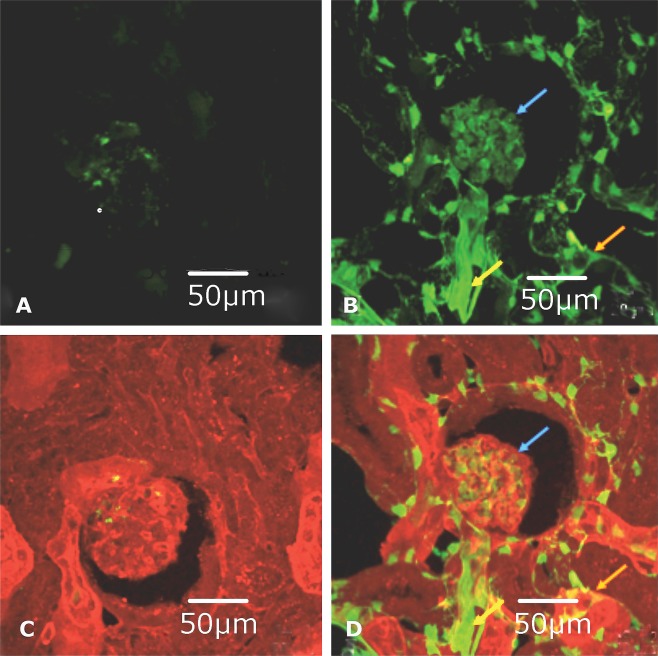
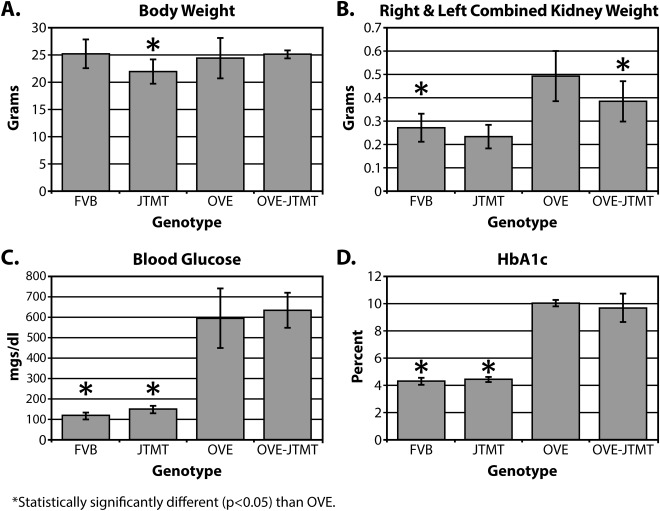
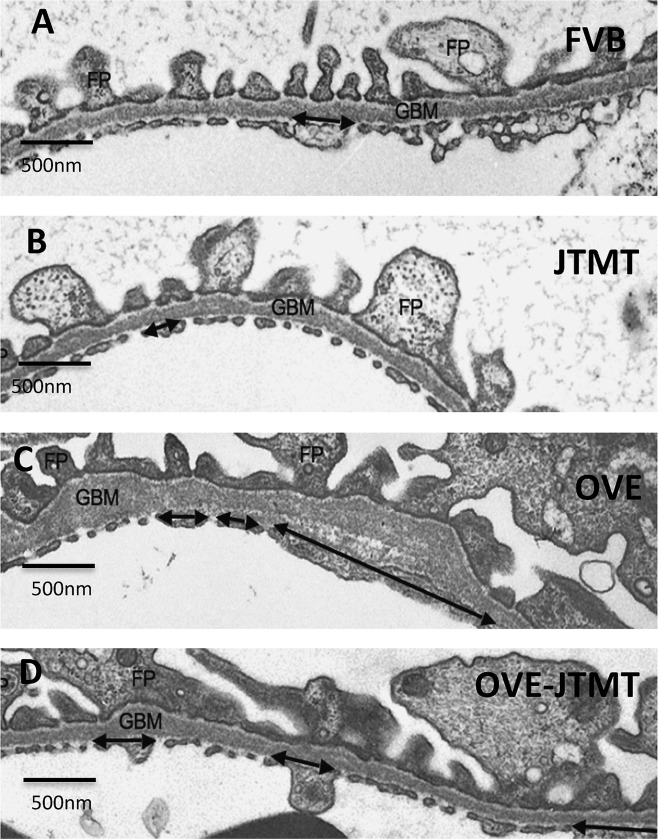
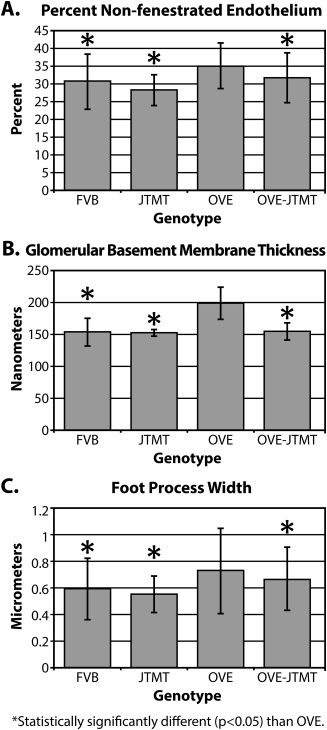
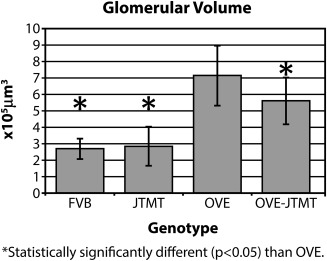
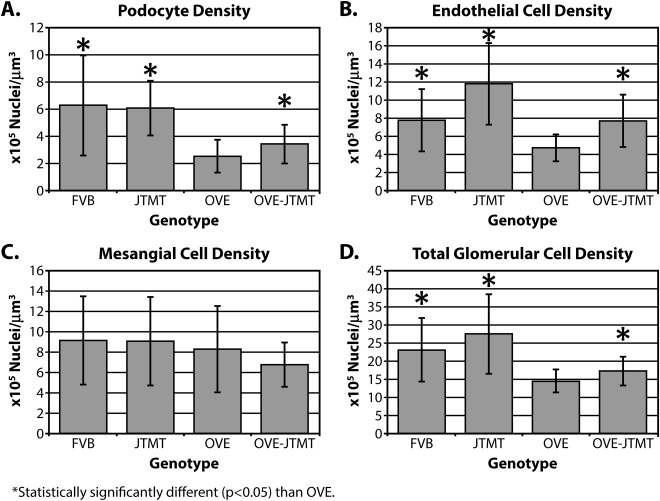
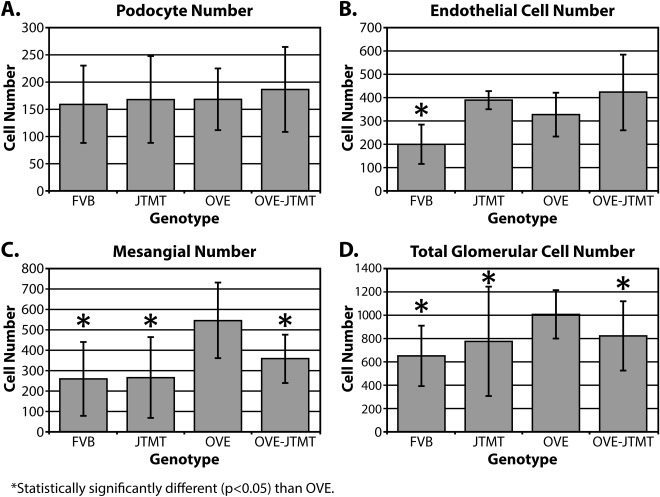
We previously demonstrated that OVE transgenic diabetic mice are susceptible to chronic complications of diabetic nephropathy (DN) including substantial oxidative damage to the renal glomerular filtration barrier (GFB). Importantly, the damage was mitigated significantly by overexpression of the powerful antioxidant, metallothionein (MT) in podocytes. To test our hypothesis that GFB damage in OVE mice is the result of endothelial oxidative insult, a new JTMT transgenic mouse was designed in which MT overexpression was targeted specifically to endothelial cells. At 60 days of age, JTMT mice were crossed with age-matched OVE diabetic mice to produce bi-transgenic OVE-JTMT diabetic progeny that carried the endothelial targeted JTMT transgene. Renal tissues from the OVE-JTMT progeny were examined by unbiased TEM stereometry for possible GFB damage and other alterations from chronic complications of DN. In 150 day-old OVE-JTMT mice, blood glucose and HbA1c were indistinguishable from age-matched OVE mice. However, endothelial-specific MT overexpression in OVE-JTMT mice mitigated several DN complications including significantly increased non-fenestrated glomerular endothelial area, and elimination of glomerular basement membrane thickening. Significant renoprotection was also observed outside of endothelial cells, including reduced podocyte effacement, and increased podocyte and total glomerular cell densities. Moreover, when compared to OVE diabetic animals, OVE-JTMT mice showed significant mitigation of nephromegaly, glomerular hypertrophy, increased mesangial cell numbers and increased total glomerular cell numbers. These results confirm the importance of oxidative stress to glomerular damage in DN, and show the central role of endothelial cell injury to the pathogenesis of chronic complications of diabetes. Anat Rec, 2017. © 2017 Wiley Periodicals, Inc. Anat Rec, 300:560-576, 2017. © 2016 Wiley Periodicals, Inc.
Keywords: diabetic mice; electron microscopy; glomerular basement membrane; glomerular cells; glomerular filtration barrier.
© 2016 Wiley Periodicals, Inc.
Conflict of interest statement
There are no potential conflicts of interest regarding financial and personal relationships between any of the authors and other individuals that might bias their work. Also, no part of this manuscript has been submitted or is currently being considered for publication elsewhere. The ethical background for this study derives from an ethically neutral hypothesis and all data collection and interpretation have been carried out in the absence of unethical behavior. No ethical committee has reviewed the manuscript.
Figures
Similar articles
-
Podocyte-specific overexpression of metallothionein mitigates diabetic complications in the glomerular filtration barrier and glomerular histoarchitecture: a transmission electron microscopy stereometric analysis.Diabetes Metab Res Rev. 2013 Feb;29(2):113-24. doi: 10.1002/dmrr.2342. Diabetes Metab Res Rev. 2013. PMID: 22926941
-
Podocyte-specific overexpression of the antioxidant metallothionein reduces diabetic nephropathy.J Am Soc Nephrol. 2008 Nov;19(11):2077-85. doi: 10.1681/ASN.2007080967. Epub 2008 Jul 16. J Am Soc Nephrol. 2008. PMID: 18632844 Free PMC article.
-
Endothelial cell and podocyte autophagy synergistically protect from diabetes-induced glomerulosclerosis.Autophagy. 2015;11(7):1130-45. doi: 10.1080/15548627.2015.1049799. Autophagy. 2015. PMID: 26039325 Free PMC article.
-
Glomerular endothelial cell injury and cross talk in diabetic kidney disease.Am J Physiol Renal Physiol. 2015 Feb 15;308(4):F287-97. doi: 10.1152/ajprenal.00533.2014. Epub 2014 Nov 19. Am J Physiol Renal Physiol. 2015. PMID: 25411387 Free PMC article. Review.
-
Rethinking glomerular basement membrane thickening in diabetic nephropathy: adaptive or pathogenic?Am J Physiol Renal Physiol. 2016 Nov 1;311(5):F831-F843. doi: 10.1152/ajprenal.00313.2016. Epub 2016 Aug 31. Am J Physiol Renal Physiol. 2016. PMID: 27582102 Free PMC article. Review.
Cited by
-
Endothelial Overexpression of Metallothionein Prevents Diabetes-Induced Impairment in Ischemia Angiogenesis Through Preservation of HIF-1α/SDF-1/VEGF Signaling in Endothelial Progenitor Cells.Diabetes. 2020 Aug;69(8):1779-1792. doi: 10.2337/db19-0829. Epub 2020 May 13. Diabetes. 2020. PMID: 32404351 Free PMC article.
References
-
- Basgen J, Nicholas S, Mauer M, Rozen S, Nyengaard J. 2006. Comparison of methods for counting cells in the mouse glomerulus. Nephron Exp Nephrol 103:e:139–e148. - PubMed
-
- Baur P, Stacey T. 1977. The use of PIPES buffer in the fixation of mammalian and marine tissues for electron microscopy. J Microsc 109:315–327. - PubMed
-
- Baynes J. 1991. Role of oxidative stress in development of complications in diabetes. Diabetes 40:405–412. - PubMed
-
- Bilous R, Mauer M, Sutherland D, Steffes M. 1989. Mean glomerular volume and rate of development of diabetic nephropathy. Diabetes 38:1142–1147. - PubMed
Publication types
MeSH terms
Substances
Grants and funding
LinkOut - more resources
Full Text Sources
Other Literature Sources
Medical
Molecular Biology Databases
