

Gradients of connectivity distance are anchored in primary cortex
- PMID: 27807628
- PMCID: PMC5504232
- DOI: 10.1007/s00429-016-1333-7
Gradients of connectivity distance are anchored in primary cortex
Abstract
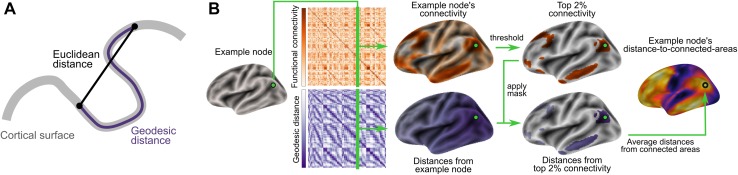
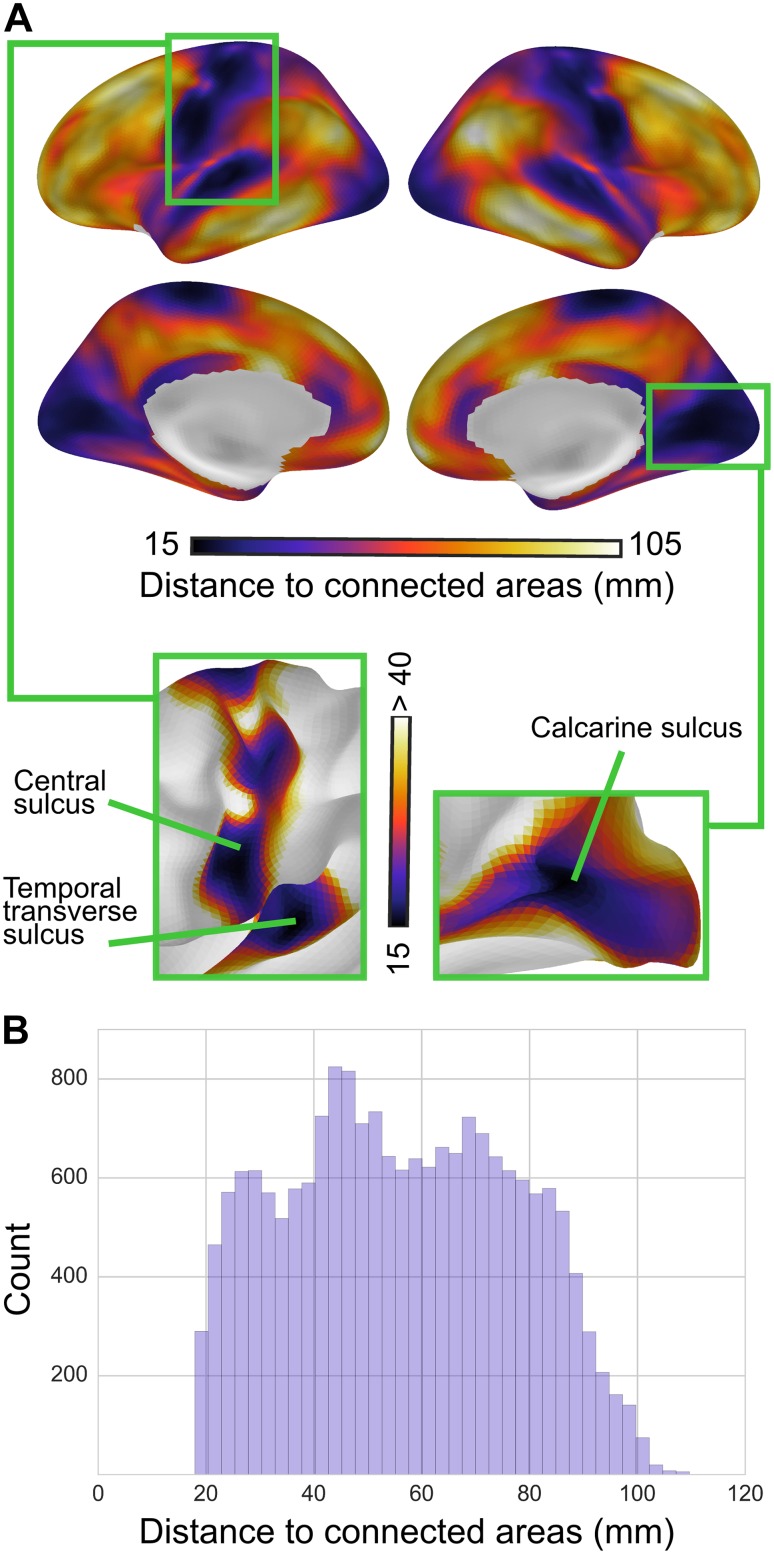
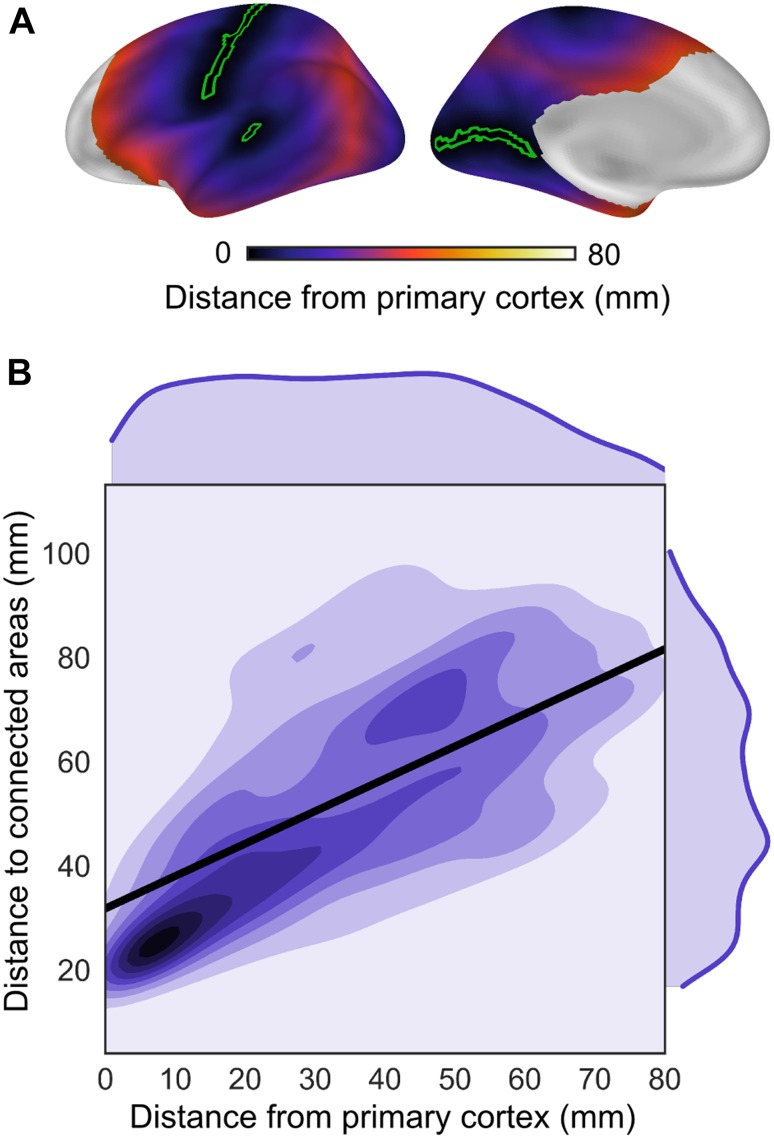
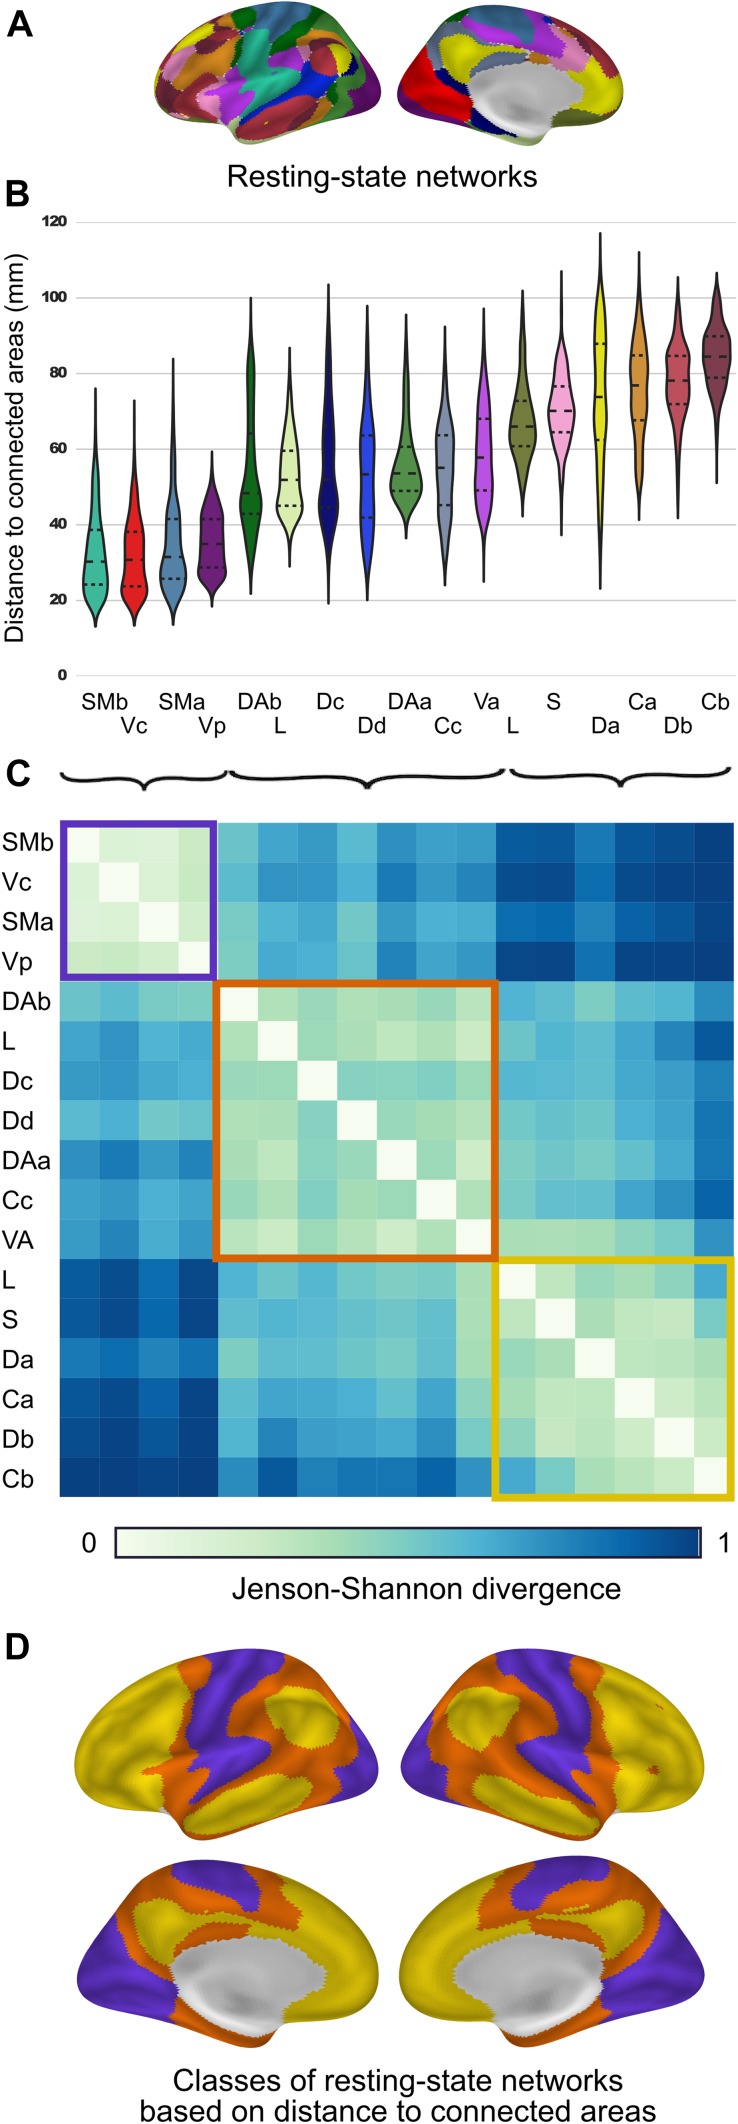
Connectivity between distant cortical areas is a valuable, yet costly feature of cortical organization and is predominantly found between regions of heteromodal association cortex. The recently proposed 'tethering hypothesis' describes the emergence of long-distance connections in association cortex as a function of their spatial separation from primary cortical regions. Here, we investigate this possibility by characterizing the distance between functionally connected areas along the cortical surface. We found a systematic relationship between an area's characteristic connectivity distance and its distance from primary cortical areas. Specifically, the further a region is located from primary sensorimotor regions, the more distant are its functional connections with other areas of the cortex. The measure of connectivity distance also captured major functional subdivisions of the cerebral cortex: unimodal, attention, and higher-order association regions. Our findings provide evidence for the anchoring role of primary cortical regions in establishing the spatial distribution of cortical properties that are related to functional specialization and differentiation.
Keywords: Connectivity; Cortical organization; Spatial organization; Topography.
Conflict of interest statement
Conflict of interest
The authors declare that they have no conflict of interest.
Ethical approval
All procedures performed in studies involving human participants were in accordance with the ethical standards of the institutional and/or national research committee and with the 1964 Helsinki Declaration and its later amendments or comparable ethical standards.
Figures
Similar articles
-
Gradients of connectivity distance in the cerebral cortex of the macaque monkey.Brain Struct Funct. 2019 Mar;224(2):925-935. doi: 10.1007/s00429-018-1811-1. Epub 2018 Dec 13. Brain Struct Funct. 2019. PMID: 30547311 Free PMC article.
-
A resilient, low-frequency, small-world human brain functional network with highly connected association cortical hubs.J Neurosci. 2006 Jan 4;26(1):63-72. doi: 10.1523/JNEUROSCI.3874-05.2006. J Neurosci. 2006. PMID: 16399673 Free PMC article.
-
Situating the default-mode network along a principal gradient of macroscale cortical organization.Proc Natl Acad Sci U S A. 2016 Nov 1;113(44):12574-12579. doi: 10.1073/pnas.1608282113. Epub 2016 Oct 18. Proc Natl Acad Sci U S A. 2016. PMID: 27791099 Free PMC article.
-
Parcellating Cerebral Cortex: How Invasive Animal Studies Inform Noninvasive Mapmaking in Humans.Neuron. 2018 Aug 22;99(4):640-663. doi: 10.1016/j.neuron.2018.07.002. Neuron. 2018. PMID: 30138588 Free PMC article. Review.
-
Cortical chemoarchitecture shapes macroscale effective functional connectivity patterns in macaque cerebral cortex.Hum Brain Mapp. 2016 May;37(5):1856-65. doi: 10.1002/hbm.23141. Epub 2016 Mar 11. Hum Brain Mapp. 2016. PMID: 26970255 Free PMC article. Review.
Cited by
-
Network evolution of regional brain volumes in young children reflects neurocognitive scores and mother's education.Sci Rep. 2023 Feb 20;13(1):2984. doi: 10.1038/s41598-023-29797-1. Sci Rep. 2023. PMID: 36804963 Free PMC article.
-
Influence of noninvasive brain stimulation on connectivity and local activation: a combined tDCS and fMRI study.Eur Arch Psychiatry Clin Neurosci. 2024 Jun;274(4):827-835. doi: 10.1007/s00406-023-01666-y. Epub 2023 Aug 19. Eur Arch Psychiatry Clin Neurosci. 2024. PMID: 37597023 Free PMC article.
-
Autism spectrum disorder-specific changes in white matter connectome edge density based on functionally defined nodes.Front Neurosci. 2023 Nov 23;17:1285396. doi: 10.3389/fnins.2023.1285396. eCollection 2023. Front Neurosci. 2023. PMID: 38075286 Free PMC article.
-
Differences in cortical microstructure according to body mass index in neurologically healthy populations using structural magnetic resonance imaging.Heliyon. 2024 Jun 15;10(12):e33134. doi: 10.1016/j.heliyon.2024.e33134. eCollection 2024 Jun 30. Heliyon. 2024. PMID: 38984310 Free PMC article.
-
Genetic and phylogenetic uncoupling of structure and function in human transmodal cortex.Nat Commun. 2022 May 9;13(1):2341. doi: 10.1038/s41467-022-29886-1. Nat Commun. 2022. PMID: 35534454 Free PMC article.
References
MeSH terms
LinkOut - more resources
Full Text Sources
Other Literature Sources
