. 2016 Nov 2;12(11):e1005996.
doi: 10.1371/journal.ppat.1005996. eCollection 2016 Nov.

A Mouse Model of Chronic West Nile Virus Disease

Affiliations

A Mouse Model of Chronic West Nile Virus Disease

Jessica B Graham et al. PLoS Pathog. .

Abstract

Infection with West Nile virus (WNV) leads to a range of disease outcomes, including chronic infection, though lack of a robust mouse model of chronic WNV infection has precluded identification of the immune events contributing to persistent infection. Using the Collaborative Cross, a population of recombinant inbred mouse strains with high levels of standing genetic variation, we have identified a mouse model of persistent WNV disease, with persistence of viral loads within the brain. Compared to lines exhibiting no disease or marked disease, the F1 cross CC(032x013)F1 displays a strong immunoregulatory signature upon infection that correlates with restraint of the WNV-directed cytolytic response. We hypothesize that this regulatory T cell response sufficiently restrains the immune response such that a chronic infection can be maintained in the CNS. Use of this new mouse model of chronic neuroinvasive virus will be critical in developing improved strategies to prevent prolonged disease in humans.


Conflict of interest statement

The authors have declared that no competing interests exist.

Figures

Fig 1
Fig 1. CC(032x013)F1 WNV-infected mice maintain a chronic WNV infection, with virus persisting in the CNS at d60.
Cohorts of mice were infected with 100pfu WNV. (A) Compared to the B6 model of infection, CC(032x013)F1 mice do not return to and exceed starting weight by d25 p.i., but maintain weight loss out to d60. (B) PCR for WNV in brain at indicated time points. Results are from two separate experiments: the discovery screen, which included d7, d12, d21, and d28 time points, and validation mice, which included d28 and d60 endpoints. Results were comparable for overlapping endpoints. Viral RNA was detected in the brains of 66% of d28 and 20% of d60 mice, for both CC(032x013)F1 and B6 mice. (C) Spleen WNV-specific and (D) Brain WNV-specific CD8+ T cells in B6 and CC(032x013)F1 mice at corresponding time points. The discovery screen included three mice per time point (d7, 12, 21, and 28) and the validation experiments included six mice per time point.
Fig 2
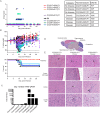
Fig 2. Comparison of WNV disease models by clinical presentation and neuropathology.
(A) Representative RIX lines for 3 WNV disease model categories: 1) No disease 2) Chronic disease and 3) Disease. Representative “No Disease” and “Disease” lines were selected from 40+ lines of each category, identified through the screen. Each RIX line’s CC nomenclature and Oas1b allele status is shown (N = null, F = functional allele). Clinical scores and (B) weight loss and survival curves are shown for the seven CC RIX lines over the time course of WNV infection. “No disease” RIX show little to no weight loss and maintain a “0” clinical score across the time course. “Disease” RIX lines show increased weight loss by d8, as well as increase in clinical scores corresponding to neurological weakness and paralysis (see description in methods). (C) Brain WNV loads at d12 for the seven lines. p<0.001 for CC(032x013)F1 compared to all disease lines. (D-E) Neuropathology of WNV infection in RIX lines as indicated. (D) The approximate subregions of the brain that were scored for neuropathology are colorized. These regions were chosen due to the quality and consistency of the sections across the high throughput histologic study. (E) Hematoxylin and eosin stained sections of formalin-fixed paraffin-embedded tissues of WNV-infected lines as indicated with subregion noted. Thalamus: Arrows indicate neurons. In the Chronic and Diseased tissues, the neurons are surrounded by glia (satellitosis). In the Disease tissue there is moderate hemorrhage (arrow), diffuse gliosis and mild malacia. Cortex Meninges: In the Chronic and Diseased boxed region there is gliosis in the superficial cortex with mononuclear cell infiltrate in the meninges, which is more pronounced and widespread in the Diseased tissue. There are prominent mononuclear cells with rod-shaped nuclei in the Diseased cortex (arrows) are consistent with activated microglia. Cortex: Arrowheads indicate blood vessels. In the Chronic and Diseased tissues there is mild to marked accumulation of mononuclear inflammatory cells in the vessel wall and perivascular space. In the Disease tissue there is moderate diffuse gliosis and perivascular cuffing. Cortex 40X: Arrowheads indicate neuron cell bodies. In the Chronic tissue, there are glial nodules and early degeneration of neurons with mild malacia. In the Disease tissue the neurons are shrunken with dark eosinophilic cytoplasm, and pyknotic nuclei consistent with acute neuronal degeneration to apoptosis (left arrow). Note karyorrhectic debris (small basophilic bodies). All panels 20X except where indicated. Data represent three mice per group for all lines in the screen, and six mice per group for d28 and d60 validation time points.
Fig 3
Fig 3. Differential innate immune signatures and viral load in the tissues.
Total RNA was isolated from spleens and brains from CC RIX mice infected with WNV for the indicated times. Plots show qPCR results for IFIT1 and IFN-ß expression (A) and WNV viral load in the spleen (B) and brain (C) as well as IFIT1, IFN-ß, and IL-12 expression in the brain (D) at innate time points, relative to mock values. Data represent 3 mice per group at d2, 7, and 12 time points in the discovery screen. Fig 3A & B, p<0.001 for all comparisons of CC(032x013)F1 to the other RIX lines at d2 (IFIT1 and IFN-ß); Fig 3C, p<0.01 for CC(032x013)F1 brain WNV load compared to the three non-disease lines at d7; Fig 3D, p<0.001 for all comparisons of CC(032x013)F1 to the other RIX lines at d2 (IFIT1); p<0.001 for all comparisons of CC(032x013)F1 to the other RIX lines at d7(IFN-ß and IL-12).
Fig 4
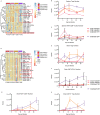
Fig 4. Flow cytometry heatmaps allow visualization of intra- and inter-strain comparisons of the immune response.
(A) Three representative “no disease” lines are compared to the chronic line for immunophenotypes measured by mutli-parameter flow cytometry. Infection status and clinical observations are shown in the top module, while flow cytometry data is shown in the heat map below. T cell subsets and activation markers are shown (blue = up, red = down). Compared to the “no disease” RIX lines, the chronic RIX shows increased Treg numbers in the spleen, and increase in activation of those Tregs. Conversely, the chronic RIX shows a lack of expansion in WNV-specific short lived effector cells when compared to the no disease lines (red boxes). (B-C) Total number of splenic Tregs and WNV-CD8+ SLECs, as indicated. At baseline, p = 0.0176 for comparison of splenic Treg numbers from CC(032x013)F1 and CC(011x042), with all others non-significant. At d21 post-infection, differences in splenic Treg number were statistically significant for CC(032x013)F1 compared to CC(017x004)F1, CC(011x042)F1, and CC(032x017)F1 (p = 0.0440, 0.0159, and 0.0316, respectively). At d7 post-infection, p = 0.0232 for comparison of splenic WNV-CD8+ SLECs from CC(032x013)F1 and CC(011x042)F1, with all other comparisons p>0.05. (D) Flow cytometry heatmap of brain immunophenotypes from the same “no disease” and chronic lines. (E-G) Total number of brain Tregs, Ki67+ CD4 T cells, Ki67+ CD8 T cells, and CD73+ Tregs, as indicated. At d7 post-infection, differences in brain Treg number were statistically significant for CC(032x013)F1 compared to CC(017x004)F1, CC(011x042)F1, and CC(032x017)F1 (p<0.05). At d28 post-infection, differences in brain Ki67+ CD4+ T cell number were statistically significant for CC(032x013)F1 compared to CC(017x004)F1, CC(011x042)F1, and CC(032x017)F1 (p<0.05). N = 3 mice per group for all time points shown.
Fig 5
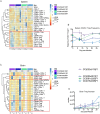
Fig 5. Chronic infection model mice show increased splenic Tregs over the time course of WNV infection compared to mice with disease.
(A) Three representative RIX lines with disease are compared to the chronic line, with T cell subsets and activation markers measured by flow cytometry as indicated (blue = up, red = down); data from spleen. (B) CD29+ Treg frequencies in the spleen. At d7 post-infection, differences in spleen CD29+ Treg frequency were statistically significant for CC(032x013)F1 compared to CC(005x001)F1, CC(061x026)F1, and CC(016x038)F1 (p<0.005). (C) Flow cytometry analysis heat maps from brain samples for the same lines and time points. (D) Brain Treg numbers. N = 3 mice per group for all time points shown.
Fig 6
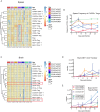
Fig 6. Flow cytometry visualization of the kinetics of the T cell response to WNV infection.
(A) T cell subsets and activation markers are shown by heatmap for no disease, chronic, and disease model RIX lines over the time course of infection (spleen), and (B) frequency of CXCR3+ Tregs in the spleen. At baseline, differences in splenic frequency of CXCR3+ Tregs were statistically significant for CC(032x013)F1 compared to CC(017x004)F1 and CC(011x042)F1, (p<0.001). (C) T cell subsets and activation markers shown by heatmap in the brain, and (D) brain Ki67+ CD4 T cell numbers, and (E) brain CD73+ Ki67+ Treg numbers. N = 3 mice per group for all time points shown.
Fig 7
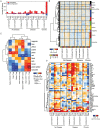
Fig 7. Mouse model of chronic WNV infection reveals that maintenance of cytolytic ability, associated with reduced activation of regulatory T cells, is critical for preventing viral persistence.
(A) Microarry expression analysis of number of differentially expressed (DE) genes upregulated (red) or downregulated (blue) in each RIX across time as compared to mock-infected samples (Fold change > 1.5, BH-adjusted p-value < 0.05). (B) Normalized expression profiles of all genes found to be DE in at least one sample, visualized as relative level across all samples. Each column depicts an individual mouse, with the timepoint designated by a colored bar underneath. Genes were clustered by bicor correlation and divided into modules each labeled by an identifying color and their most highly significant Gene Ontology (GO) Biological Process (BH-adjusted p-value < 0.05). Module processes are color coded: black: GO:0030593 neutrophil chemotaxis, purple: GO:0019835 cytolysis, pink: GO:1990126 retrograde transport, endosome to plasma membrane, green-yellow: GO:0045444 fat cell differentiation, blue: GO:0043401 steroid hormone mediated signaling pathway, red: categories below significance threshold, green: categories below significance threshold, yellow: GO:0034976 response to endoplasmic reticulum stress, magenta: GO:0051607 defense response to virus, brown: GO:0006260 DNA replication, turquoise: GO:0006783 heme biosynthetic process. (C) Correlation map of module eigengenes to key flow cytometric immunophenotypes. Box color represents positive (red) or negative (blue) correlation score. Asterisks denote statistical significance of correlation. (D) Differential expression of genes within the “purple” (cytolosis) module as visualized by log2 fold change over mock-infected samples. Asterisks indicate genes directly involved in cytolytic and NK-killer cell cytotoxicity. Data shown are from three mice per group, for each time point.

Similar articles

Cited by

References

    1. Colpitts TM, Conway MJ, Montgomery RR, Fikrig E (2012) West Nile Virus: biology, transmission, and human infection. Clinical microbiology reviews 25: 635–648. 10.1128/CMR.00045-12 - DOI - PMC - PubMed
    1. Sejvar JJ (2007) The long-term outcomes of human West Nile virus infection. Clinical infectious diseases: an official publication of the Infectious Diseases Society of America 44: 1617–1624. - PubMed
    1. Murray K, Walker C, Herrington E, Lewis JA, McCormick J, et al. (2010) Persistent infection with West Nile virus years after initial infection. J Infect Dis 201: 2–4. 10.1086/648731 - DOI - PMC - PubMed
    1. Daffis S, Samuel MA, Keller BC, Gale M Jr., Diamond MS (2007) Cell-specific IRF-3 responses protect against West Nile virus infection by interferon-dependent and -independent mechanisms. PLoS Pathog 3: e106 10.1371/journal.ppat.0030106 - DOI - PMC - PubMed
    1. Daffis S, Samuel MA, Suthar MS, Gale M Jr., Diamond MS (2008) Toll-like receptor 3 has a protective role against West Nile virus infection. Journal of virology 82: 10349–10358. 10.1128/JVI.00935-08 - DOI - PMC - PubMed