. 2016 Dec 16;91(1):e01434-16.
doi: 10.1128/JVI.01434-16. Print 2017 Jan 1.

Identification of Novel Kaposi's Sarcoma-Associated Herpesvirus Orf50 Transcripts: Discovery of New RTA Isoforms with Variable Transactivation Potential

Affiliations

Identification of Novel Kaposi's Sarcoma-Associated Herpesvirus Orf50 Transcripts: Discovery of New RTA Isoforms with Variable Transactivation Potential

Brian S Wakeman et al. J Virol. .

Abstract

Kaposi's sarcoma-associated herpesvirus (KSHV) is a gammaherpesvirus that has been associated with primary effusion lymphoma and multicentric Castleman's disease, as well as its namesake Kaposi's sarcoma. As a gammaherpesvirus, KSHV is able to acutely replicate, enter latency, and reactivate from this latent state. A key protein involved in both acute replication and reactivation from latency is the replication and transcriptional activator (RTA) encoded by the gene Orf50 RTA is a known transactivator of multiple viral genes, allowing it to control the switch between latency and virus replication. We report here the identification of six alternatively spliced Orf50 transcripts that are generated from four distinct promoters. These newly identified promoters are shown to be transcriptionally active in 293T (embryonic kidney), Vero (African-green monkey kidney epithelial), 3T12 (mouse fibroblast), and RAW 264.7 (mouse macrophage) cell lines. Notably, the newly identified Orf50 transcripts are predicted to encode four different isoforms of the RTA which differ by 6 to 10 residues at the amino terminus of the protein. We show the global viral transactivation potential of all four RTA isoforms and demonstrate that all isoforms can transcriptionally activate an array of KSHV promoters to various levels. The pattern of transcriptional activation appears to support a transcriptional interference model within the Orf50 region, where silencing of previously expressed isoforms by transcription initiation from upstream Orf50 promoters has the potential to modulate the pattern of viral gene activation.

Importance: Gammaherpesviruses are associated with the development of lymphomas and lymphoproliferative diseases, as well as several other types of cancer. The human gammaherpesvirus, Kaposi's sarcoma-associated herpesvirus (KSHV), is tightly associated with the development of Kaposi's sarcoma and multicentric Castleman's disease, as well as a rare form of B cell lymphoma (primary effusion lymphoma) primarily observed in HIV-infected individuals. RTA is an essential viral gene product involved in the initiation of gammaherpesvirus replication and is conserved among all known gammaherpesviruses. We show here for KSHV that transcription of the gene encoding RTA is complex and leads to the expression of several isoforms of RTA with distinct functions. This observed complexity in KSHV RTA expression and function likely plays a critical role in the regulation of downstream viral and cellular gene expression, leading to the efficient production of mature virions.

Keywords: Kaposi's sarcoma-associated herpesvirus; RTA isoforms; alternative promoter usage; alternative splicing; transcriptional activation.


Figures

FIG 1
FIG 1
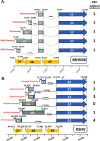
Genomic map demonstrating Orf50 transcripts, splicing, and reading frames of both MHV68 and KSHV. (A) Previously identified MHV68 genome (36) showing five unique Orf50 transcripts driven from four different promoters all encoding a single RTA protein isoform. (B) RACE analyses and primer walking of the KSHV Orf50 region performed using cDNAs generated from TPA-induced BCBL-1 KSHV PEL cell lines at 24 and 48 h postinfection. 5′ RACE analysis by nested PCR was performed using reverse primers located in E2 in conjunction with universal 5′ RACE forward primers. Primer walking was conducted using reverse primers located in E2 in conjunction with a series of forward primers at 50-bp intervals located upstream of previously identified transcripts. Experiments revealed the presence of six transcripts with five unique splicing events to the large E2 exon. Exon E1 is a 102-bp exon splicing out a 958-bp intron and extending the E2 ORF by 6 amino acids, while generating RTA isoform 1. Exon E0A is a 234-bp exon splicing out a 1,901-bp intron and extending the E2 ORF by 6 amino acids, while generating RTA isoform 2. Exon E0B is a 292-bp exon splicing out a 1,843-bp intron and extending the E2 ORF by 10 amino acids, while generating RTA isoform 3. Exon N3 is a noncoding 857-bp exon splicing out a 1,747-bp intron, while not extending the E2 ORF. Exon N4 is a 1,646-bp exon splicing out the same 958-bp intron as exon 1, resulting in the generation of RTA isoform 1. Finally, exon N5 is a 351-bp exon splicing out a 2,728-bp intron and extending the E2 ORF by 7 amino acids, while generating RTA isoform 4. Green arrows denote short ATG-initiated ORFs that lie within the RTA transcripts. Of note is the ATG located within the E2 coding region that without splicing generates a nonfunctional RTA protein. Blue represents the coding region of each RTA isoform. The locations of the major ORFs antisense to gene 50 are also shown for reference.
FIG 2
FIG 2
KSHV ORF50 alternative splicing leads to four RTA protein isoforms. (A) Amino acid structure of all four RTA protein isoforms. Black is representative of the homologous amino acid content of the exon 2 region, where for simplicity only the first 6 amino acids are shown. In red is the unique amino acid structure encoding each RTA isoform, isoform 1, a 6-amino-acid extension of the RTA protein generated by E1 and N4 transcripts; isoform 2, a 6-amino-acid extension of the RTA protein generated by E0A transcripts; isoform 3, a 10-amino-acid extension of the RTA protein generated by E0B transcripts; and isoform 4, a 7-amino-acid extension of the RTA protein generated by N5 transcripts. As seen, the small extensions of the RTA protein do not show any homologous amino acid content. (B) Various known functional domains of the RTA protein. Changes in amino acid structure by various isoforms only change a small number of amino acids but are changes to amino acids in the region essential for DNA binding. The essential DNA binding domains spans from amino acids 1 to 60, and the core DNA binding domain spans from amino acids 1 to 530. Also depicted are the ring finger-like domain (red), the multimerization domain (purple), the SUMO interaction motifs (SIMS) (orange), the serine/threonine-rich regions (blue), and the transactivation domain (green). Two nuclear localization signal sequences (NLS) are also depicted at the amino terminus end, as well as within the RTA protein toward the end of the DNA binding domain region (yellow). Also shown are the RBP-Jk and HDAC binding regions critical for RTA protein function.
FIG 3
FIG 3
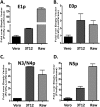
Promoter activity of the proximal, distal, N3/N4, and N5 Orf50 KSHV promoters in various cell types. (A) Vero, 3T12, and RAW 264.7 cells were transfected with pGL4.10[luc] luciferase reporter construct containing 250 bp upstream of the E1 exon. At 48 h posttransfection, luciferase assays were performed. (B) Vero, 3T12, and RAW 264.7 cells were transfected with the pGL4.10[luc] luciferase reporter construct containing 500 bp upstream of the E0A and E0B exon. At 48 h posttransfection, luciferase assays were performed. (C) Vero, 3T12, and RAW 264.7 cells were transfected with the pGL4.10[luc] luciferase reporter construct containing 500 bp upstream of the N3 and N4 exon. At 48 h posttransfection, luciferase assays were performed. (D) Vero, 3T12, and RAW 264.7 cells were transfected with the pGL4.10[luc] luciferase reporter construct containing 500 bp upstream of the N5 exon. At 48 h posttransfection, luciferase assays were performed. Data are presented as the fold difference in firefly luciferase activity versus the pGL4.10 empty vector control. The data represent triplicates of at least three independent transfections.
FIG 4
FIG 4
Immunoblot analyses of RTA isoform protein expression levels in transfected 293T human embryonic kidney cells. 293T cells were transfected with 2.5 μg of pCMV-Flag2B-Iso1, pCMV-Flag2B-Iso2, pCMV-Flag2B-Iso3, and pCMV-Flag2B-Iso4 DNA. For an expression control, cells were transfected with 2.5 μg of pCMV-Flag2B-Empty Vector (Ctl-1), and for a transfection control, cells were mock transfected (Ctl-2). The cells were harvested at 24 and 48 h posttransfection and lysed, and 30 μg of protein was used for the immunoblot analyses to assess the RTA expression levels. FLAG expression was used as readout of RTA protein expression from the pCMV-Flag2B vector. Immunoblots were stripped and then reprobed for β-actin levels to ensure equal protein loading.
FIG 5
FIG 5
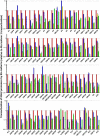
Transactivation potential of newly identified isoforms 2 to 4 compared to the transactivation potential of isoform 1 in 293T cells. Data generated from the transfection and transactivation experiment are plotted as the fold change in promoter transactivation potential compared to isoform 1, with isoform 1 set to 1. Experiments were conducted in triplicate, and data are plotted as the averages of three experiments. Isoform 1 is shown in red, isoform 2 is shown in blue, isoform 3 is shown in yellow, and isoform 4 is shown in green. The viral ORFs are shown in order of their location within the KSHV genome. ORFs that do not contain a bar corresponding to a given isoform are isoforms with transactivation differences below the given cut off 0.01 (e.g., Orf38 and Iso3).
FIG 6
FIG 6
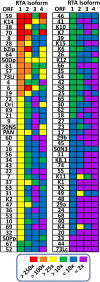
Transactivation potential for all RTA isoforms, where the general fold change in the activation of promoters associated with viral ORFs is shown. 293T cells were transfected with RTA isoform expression constructs in conjunction with promoter luciferase constructs for each viral ORF. Viral ORFs are grouped into six categories based on the fold change over the expression of empty vector and the absence of RTA protein; these categories are >250-fold (red), >100-fold (orange), >25-fold (yellow), >10-fold (green), <10-fold (blue), and <2-fold (purple). ORFs are shown in the order from most transactivated by isoform 1 to least transactivated by isoform 1. There are five columns, with the first column depicting the viral ORF promoter, and the next four columns depicting the expression of isoforms 1, 2, 3, and 4. All experiments were performed in triplicate, and the results are shown as an average of these experiments.
FIG 7
FIG 7
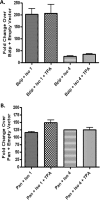
Promoter activity of K-bZIP and PAN when transfected in the presence of RTA isoform 1 or 4, as well as the potential expression of other viral proteins. (A) 293TΔ50BAC cells, containing all other viral proteins but RTA, were transfected with 1.25 μg of K-bZIP pGL4.10[luc] luciferase reporter constructs in conjunction with 1.25 μg of pCMV-Flag2B-Iso1 or pCMV-Flag2B-Iso4. The cells were left either untreated or stimulated with TPA and, at 48 h after transfection, luciferase assays were performed. (B) 293TΔ50BAC cells were transfected with 1.25 μg of PAN pGL4.10[luc] luciferase reporter constructs in conjunction with 1.25 μg of pCMV-Flag2B-Iso1 or pCMV-Flag2B-Iso4. These cells were also left either untreated or stimulated with TPA and, at 48 h after transfection, luciferase assays were performed. Data are presented as the fold change versus the reporter construct plus pCMV-Flag2B-Empty Vector. The data represent triplicates of at least three independent transfections.
FIG 8
FIG 8
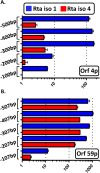
RTA isoforms have the potential to share a RRE binding site. (A and B) Reporter constructs were generated for both the Orf4 and the Orf59 KSHV promoters. We generated 100-bp deletions starting in the context of 507 bp (Orf59) and 500 bp (Orf4) and cloned them into the pGL4.10[luc] luciferase reporter construct. 293T cells were transfected with the reporter constructs in conjunction with the expression constructs pCMV-Flag2B-Iso1 or pCMV-Flag2B-Iso4. At 48 h posttransfection, luciferase assays were performed. Data are plotted as fold changes versus empty vector on a log scale. Experiments were performed in triplicate, and graphs depict the average.
FIG 9
FIG 9
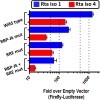
RTA isoforms can interact with cellular transcription factors in a synergistic manner. Reporter constructs were generated for the Orf57 KSHV promoter. Four constructs were generated: a full-length Orf57 KSHV promoter, an RTA responsive element (RRE) deletion in the context of the Orf57 KSHV promoter, an RBP-Jk deletion in the context of the Orf57 KSHV promoter, and an RRE plus RBP-Jk deletion in the context of the Orf57 KSHV promoter. All constructs were cloned into the pGL4.10[luc] luciferase reporter and transfected in conjunction with pCMV-Flag2B-Iso1 or pCMV-Flag2B-Iso4 into 293T cells. At 48 h posttransfection, luciferase assays were performed. Data are presented as the fold difference versus the expression construct plus the pCMV-Flag2B-Empty Vector. The data represent triplicates of at least three independent experiments.
FIG 10
FIG 10
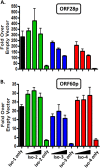
Characterization of RTA isoform 1 transactivation of target KSHV promoters in the presence of the other RTA isoforms. We analyzed RTA isoform 1 transactivation of the Orf28 promoter (A) and the Orf60 promoter (B) in the absence or presence of increasing levels of different RTA isoforms. 293T cells were transfected with a steady dose of both isoform 1 RTA and reporter construct. As indicated, increasing doses of isoform 2 (green), isoform 3 (blue), and isoform 4 (red) were cotransfected with isoform 1, and the transactivation potential of isoform 1 was determined. The single transactivation potential of isoforms 1, 2, 3, and 4 was also determined as a control. Data are plotted in triplicate, and graphs represent the average fold change versus the empty vector control.
FIG 11
FIG 11
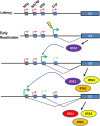
General model showing how transcriptional interference mediated by upstream Orf50 transcription initiation, combined with the expression of different RTA isoforms, may modulate the cascade of KSHV lytic gene expression.

Similar articles

Cited by

References

    1. Kedes DH, Operskalski E, Busch M, Kohn R, Flood J, Ganem D. 1996. The seroepidemiology of human herpesvirus 8 (Kaposi's sarcoma-associated herpesvirus): distribution of infection in KS risk groups and evidence for sexual transmission. Nat Med 2:918–924. doi:10.1038/nm0896-918. - DOI - PubMed
    1. Lennette ET, Blackbourn DJ, Levy JA. 1996. Antibodies to human herpesvirus type 8 in the general population and in Kaposi's sarcoma patients. Lancet 348:858–861. doi:10.1016/S0140-6736(96)03240-0. - DOI - PubMed
    1. Rickinson AB. 1996. Changing seroepidemiology of HHV-8. Lancet 348:1110–1111. doi:10.1016/S0140-6736(05)65265-8. - DOI - PubMed
    1. Rohner E, Wyss N, Trelle S, Mbulaiteye SM, Egger M, Novak U, Zwahlen M, Bohlius J. 2014. HHV-8 seroprevalence: a global view. Syst Rev 3:11. doi:10.1186/2046-4053-3-11. - DOI - PMC - PubMed
    1. Cesarman E. 2011. Gammaherpesvirus and lymphoproliferative disorders in immunocompromised patients. Cancer Lett 305:163–174. doi:10.1016/j.canlet.2011.03.003. - DOI - PMC - PubMed

MeSH terms