. 2016 Dec 19;37(1):e00454-16.
doi: 10.1128/MCB.00454-16. Print 2017 Jan 1.

Beta Interferon Production Is Regulated by p38 Mitogen-Activated Protein Kinase in Macrophages via both MSK1/2- and Tristetraprolin-Dependent Pathways

Affiliations

Beta Interferon Production Is Regulated by p38 Mitogen-Activated Protein Kinase in Macrophages via both MSK1/2- and Tristetraprolin-Dependent Pathways

Victoria A McGuire et al. Mol Cell Biol. .

Abstract

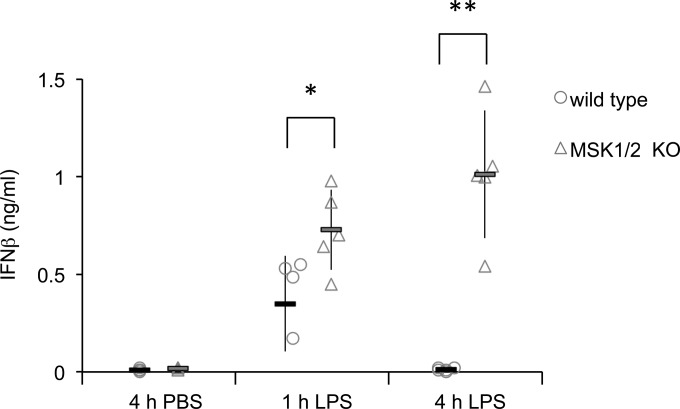
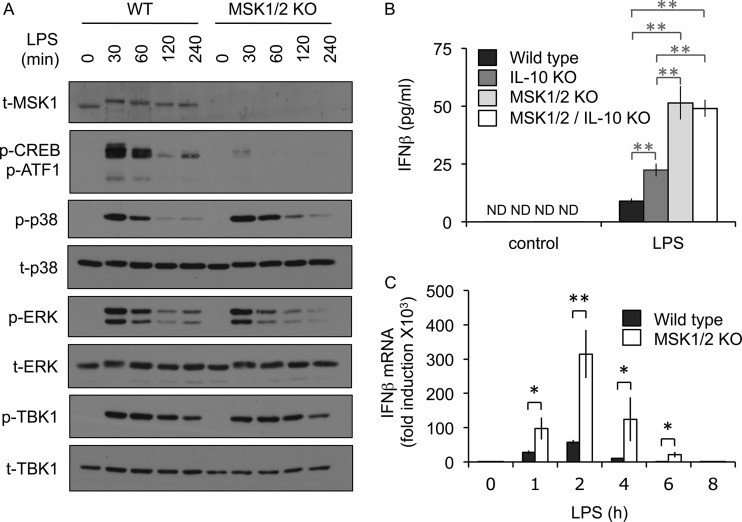
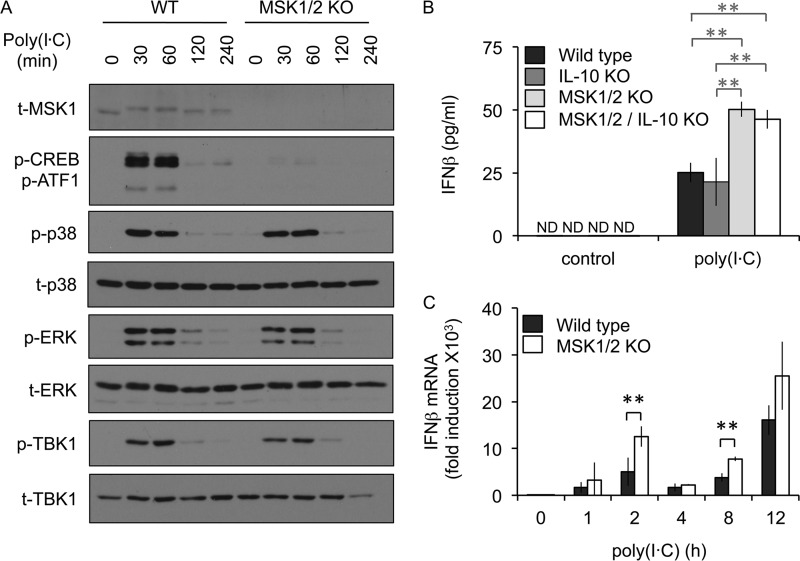
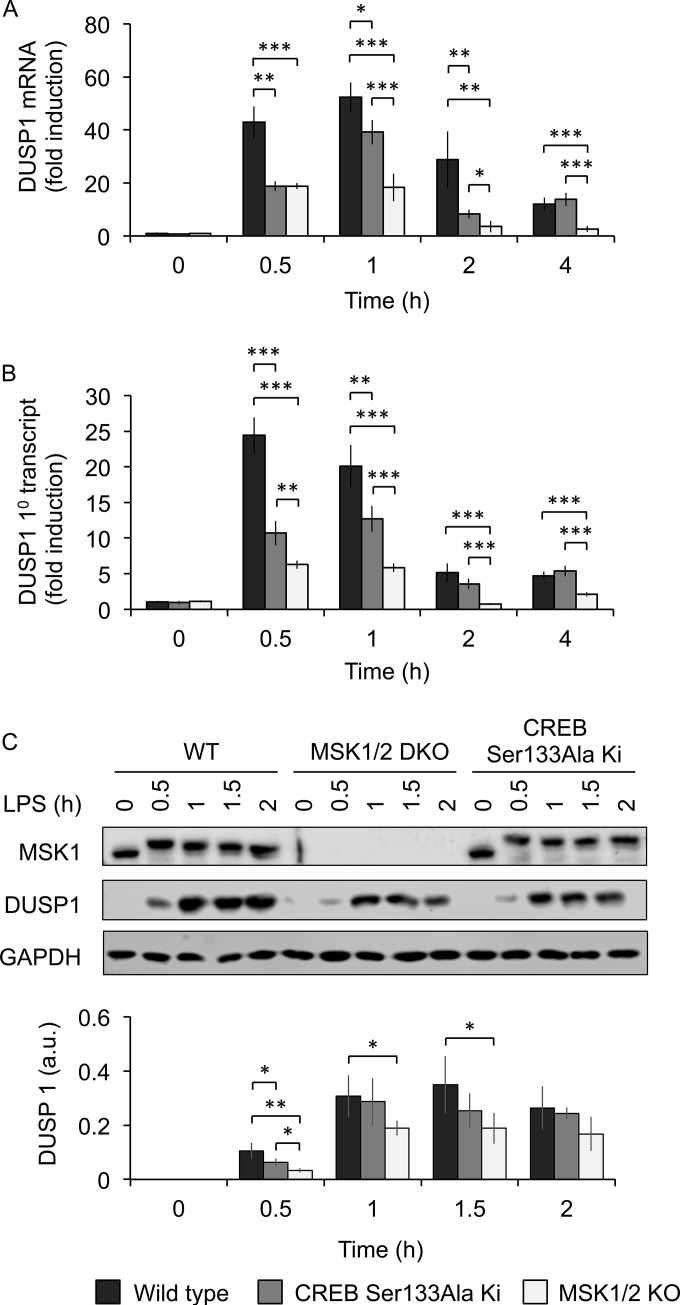
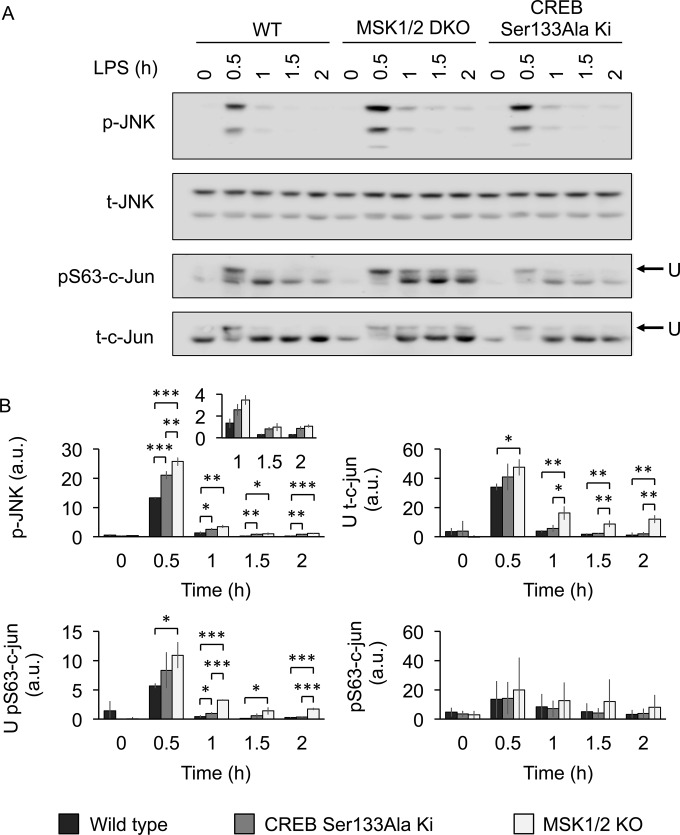
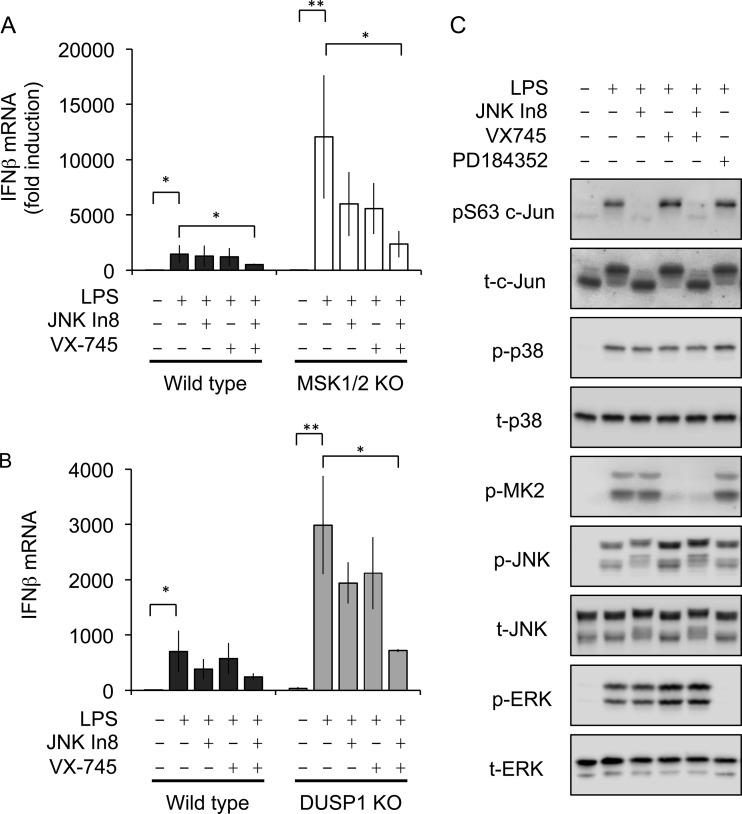
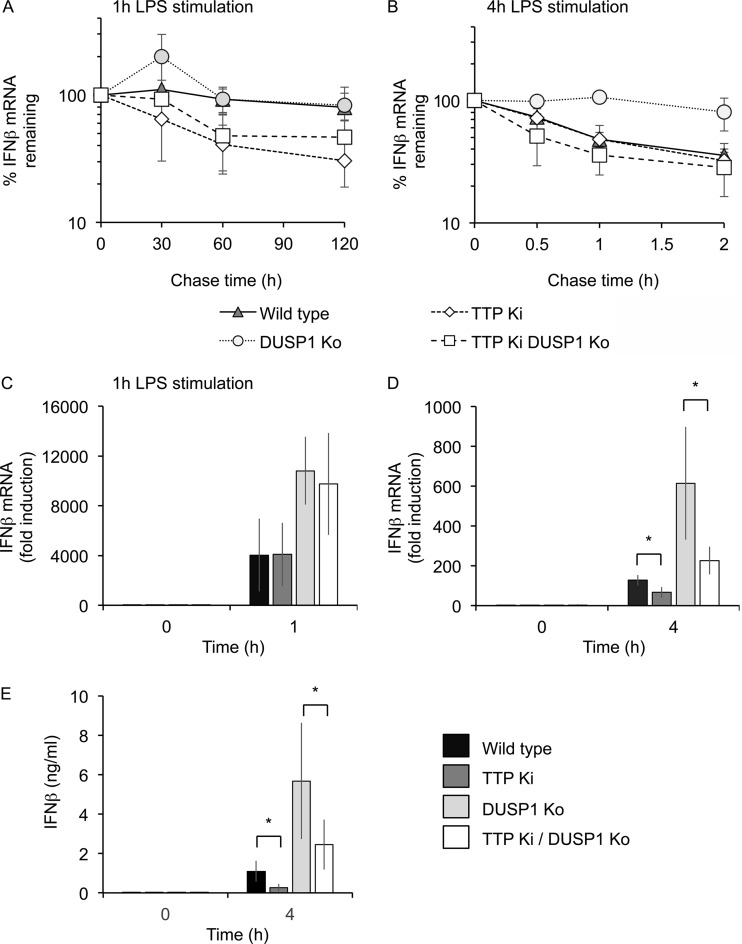
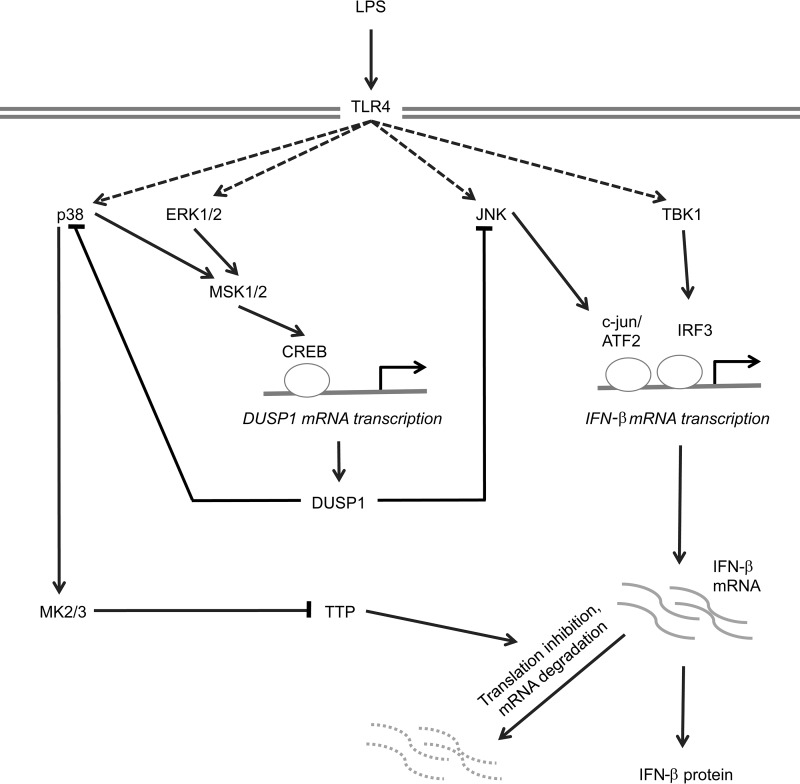
Autocrine or paracrine signaling by beta interferon (IFN-β) is essential for many of the responses of macrophages to pathogen-associated molecular patterns. This feedback loop contributes to pathological responses to infectious agents and is therefore tightly regulated. We demonstrate here that macrophage expression of IFN-β is negatively regulated by mitogen- and stress-activated kinases 1 and 2 (MSK1/2). Lipopolysaccharide (LPS)-induced expression of IFN-β was elevated in both MSK1/2 knockout mice and macrophages. Although MSK1 and -2 promote the expression of the anti-inflammatory cytokine interleukin 10, it did not strongly contribute to the ability of MSKs to regulate IFN-β expression. Instead, MSK1 and -2 inhibit IFN-β expression via the induction of dual-specificity phosphatase 1 (DUSP1), which dephosphorylates and inactivates the mitogen-activated protein kinases p38 and Jun N-terminal protein kinase (JNK). Prolonged LPS-induced activation of p38 and JNK, phosphorylation of downstream transcription factors, and overexpression of IFN-β mRNA and protein were similar in MSK1/2 and DUSP1 knockout macrophages. Two distinct mechanisms were implicated in the overexpression of IFN-β: first, JNK-mediated activation of c-jun, which binds to the IFN-β promoter, and second, p38-mediated inactivation of the mRNA-destabilizing factor tristetraprolin, which we show is able to target the IFN-β mRNA.

Keywords: CREB; DUSP1; MSK1; MSK2; TTP; beta interferon; p38 kinases.


Figures

FIG 1
FIG 1
MSK1/2 regulate LPS-induced IFN-β production in vivo. Wild-type or MSK1/2 knockout mice were given an intraperitoneal injection of 1.8 mg/kg LPS in PBS or a control injection of PBS. Sera were collected at 1 or 4 h postinjection, and IFN-β levels were measured by ELISA. The results for individual mice are shown by symbols, while averages are shown by bars. The error bars represent the standard deviations of 4 or 5 mice per condition. KO, knockout. *, P < 0.05; **, P < 0.01 (two-tailed Student t test).
FIG 2
FIG 2
MSKs inhibit IFN-β production downstream of TLR4. (A) Wild-type (WT) or MSK1/2 knockout BMDMs were stimulated with 100 ng/ml LPS for the indicated times. The cells were then lysed, and the levels of total MSK1 (t-MSK1), phospho-CREB (p-CREB)/p-ATF1, phospho- and total p38, phospho- and total ERK1/2, and phospho- and total TBK1 were determined by immunoblotting. (B) BMDMs were prepared from wild-type, IL-10 knockout, MSK1/2 double-knockout, or MSK1/2 IL-10 triple-knockout animals. The cells were stimulated with 100 ng/ml LPS for 8 h, and the levels of IFN-β secreted into the medium were determined by ELISA. The error bars represent the standard deviations of independent cultures from 3 mice per genotype. ND, not detected. (C) Wild-type or MSK1/2 knockout BMDMs were stimulated with 100 ng/ml LPS for the indicated times, and IFN-β mRNA levels relative to the wild-type unstimulated cells were determined by qPCR. The error bars represent the standard deviations of independent cultures from 4 mice per genotype. *, P < 0.05; **, P < 0.01 (two-tailed Student t test).
FIG 3
FIG 3
MSKs inhibit IFN-β production downstream of TLR3. (A) Wild-type or MSK1/2 knockout BMDMs were stimulated with 10 μg/ml poly(I·C) for the indicated times. The cells were then lysed, and the levels of total MSK1, phospho-CREB/ATF1, phospho- and total p38, phospho- and total ERK1/2, and phospho- and total TBK1 were determined by immunoblotting. (B) BMDMs were prepared from wild-type, IL-10 knockout, MSK1/2 double-knockout, or MSK1/2 IL-10 triple-knockout animals. The cells were stimulated with 10 μg/ml poly(I·C) for 8 h, and the levels of IFN-β secreted into the medium were determined by ELISA. The error bars represent the standard deviations of independent cultures from 3 mice per genotype; ND, not detected. (C) Wild-type or MSK1/2 knockout BMDMs were stimulated with 10 μg/ml poly(I·C) for the indicated times, and IFN-β mRNA levels relative to the wild-type unstimulated cells were determined by qPCR. The error bars represent the standard deviations of independent cultures from 4 mice per genotype. **, P < 0.01 (two-tailed Student t test).
FIG 4
FIG 4
MSK-dependent effects on IFN-β mRNA induction are mediated through CREB. (A) Wild-type or MSK1/2 knockout BMDMs were stimulated with 100 ng/ml LPS for 2 h, and then 1 μg/ml actinomycin D was added. At the indicated times after actinomycin D addition, the cells were lysed, and TNF and IFN-β mRNA levels were determined by qPCR. The results are expressed as the percent mRNA level relative to the zero time point and were normalized against the average of the 18S and GAPDH RNA levels. The error bars represent the standard deviations of 4 independent cultures per genotype. For IFN-β, *, P < 0.05 (two-tailed Student t test) for comparisons of wild type and MSK1/2 knockout. For TNF, +, P < 0.05, and ++, P < 0.01 between wild type and knockout. (B) Wild-type, MSK1/2 knockout, or CREB Ser133Ala knock-in BMDMs were stimulated with 100 ng/ml LPS for the indicated times, and IFN-β mRNA levels were determined by qPCR. (C) Wild-type or CREB Ser133Ala knock-in BMDMs were stimulated with 100 ng/ml LPS for 8 h, and the levels of IFN-β secreted into the medium were determined by ELISA. (B and C) The error bars represent the standard deviations of independent cultures from 4 mice per genotype. *, P < 0.05; **, P < 0.01; ***, P < 0.001 (two-tailed Student t test).
FIG 5
FIG 5
MSK regulates DUSP1 induction. Wild-type, MSK1/2 knockout, or CREB Ser133Ala knock-in BMDMs were stimulated for the indicated times with 100 ng/ml LPS. (A and B) The cells were then lysed, and the levels of DUSP1 mRNA (A) or DUSP1 primary transcript (B) were determined by qPCR. (C) Alternatively, cells were stimulated for the indicated times and lysed, and the levels of total MSK1, DUSP1, and GAPDH were determined by immunoblotting. The signals for DUSP1 from the immunoblots were quantified and corrected for the average of GAPDH and total JNK levels (a representative blot for JNK is shown in Fig. 6). The graphs show means, and the error bars represent the standard deviations of independent cultures from 4 (A and B) or 3 (C) mice per genotype. *, P < 0.05; **, P < 0.01; ***, P < 0.001 (two-tailed Student t test).
FIG 6
FIG 6
Regulation of JNK and c-jun phosphorylation by MSKs downstream of LPS. (A) Wild-type, MSK1/2 knockout, or CREB Ser133Ala knock-in BMDMs were stimulated with 100 ng/ml LPS for the indicated times. The cells were then lysed, and the levels of total and phosphoproteins shown were determined by immunoblotting. The blots are a representative example of independent cultures from 3 mice per genotype. (B) Signals from panel A were quantified, and the graphs show the levels of p-JNK corrected for total JNK, the upper c-jun band (U) corrected for the total c-jun signal, pS63 c-jun levels corrected for total c-jun, and the upper band in the pS63 blots corrected for total c-jun. The error bars represent the standard deviations of 3 independent cultures per genotype. a.u., arbitrary units. *, P < 0.05; **, P < 0.01; ***, P < 0.001 (two-tailed Student t test).
FIG 7
FIG 7
Knockout of DUSP1 increases IFN-β mRNA induction in response to LPS. (A) Wild-type or DUSP1 knockout BMDMs were stimulated with 100 ng/ml LPS for the indicated times. IFN-β mRNA levels were then determined by qPCR. The error bars represent the standard deviations of independent cultures from 12 mice per genotype. (B) Wild-type or DUSP1 knockout BMDMs were stimulated with 100 ng/ml LPS for the indicated times. IFN-β secretion levels were then determined by a Luminex-based assay as described in Materials and Methods. The error bars represent the standard deviations of independent cultures from 3 mice per genotype. (C) Wild-type or DUSP1 knockout BMDMs were stimulated with 100 ng/ml LPS for the indicated times and analyzed by immunoblotting for the total and phosphoproteins shown. (D) Phosphorylated bands in panel C were quantified, and the signal was corrected for protein loading based on the total-protein blots. *, P < 0.05; **, P < 0.01; ***, P < 0.001 (two-tailed Student t test).
FIG 8
FIG 8
Effects of MAPK pathway inhibitors on c-Jun phosphorylation and IFN-β mRNA induction. (A) Wild-type or MSK1/2 knockout BMDMs were preincubated with1 μM VX745 for 1 h or with 3 μM JNK-In-8 for 3 h as indicated. The cells were then stimulated with 100 ng/ml LPS for 2 h, and IFN-β mRNA levels were determined by qPCR. The error bars represent the standard deviations of independent cultures from 4 mice per genotype. *, P < 0.05; **, P < 0.01 (two-tailed Student t test). (B) Wild-type or DUSP1 knockout BMDMs were preincubated with 1 μM VX745 for 1 h or 3 μM JNK-In-8 for 3 h as indicated. The cells were then stimulated with 100 ng/ml LPS for 2 h, and IFN-β mRNA levels were determined by qPCR. The error bars represent the standard deviations of independent cultures from 3 mice per genotype. P values between the wild type and DUSP1 knockout: *, P < 0.05; **, P < 0.01 (two-tailed Student t test). (C) Wild-type BMDMs were preincubated with 2 μM PD184352 or 1 μM VX745 for 1 h or 3 μM JNK-In-8 for 3 h as shown. The cells were then stimulated with 100 ng/ml LPS for 30 min, and the levels of the indicated total and phosphoproteins were determined by immunoblotting.
FIG 9
FIG 9
TTP regulates IFN-β production in response to LPS. (A and B) BMDMs were isolated from wild-type, DUSP1 knockout, TTP knock-in, or DUSP1/TTP double-mutant mice. The cells were stimulated with 100 ng/ml LPS for either 1 h (A) or 4 h (B), and then 50 μM 5,6-dichloro-1β-1-ribofuranosylbenzimidazole (DRB), and 5 μg/ml actinomycin D was added. IFN-β mRNA levels were then determined at the indicated times after DRB/actinomycin D addition. The levels were calculated relative to the LPS-stimulated cells prior to DRB/actinomycin D addition. The results represent the means and standard deviations of independent cultures from 3 mice per genotype. (C and D) BMDMs were isolated from wild-type, DUSP1 knockout, TTP knock-in, or DUSP1/TTP double-mutant mice. The cells were stimulated with 100 ng/ml LPS, and the levels of IFN-β mRNA were determined at 0, 1, and 4 h. Due to the different fold inductions, the results are shown on separate graphs for 1 h (C) and 4 h (D). The results represent individual cultures from 3 wild-type mice or 4 mice for other genotypes. The error bars represent standard deviations. (E) As for panel D, but the levels of IFN-β protein secreted into the medium were determined by a Luminex-based assay. The results represent the means and standard deviations of independent cultures from 4 mice per genotype. (C to E) For comparisons of TTP knock-in to wild type or DUSP1/TTP double mutants to DUSP1 knockout, *, P < 0.05 (two-tailed Student t test).
FIG 10
FIG 10
Proposed model of IFN-β transcriptional regulation downstream of MSKs. TLR4 agonists, such as LPS, stimulate the activation of the JNK/c-jun/ATF2 and Tbk1/IRF3 pathways to induce the transcriptional activation of the IFN-β promoter. TLR4 also activates the ERK1/2 and p38 MAPK pathways, resulting in the activation of MSK1 and -2 and the phosphorylation of the MSK substrate, CREB. CREB then helps induce transcription of the phosphatase DUSP1, upregulating DUSP1 protein levels. DUSP1 is then able to dephosphorylate p38 and JNK, resulting in reduced activation of these pathways. Loss of this MSK/CREB/DUSP1 pathway results in prolonged activation of JNK, c-jun, and ATF2, thus helping to drive IFN-β transcription. Prolonged activation of p38 also activates MK2, which phosphorylates TTP, thus preventing TTP from promoting IFN-β mRNA degradation.

Similar articles

Cited by

References

    1. Takeuchi O, Akira S. 2010. Pattern recognition receptors and inflammation. Cell 140:805–820. doi:10.1016/j.cell.2010.01.022. - DOI - PubMed
    1. O'Neill LA. 2008. When signaling pathways collide: positive and negative regulation of Toll-like receptor signal transduction. Immunity 29:12–20. doi:10.1016/j.immuni.2008.06.004. - DOI - PubMed
    1. Medzhitov R, Horng T. 2009. Transcriptional control of the inflammatory response. Nat Rev Immunol 9:692–703. doi:10.1038/nri2634. - DOI - PubMed
    1. McCoy CE, O'Neill LA. 2008. The role of Toll-like receptors in macrophages. Front Biosci 13:62–70. doi:10.2741/2660. - DOI - PubMed
    1. Arthur JS, Ley SC. 2013. Mitogen-activated protein kinases in innate immunity. Nat Rev Immunol 13:679–692. doi:10.1038/nri3495. - DOI - PubMed

Publication types

MeSH terms