Senescent intimal foam cells are deleterious at all stages of atherosclerosis
- PMID: 27789842
- PMCID: PMC5112585
- DOI: 10.1126/science.aaf6659
Senescent intimal foam cells are deleterious at all stages of atherosclerosis
Abstract
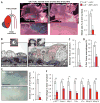
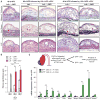
Advanced atherosclerotic lesions contain senescent cells, but the role of these cells in atherogenesis remains unclear. Using transgenic and pharmacological approaches to eliminate senescent cells in atherosclerosis-prone low-density lipoprotein receptor-deficient (Ldlr-/-) mice, we show that these cells are detrimental throughout disease pathogenesis. We find that foamy macrophages with senescence markers accumulate in the subendothelial space at the onset of atherosclerosis, where they drive pathology by increasing expression of key atherogenic and inflammatory cytokines and chemokines. In advanced lesions, senescent cells promote features of plaque instability, including elastic fiber degradation and fibrous cap thinning, by heightening metalloprotease production. Together, these results demonstrate that senescent cells are key drivers of atheroma formation and maturation and suggest that selective clearance of these cells by senolytic agents holds promise for the treatment of atherosclerosis.
Copyright © 2016, American Association for the Advancement of Science.
Figures


Comment in
-
Basic research: Killing the old: cell senescence in atherosclerosis.Nat Rev Cardiol. 2016 Dec 12;14(1):8-9. doi: 10.1038/nrcardio.2016.195. Nat Rev Cardiol. 2016. PMID: 27941859 No abstract available.
-
Assisted Living in the Atheroma: Elderly Macrophages Promote Plaques.Cell Metab. 2016 Dec 13;24(6):779-781. doi: 10.1016/j.cmet.2016.11.013. Cell Metab. 2016. PMID: 27974178
Similar articles
-
Resident intimal dendritic cells accumulate lipid and contribute to the initiation of atherosclerosis.Circ Res. 2010 Feb 5;106(2):383-90. doi: 10.1161/CIRCRESAHA.109.210781. Epub 2009 Nov 5. Circ Res. 2010. PMID: 19893012
-
Dihydromyricetin ameliorates atherosclerosis in LDL receptor deficient mice.Atherosclerosis. 2017 Jul;262:39-50. doi: 10.1016/j.atherosclerosis.2017.05.003. Epub 2017 May 5. Atherosclerosis. 2017. PMID: 28500865
-
Insulin-Like Growth Factor-1 Receptor Deficiency in Macrophages Accelerates Atherosclerosis and Induces an Unstable Plaque Phenotype in Apolipoprotein E-Deficient Mice.Circulation. 2016 Jun 7;133(23):2263-78. doi: 10.1161/CIRCULATIONAHA.116.021805. Epub 2016 May 6. Circulation. 2016. PMID: 27154724 Free PMC article.
-
Smooth muscle cell phenotypic switch: implications for foam cell formation.Curr Opin Lipidol. 2014 Oct;25(5):374-9. doi: 10.1097/MOL.0000000000000113. Curr Opin Lipidol. 2014. PMID: 25110900 Review.
-
Cytokines, macrophage lipid metabolism and foam cells: implications for cardiovascular disease therapy.Prog Lipid Res. 2011 Oct;50(4):331-47. doi: 10.1016/j.plipres.2011.04.002. Epub 2011 May 13. Prog Lipid Res. 2011. PMID: 21601592 Review.
Cited by
-
Therapeutic Potential of Senolytics in Cardiovascular Disease.Cardiovasc Drugs Ther. 2022 Feb;36(1):187-196. doi: 10.1007/s10557-020-07075-w. Epub 2020 Sep 26. Cardiovasc Drugs Ther. 2022. PMID: 32979174 Free PMC article. Review.
-
Mesenchymal stem cell-derived extracellular vesicles reduce senescence and extend health span in mouse models of aging.Aging Cell. 2021 Apr;20(4):e13337. doi: 10.1111/acel.13337. Epub 2021 Mar 16. Aging Cell. 2021. PMID: 33728821 Free PMC article.
-
Cellular senescence contributes to radiation-induced hyposalivation by affecting the stem/progenitor cell niche.Cell Death Dis. 2020 Oct 14;11(10):854. doi: 10.1038/s41419-020-03074-9. Cell Death Dis. 2020. PMID: 33056980 Free PMC article.
-
Lipopolysaccharides and Cellular Senescence: Involvement in Atherosclerosis.Int J Mol Sci. 2022 Sep 22;23(19):11148. doi: 10.3390/ijms231911148. Int J Mol Sci. 2022. PMID: 36232471 Free PMC article. Review.
-
The senescent marker p16INK4a enhances macrophage foam cells formation.Mol Biol Rep. 2024 Sep 27;51(1):1021. doi: 10.1007/s11033-024-09946-z. Mol Biol Rep. 2024. PMID: 39331194
References
Publication types
MeSH terms
Substances
Grants and funding
LinkOut - more resources
Full Text Sources
Other Literature Sources
Medical
Molecular Biology Databases
Miscellaneous

