. 2017 Feb 1:146:1003-1015.
doi: 10.1016/j.neuroimage.2016.10.036. Epub 2016 Oct 24.

Reward magnitude tracking by neural populations in ventral striatum

Affiliations

Reward magnitude tracking by neural populations in ventral striatum

Ana M Fiallos et al. Neuroimage. .

Abstract

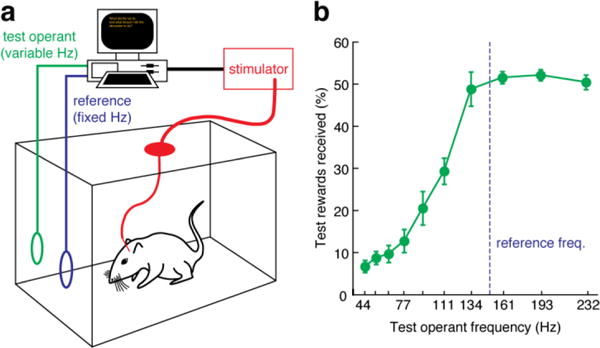
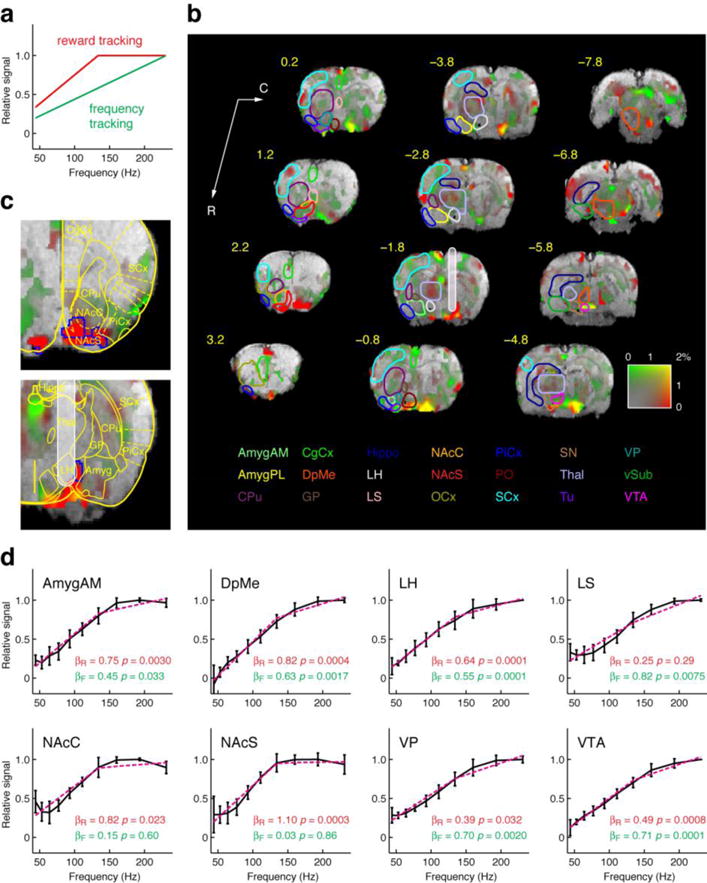
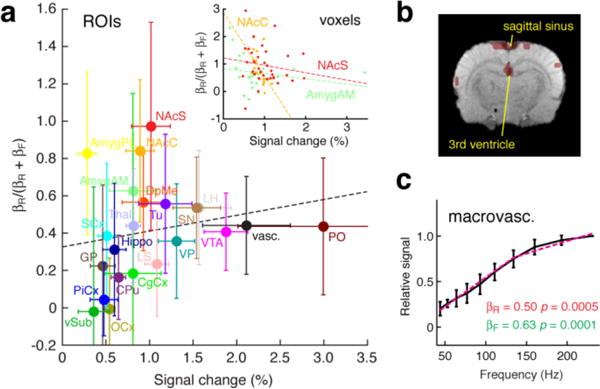
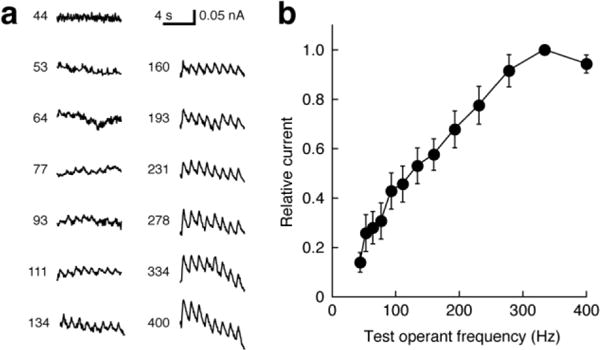
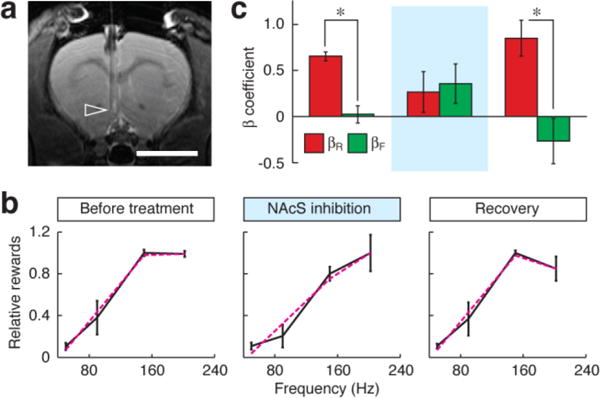
Evaluation of the magnitudes of intrinsically rewarding stimuli is essential for assigning value and guiding behavior. By combining parametric manipulation of a primary reward, medial forebrain bundle (MFB) microstimulation, with functional magnetic imaging (fMRI) in rodents, we delineated a broad network of structures activated by behaviorally characterized levels of rewarding stimulation. Correlation of psychometric behavioral measurements with fMRI response magnitudes revealed regions whose activity corresponded closely to the subjective magnitude of rewards. The largest and most reliable focus of reward magnitude tracking was observed in the shell region of the nucleus accumbens (NAc). Although the nonlinear nature of neurovascular coupling complicates interpretation of fMRI findings in precise neurophysiological terms, reward magnitude tracking was not observed in vascular compartments and could not be explained by saturation of region-specific hemodynamic responses. In addition, local pharmacological inactivation of NAc changed the profile of animals' responses to rewards of different magnitudes without altering mean reward response rates, further supporting a hypothesis that neural population activity in this region contributes to assessment of reward magnitudes.

Keywords: BOLD fMRI; Microstimulation; Nucleus accumbens; Reward.


Figures

Fig. 1
Fig. 1. BOLD fMRI responses to MFB reward stimulation. (a)
Representative blood oxygenation level dependent (BOLD) fMRI response to electrical stimulation of the medial forebrain bundle (MFB), averaged over all voxels in the lateral hypothalamus (LH) ipsilateral to the stimulation electrode in a single rat. Ten stimulation frequencies (green labels, in Hz) were presented in pseudo-random order and the stimulation sequence was repeated three times over the duration of the scan session. Each green rectangle corresponds to one stimulation block. (b) Average LH response to a 40 s block of eight MFB stimulation trains delivered at 231 Hz, showing peaks in the response profile following each 1 s train (vertical red lines). The gray shading indicates standard error of the mean (s.e.m.) over three stimulus presentations in a single animal, at time points with respect to the stimulus onset at t = 0 seconds. (c) Map of average fMRI responses to MFB stimulation over stimulation frequencies from 44–231 Hz in a group of ten animals. Data are displayed as an array of 1 mm slices from rostral to caudal, beginning with the most rostral slice at the lower left (coordinates with respect to bregma displayed to the top left of each slice, in yellow). Background images are T2-weighted anatomical images. Color overlays in red-yellow depict the BOLD amplitude as % signal change, according to the color bar (lower right). Colored outlines depict boundaries of 21 regions of interest (ROIs); only ROIs contralateral to the electrode (white shaded bar, −1.8 from bregma) are drawn. Color-coded ROI labels at bottom correspond to the ROI outlines. Data were thresholded for statistically significant activation with partial Bonferroni correction (p ≤ 0.0001). (d) ROI-averaged mean BOLD signal modulations elicited by 44–231 Hz MFB stimulation, arranged from maximum to minimum amplitude for ROIs ipsilateral to the stimulation electrode. Contralateral response amplitudes are shown in the inset. Error bars denote s.e.m. over animals (n = 10). Signal change calculations included all voxels in each ROI, excepting regions of signal drop out due to implants and areas dominated by macrovascular responses, which were excluded from ROI averages.
Fig. 2
Fig. 2. Reward titration analysis and behavioral results
(a) Diagram of the apparatus for measuring reward titration curves. Rats implanted with an MFB stimulation electrode and connected to a constant current stimulator (red) were placed into an operant chamber with two nose poke holes. One hole was associated with a stimulation reward delivered at a fixed reference frequency (blue) while the second hole was associated with a test stimulation frequency that varied from trial to trial (green). Timing of the trials and stimuli is automated by custom software running on a computer. (b) The percentage of test operant actions is plotted as a function of test frequency for a range of frequencies, offered in the two-choice test against a reference frequency of 150 Hz. Stimulation frequencies below 134 Hz are increasingly rewarding and are chosen with increasing probability as they approach the reference. Frequencies above 134 Hz are virtually indistinguishable from 150 Hz stimulation, giving rise to the flat response profile at high frequency that characterizes the reward saturation phenomenon. The graph shows mean and s.e.m. for 8 rats.
Fig. 3
Fig. 3. Brain region-specific tracking of psychometric reward magnitude
(a) Frequency tracking (green) and reward tracking (red) models used for regression analysis of stimulation frequency-dependent BOLD response amplitudes. The frequency tracking model predicts responses linearly proportional to the stimulation frequency, whereas the reward tracking model idealizes the saturation effect seen in the behavioral reward titration analysis, with an asymptotic saturation frequency equal to the experimentally observed value in Fig. 2b. (b) Voxel-level characterization of frequency vs. reward tracking by BOLD signal amplitudes in a group analysis of 8 rats. Amplitudes as a function of frequency were analyzed using a GLM incorporating frequency and reward tracking regressors from panel A. The amount of fMRI signal change (%) ascribed to frequency and reward tracking models is color coded such that pure frequency tracking appears green, pure reward tracking appears red, and an equal mixture appears yellow (color code shown bottom right). Maps are overlayed on a T2-weighted anatomical scan, and ROIs and labels are shown as in Fig. 1c. (c) Close up of the two most pronounced foci of reward tracking near nucleus accumbens shell (NAcS, top) and adjacent to the amygdala (Amyg) near the stimulation electrode site (bottom). A standard histological map (Paxinos and Watson, 1998) is superimposed over the data. Voxels that showed statistically significantly (t-test p < 0.05) greater reward tracking than frequency tracking are outlined in blue; NAcS contains the largest cluster of significantly reward tracking voxels. (d) Plots of normalized mean BOLD amplitudes vs. stimulation frequency for several ROIs (mean ± s.e.m. shown for each in black, n = 8). Relative contributions of the two models to the BOLD signal from each ROI were expressed as coefficients βR and βF for reward and frequency tracking regressors, respectively. Corresponding p values for F-tests of the significance of each regressor’s contribution are noted. Pink dotted lines indicate the best fit regression curve in each case. Among the ROIs shown, NAcS and NAcC were the only regions that showed significant contribution of the reward tracking model, but not the frequency tracking model. Corresponding βR values indicated that over 80% of the fMRI signal variation could be explained by the reward tracking model in both NAcC and NAcS.
Fig. 4
Fig. 4. Vascular contributions do not explain saturating fMRI profiles
(a) BOLD amplitudes observed at the maximal stimulation frequency (horizontal axis) were plotted vs. an index of response saturation, equal to βR/(βR + βF), where βR and βF are regression coefficients for reward and frequency tracking models (see text and Fig. 3). Mean and s.e.m. values are shown across animals (n = 8) for each ROI, and for a vascular compartment (black). Dotted line shows best linear fit to the data (R = 0.17, p = 0.47). Inset shows correspondence between BOLD amplitudes to 231 Hz stimulation and saturation index for individual voxels, with linear regression fits in three ROIs: NAcS (red; R = 0.15, p = 0.39), NAcC (orange; R = 0.55, p = 0.015), and AmygAM (light green; R = 0.21, p = 0.32). NAcC showed statistically significant anti-correlation, and other regions were uncorrelated, failing to support the hypothesis that reward tracking BOLD responses result from saturation of neurovascular coupling. (b) Representative macrovascular regions identified on the basis of hysteretic responses to MFB stimulation (see Methods). Sagittal sinus and vessels near the third ventricle shown in slice −2.8 mm from bregma. (c) Macrovascular BOLD response amplitudes as a function of MFB stimulation frequency. Regression analysis with reward tracking and frequency tracking models are shown as in Fig. 3d, with corresponding β and F-test p values noted. The frequency tracking model accounted for the majority of variance.
Fig. 5
Fig. 5. NAc dopamine signals saturate only at very high frequency
(a) Dopamine oxidation detected by fixed potential (0.8 V) amperometry during MFB stimulation in a representative animal under conditions similar to the fMRI experiments. Each trace shows responses to a series of eight pulse trains delivered with the stimulation frequency indicated. (b) Normalized average amperometric responses (n = 3) measured over a range of frequencies including those used for behavioral and MRI experiments. Saturation is observed only at frequencies of 315 ± 32 Hz (mean ± s.d.).
Fig. 6
Fig. 6. Targeted inactivation of NAcS perturbs reward titration behavior
(a) Cannulae were implanted in the medial NAcS of rats, ipsilateral to MFB stimulation electrodes; correct placement was verified by MRI at 7 T. Arrowhead denotes cannula tip in a representative animal. Scale bar = 5 mm. (b) Reward titration curves were measured using methods analogous to those of Fig. 2, but with a reference stimulation frequency of 150 Hz and four comparison frequencies of 50, 90, 150, and 202 Hz. Data were obtained from six animals that had reached stable performance on the task, and graphs represent the relative number of rewards harvested from the nosepoke hole associated with the titrated stimulation frequency the day before treatment (left), during infusion of 0.1 μL/min of 2% lidocaine into NAcS (middle), and on the day after the perturbation (right). Black curves denote measured values with error bars over six animals; dashed magenta lines are best fit from a regression model including linear and saturating components as in Fig. 3a. (c) Average regression coefficients for linear and saturating models (βL and βR, respectively) fit to individual animal reward titration curves obtained before, during, and after NAcS inactivation, showing that inactivation abolishes the saturating profile with βR > βL (p ≤ 0.005) observed both before and after lidocaine treatment.

Similar articles

Cited by

References

    1. Albertin SV, Mulder AB, Tabuchi E, Zugaro MB, Wiener SI. Lesions of the medial shell of the nucleus accumbens impair rats in finding larger rewards, but spare reward-seeking behavior. Behav Brain Res. 2000;117:173–183. - PubMed
    1. Ambroggi F, Ghazizadeh A, Nicola SM, Fields HL. Roles of nucleus accumbens core and shell in incentive-cue responding and behavioral inhibition. J Neurosci. 2011;31:6820–6830. - PMC - PubMed
    1. Britt JP, Benaliouad F, McDevitt RA, Stuber GD, Wise RA, Bonci A. Synaptic and behavioral profile of multiple glutamatergic inputs to the nucleus accumbens. Neuron. 2012;76:790–803. - PMC - PubMed
    1. Brodnik ZD, Espana RA. Dopamine uptake dynamics are preserved under isoflurane anesthesia. Neurosci Lett. 2015;606:129–134. - PMC - PubMed
    1. Buonocore MH, Gao L. Ghost artifact reduction for echo planar imaging using image phase correction. Magn Reson Med. 1997;38:89–100. - PubMed

Publication types

LinkOut - more resources