. 2016 Oct 27;8(1):114.
doi: 10.1186/s13073-016-0363-3.

Application of RNAi-induced gene expression profiles for prognostic prediction in breast cancer

Affiliations

Application of RNAi-induced gene expression profiles for prognostic prediction in breast cancer

Yue Wang et al. Genome Med. .

Abstract

Homologous recombination (HR) is the primary pathway for repairing double-strand DNA breaks implicating in the development of cancer. RNAi-based knockdowns of BRCA1 and RAD51 in this pathway have been performed to investigate the resulting transcriptomic profiles. Here we propose a computational framework to utilize these profiles to calculate a score, named RNA-Interference derived Proliferation Score (RIPS), which reflects cell proliferation ability in individual breast tumors. RIPS is predictive of breast cancer classes, prognosis, genome instability, and neoadjuvant chemosensitivity. This framework directly translates the readout of knockdown experiments into potential clinical applications and generates a robust biomarker in breast cancer.

Keywords: Cancer prognosis; Cell proliferation; Gene knockdown profiles; Genomic instability; Homologous recombination pathway; Neoadjuvant chemotherapy.


Figures
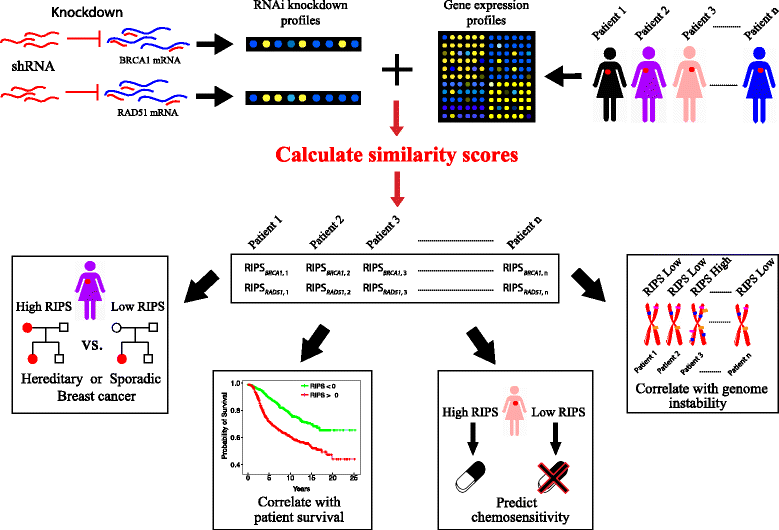
Fig. 1
Fig. 1
Overview of computational analysis in this study. Briefly, we utilize knockdown experiments of BRCA1 or RAD51 in combination with breast cancer patient gene expression data to estimate the similarity score between the knockdown profiles and tumor expression profiles. The score can be used to predict sporadic cancers from hereditary cancers, predict patient survival outcome, predict chemosensitivity, and correlate with genome instability
Fig. 2
Fig. 2
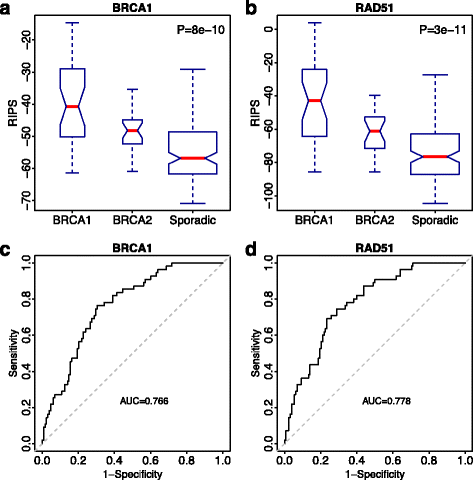
Inherited and sporadic breast cancer samples are distinguished by RIPS. a Boxplot of BRCA1-inherited, BRCA2-inherited cancers, and non-familial sporadic cancer patient RIPS scores (BRCA1 based; RIPS BRCA1). The width of each box is proportional to the sample number. The p value is a calculation of one-way analysis of variance (ANOVA). b Same as (a) but utilizing RIPS RAD51. c A ROC curve from predicting sporadic cancers from inherited cancers using only RIPS BRCA1. d Same as (c) but using RIPS RAD51
Fig. 3
Fig. 3
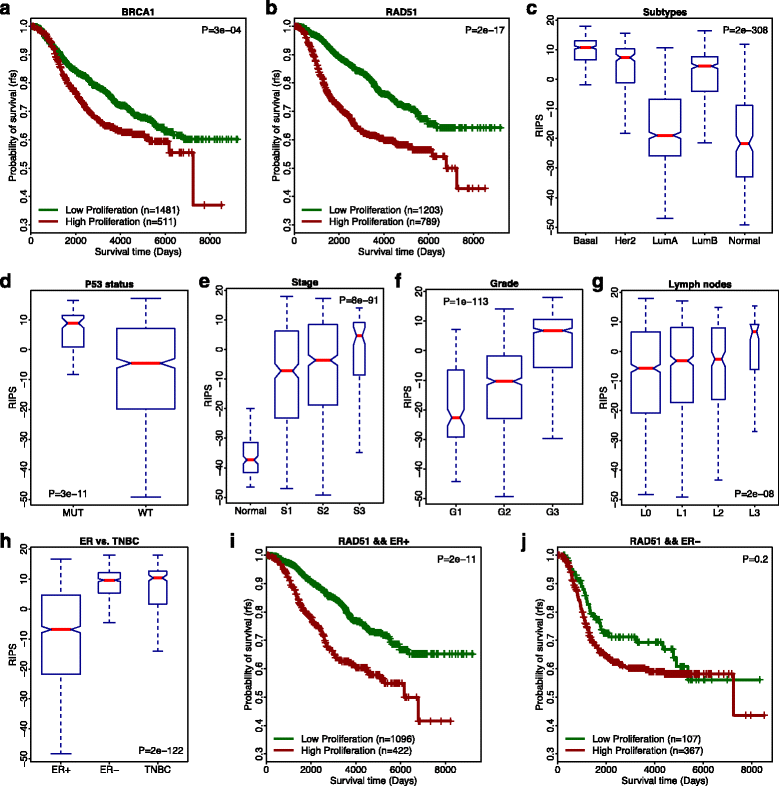
Analyses of METABRIC breast cancer patients using RIPS. a Kaplan–Meier plot using RIPS BRCA1. Patients with low cell proliferation (RIPS < 0; green curve) have a higher survival likelihood than patients with high cell proliferation (RIPS > 0; red curve). b Kaplan–Meier plot using RIPSRAD51. c Boxplot of RIPSRAD51 comparing samples across molecular subtypes. The width of each box is proportional to the sample number. The p value is a calculation of one-way analysis of variance (ANOVA). d Boxplot of RIPSRAD51 comparing p53 mutant to WT-p53 samples. e Boxplot of RIPSRAD51 comparing samples across tumor stages. f Boxplot of RIPSRAD51 comparing samples across lymph nodes status. g Boxplot of RIPSRAD51 comparing samples across tumor grades. h Boxplot of RIPSRAD51 comparing ER+, ER–, and TNBC samples. i Kaplan–Meier plot using RIPSRAD51 for only ER+ patients. j Kaplan–Meier plot using RIPSRAD51 for only ER– patients
Fig. 4
Fig. 4
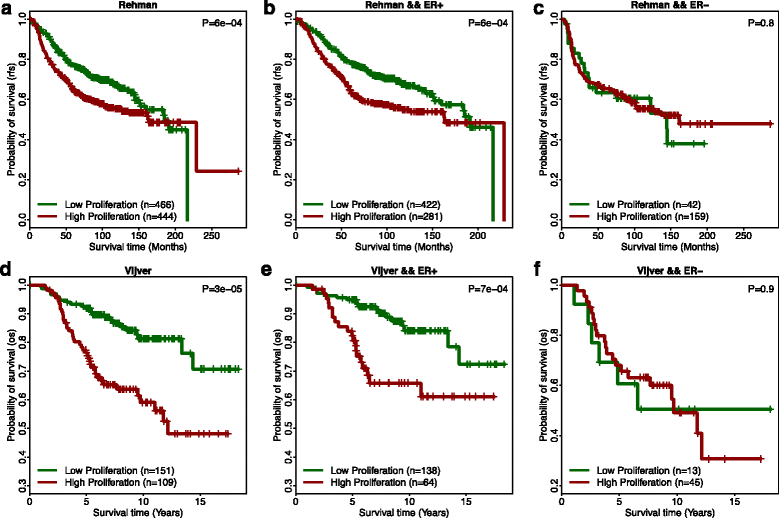
Prognosis of Ur-Rehman and Vijver breast cancer patients using RIPSRAD51. aKaplan–Meier plot of RIPSRAD51 in Ur-Rehman database. Patients with higher cell proliferation (RIPS >0, red curve) shows worse survival prognosis. bKaplan–Meier plot of RIPSRAD51 for ER+ patient samples in Ur-Rehman data. Patients with higher cell proliferation (red curve) show worse survival prognosis. cKaplan–Meier plot of RIPSRAD51 for ER– patient samples in Ur-Rehman data. dKaplan–Meier plot of RIPSRAD51 in Vijver database. Patients with higher cell proliferation (RIPS >0, red curve) shows worse survival prognosis. eKaplan–Meier plot of RIPSRAD51 for Vijver ER+ patient samples. Patients with higher cell proliferation (red curve) show worse survival prognosis. fKaplan–Meier plot of RIPSRAD51 for Vijver ER– patient samples.
Fig. 5
Fig. 5
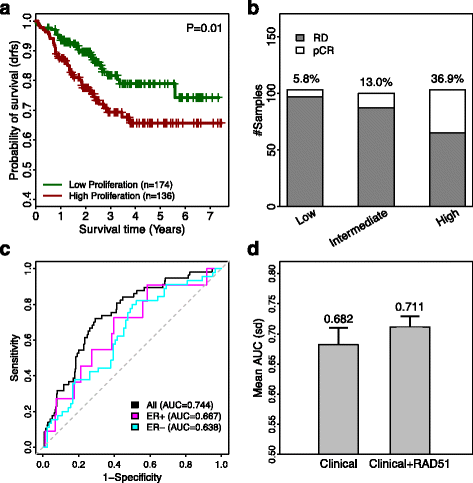
Prognosis of Hatzis discovery data using RIPSRAD51. a Kaplan–Meier plot comparing survival of high to low cell proliferation patients. Patients with low RIPS (green curve) have significantly higher survival than patients with high RIPS (red curve). b Barplot of the pCR rate within low, intermediate, and high RIPS groups comparing the number of RD patients (gray) to the number of patients achieving pCR (white). The pCR rate is given above each bar. c ROC curve calculating accuracy in classifying pCR patients. Black curve: All patients in Hatzis dataset (AUC = 0.744). Magenta curve: ER+ only Hatzis patients (AUC = 0.667). Cyan curve: ER– only Hatzis patients (AUC = 0.638). d Barplot comparing average AUCs from a random forest model either including RIPSRAD51 with clinical information or not. Mean AUC is given above each bar. Error bars represent standard deviation in the AUC distribution
Fig. 6
Fig. 6
High cell proliferation correlates with high genomic instability metrics. a Boxplot of log10 transformed mutation counts in different cell proliferation groups. Each gray spot indicates log10 transformed mutation counts. The width of each box is proportional to the sample number and the p value represents an ANOVA calculation. b Boxplot of the CND score distributions in the three groups. c Boxplot of estimated tumor ploidy distributions in the three groups
Fig. 7
Fig. 7
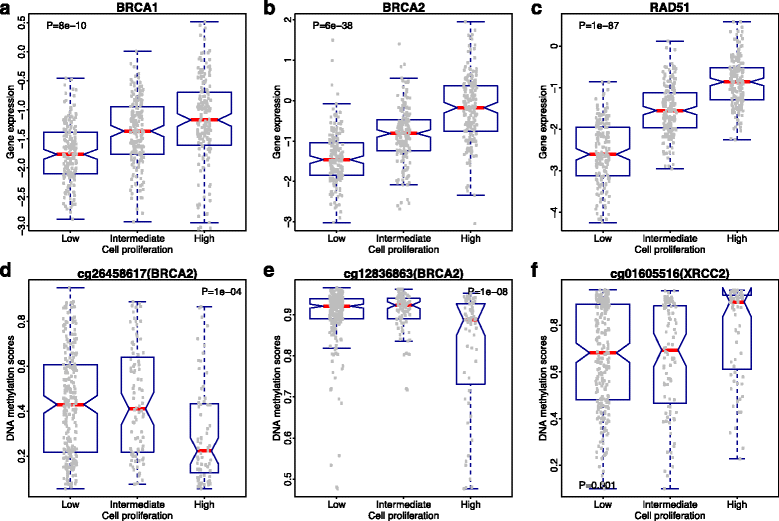
Difference of gene expression and DNA methylation in different RIPS groups. a BRCA1 expressions in different RIPS groups. Gray dots indicate the amount of BRCA1 expression for a particular sample. The width of the box is proportional to the number of samples. Reported p value is a result of ANOVA calculation. b BRCA2 expressions in different RIPS groups. c RAD51 expressions in different RIPS groups. d DNA methylation levels of cg26458617 in different RIPS groups. Gray dots indicate levels of DNA methylation of this cpg site. The width of the box is proportional to the number of samples. Reported p value is a result of ANOVA calculation. e DNA methylation levels of cg12836863 in different RIPS groups. f DNA methylation levels of cg01605516 in different RIPS groups

Similar articles

Cited by

References

    1. Li X, Heyer WD. Homologous recombination in DNA repair and DNA damage tolerance. Cell Res. 2008;18:99–113. doi: 10.1038/cr.2008.1. - DOI - PMC - PubMed
    1. Lin Z, Kong H, Nei M, Ma H. Origins and evolution of the recA/RAD51 gene family: evidence for ancient gene duplication and endosymbiotic gene transfer. Proc Natl Acad Sci U S A. 2006;103:10328–33. doi: 10.1073/pnas.0604232103. - DOI - PMC - PubMed
    1. Duncan JA, Reeves JR, Cooke TG. BRCA1 and BRCA2 proteins: roles in health and disease. Mol Pathol. 1998;51:237–47. doi: 10.1136/mp.51.5.237. - DOI - PMC - PubMed
    1. Roy R, Chun J, Powell SN. BRCA1 and BRCA2: different roles in a common pathway of genome protection. Nat Rev Cancer. 2012;12:68–78. doi: 10.1038/nrc3181. - DOI - PMC - PubMed
    1. Yoshida K, Miki Y. Role of BRCA1 and BRCA2 as regulators of DNA repair, transcription, and cell cycle in response to DNA damage. Cancer Sci. 2004;95:866–71. doi: 10.1111/j.1349-7006.2004.tb02195.x. - DOI - PMC - PubMed

Publication types

MeSH terms