. 2016 Oct 19:9:44.
doi: 10.1186/s13072-016-0097-x. eCollection 2016.

An H4K16 histone acetyltransferase mediates decondensation of the X chromosome in C. elegans males

Affiliations

An H4K16 histone acetyltransferase mediates decondensation of the X chromosome in C. elegans males

Alyssa C Lau et al. Epigenetics Chromatin. .

Abstract

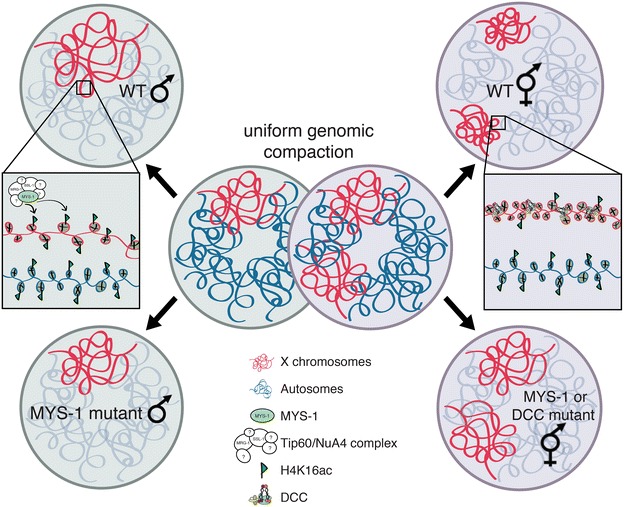
Background: In C. elegans, in order to equalize gene expression between the sexes and balance X and autosomal expression, two steps are believed to be required. First, an unknown mechanism is hypothesized to upregulate the X chromosome in both sexes. This mechanism balances the X to autosomal expression in males, but creates X overexpression in hermaphrodites. Therefore, to restore the balance, hermaphrodites downregulate gene expression twofold on both X chromosomes. While many studies have focused on X chromosome downregulation, the mechanism of X upregulation is not known.

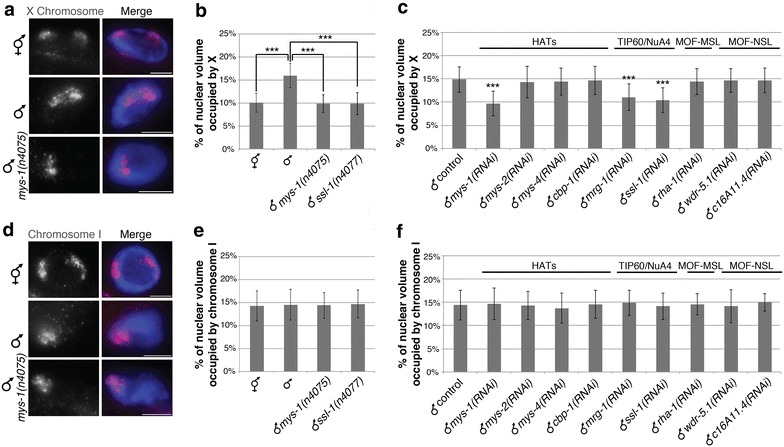
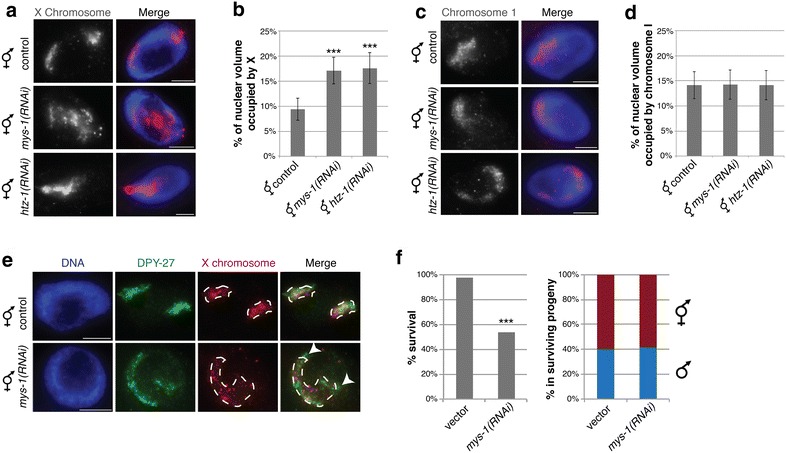
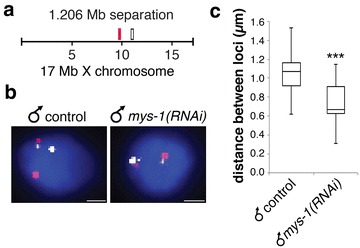
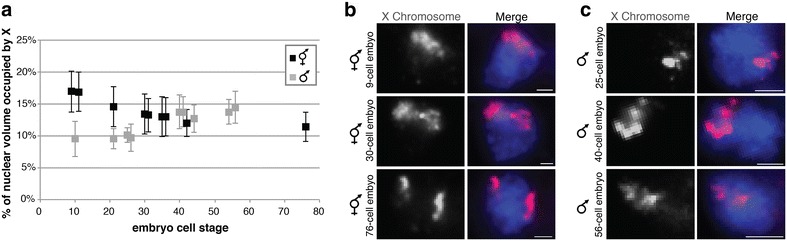
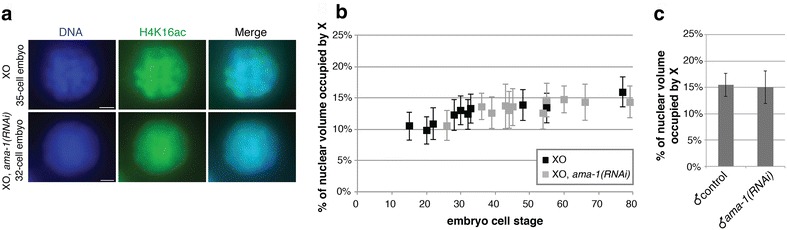
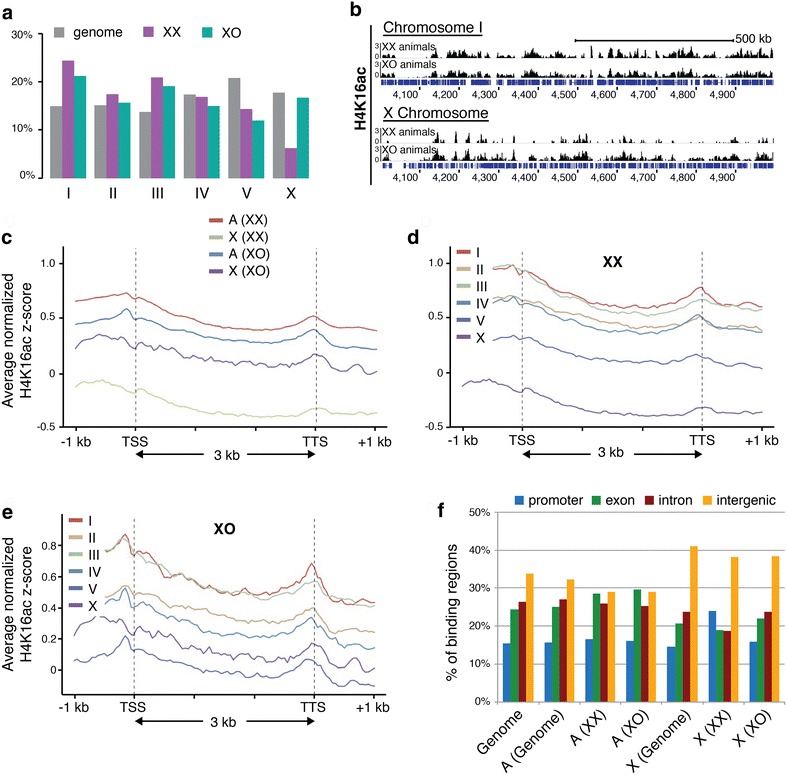
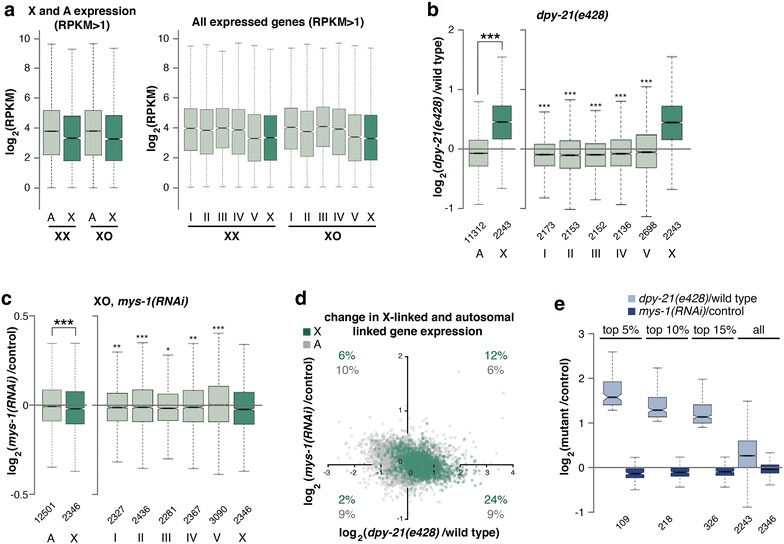
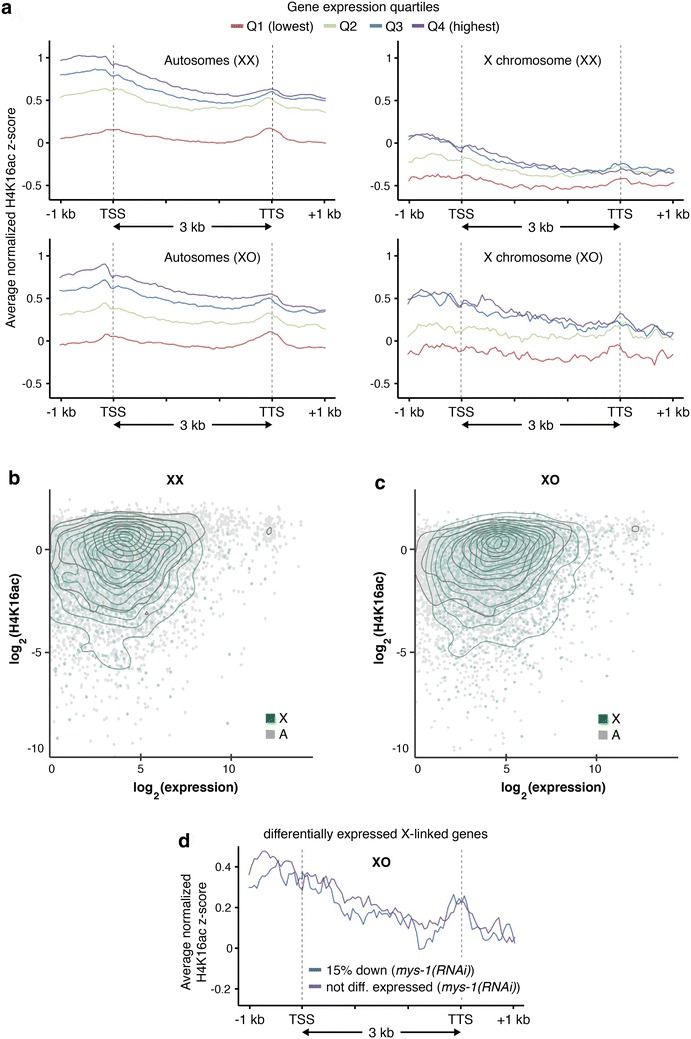
Results: To gain more insight into X upregulation, we studied the effects of chromatin condensation and histone acetylation on gene expression levels in male C. elegans. We have found that the H4K16 histone acetyltransferase MYS-1/Tip60 mediates dramatic decondensation of the male X chromosome as measured by FISH. However, RNA-seq analysis revealed that MYS-1 contributes only slightly to upregulation of gene expression on the X chromosome. These results suggest that the level of chromosome decondensation does not necessarily correlate with the degree of gene expression change in vivo. Furthermore, the X chromosome is more sensitive to MYS-1-mediated decondensation than the autosomes, despite similar levels of H4K16ac on all chromosomes, as measured by ChIP-seq. H4K16ac levels weakly correlate with gene expression levels on both the X and the autosomes, but highly expressed genes on the X chromosome do not contain exceptionally high levels of H4K16ac.

Conclusion: These results indicate that H4K16ac and chromosome decondensation influence regulation of the male X chromosome; however, they do not fully account for the high levels of gene expression observed on the X chromosomes.

Keywords: Caenorhabditis elegans; Chromatin; Chromosome territories; Dosage compensation; Epigenetics; Gene expression; Histone acetylation.


Figures

Fig. 1
Fig. 1
MYS-1 and putative Tip60-/NuA4-like complex members mediate X chromosome decondensation in males. ac Adult intestinal nuclei stained with X paint FISH (red) to label X chromosome territories and DAPI (blue) to label DNA. a Representative stained nuclei of wild-type hermaphrodites, wild-type males and mys-1(n4075) males. Scale bars equal 5 µm. b Quantification of the percentage of nuclear volume occupied by X in hermaphrodites (number of nuclei (n) = 27), males (n = 27), mys-1(n4075) males (n = 20) and ssl-1(n4077) males (n = 20). c Quantification of the percentage of nuclear volume occupied by X in vector RNAi (n = 77), histone acetyltransferases (HATs) and histone acetyltransferases complex member (Tip60/NuA4, MOF-MSL, MOF-NSL) RNAi-treated males. mys-1(RNAi; n = 30), mys-2(RNAi; n = 24), mys-4(RNAi; n = 27), cbp-1(RNAi; n = 26), mrg-1(RNAi; n = 40), ssl-1(RNAi; n = 40), rha-1(RNAi; n = 40), wrd-5.1(RNAi; n = 40), and c16A11.4(RNAi; n = 40). Error bars indicate standard deviation. Asterisks indicate level of statistical significance by t-test analysis (***P < .001). df Adult intestinal nuclei stained with chromosome I paint FISH (red) to label chromosome I territories and DAPI (blue) to label DNA. d Representative stained nuclei of wild-type hermaphrodites, wild-type males and mys-1(n4075) males. Scale bars equal 5 µm. e Quantification of the percentage of nuclear volume occupied by chromosome I in hermaphrodites (n = 20), males (n = 17), mys-1(n4075) males (n = 18) and ssl-1(n4077) males (n = 16). f Quantification of the percentage of nuclear volume occupied by chromosome I in vector RNAi (n = 43), HATs, Tip60/NuA4, MOF-MSL and MOF-NSL member RNAi-treated males. mys-1(RNAi; n = 21), mys-2(RNAi; n = 23), mys-4(RNAi; n = 17), cbp-1(RNAi; n = 28), mrg-1(RNAi; n = 17), ssl-1(RNAi; n = 17), rha-1(RNAi; n = 20), wrd-5.1(RNAi; n = 17), and c16A11.4(RNAi; n = 20)
Fig. 2
Fig. 2
The effects of MYS-1 on hermaphrodite X chromosomes. a Representative images of adult hermaphrodite intestinal nuclei in control, mys-1(RNAi) and htz-1(RNAi) stained with X paint FISH (red) to label X chromosome territories and DAPI (blue) to label DNA. Scale bars equal 5 µm. b Quantification of the percentage of nuclear volume occupied by X in control (n = 40), mys-1(RNAi; n = 36) and htz-1(RNAi; n = 37) hermaphrodites. Error bars indicate standard deviation. Asterisks indicate level of statistical significance by t-test analysis (***P < .001). c Representative images of adult hermaphrodite intestinal nuclei in control, mys-1(RNAi) and htz-1(RNAi) stained with chromosome I paint FISH (red) and DAPI (blue) to label DNA. Scale bars equal 5 µm. d Quantification of the percentage of nuclear volume occupied by chromosome I in control hermaphrodites (n = 20), mys-1(RNAi)(n = 20) and htz-1(RNAi; n = 20). Error bars indicate standard deviation. No statistically significant differences were found (P > 0.5). e Immunofluorescence with antibodies against DCC component DPY-27 (green), combined with X paint FISH (red), and DAPI (blue) staining. White arrowheads point to regions with strong DCC signal without strong X paint signal. f Unmated him-8 hermaphrodites subjected to control vector or mys-1(RNAi) were allowed to lay eggs. The percent of progeny that survived to adulthood is shown on the left, and the proportion of male and hermaphrodite worms among the surviving progeny is shown on the right. Asterisks indicate level of statistical significance by Chi-square test analysis (***P < .001)
Fig. 3
Fig. 3
Male X chromatin decondensation is evident at the genomic scale of 1.2 Mb. a FISH probe pairs across the X chromosome. The position of YAC probes (red and white boxes) used in FISH is indicated. b 2D projections of 3D stacked images. Representative tetraploid nuclei of adult males fed vector RNAi and mys-1(RNAi) stained with probe pairs across the X chromosome (red and white) and counterstained with DAPI (blue) to label DNA. Scale bars equal 1 µm. c Boxplots indicating the distribution of 3D loci distances of male vector RNAi (n = 20) and mys-1(RNAi; n = 16) diploid nuclei. Boxes show the median and interquartile range of the data. Asterisks indicate level of statistical significance by t-test analysis (***P < .001)
Fig. 4
Fig. 4
Hermaphrodite X chromosome compaction and male X chromosome decondensation occur simultaneously in development. Hermaphrodite and male embryos stained X paint FISH (red) to label X chromosome territories and DAPI (blue) to label DNA. a Plot of quantified percentages of nuclear volume occupied by X in wild-type hermaphrodite embryos (black) and male embryos (gray). Each point represents one embryo (n = 10 nuclei per embryo). Error bars indicate standard deviation. b Representative stained nuclei of wild-type hermaphrodites at various developmental stages (9 cell, 30 cell, 76 cell). Scale bars equal 5 µm. c Representative stained nuclei of male him-8(e1489) animals at various developmental stages (25 cell, 40 cell, 56 cell). Scale bars equal 1 µm
Fig. 5
Fig. 5
Transcription is not required for the initiation or maintenance of X decondensation. a H4K16ac immunofluorescence stained nuclei of XO embryos and XO embryos fed ama-1(RNAi). H4K16ac levels did not decrease in XO embryos fed ama-1(RNAi). b Plot of quantified percentages of nuclear volume occupied by X in XO embryos fed vector RNAi (black) and XO embryos fed ama-1(RNAi; gray). Each point represents one embryo (n = 10 nuclei per embryo). Error bars indicate standard deviation. c Quantification of the percentage of nuclear volume occupied by adult males fed vector RNAi (n = 20) and ama-1(RNAi; large subunit of RNA polymerase II; n = 20). Error bars indicate standard deviation
Fig. 6
Fig. 6
Profile of H4K16ac in XX and XO worms. H4K16ac ChIP-seq in XX and XO hermaphrodites. a Chromosomal distributions of H4K16ac ChIP regions compared to the fraction of the genome found on each chromosome. b Representative IGV genome browser views of ChIP-seq scores for H4K16ac. c Average normalized H4K16ac ChIP-seq enrichment scores plotted for X and autosomes across the gene body. d Average normalized H4K16ac ChIP-seq enrichment scores plotted for each chromosome across the gene body of expressed genes (RPKM > 1) in XX hermaphrodites and e XO hermaphrodites. f Percentage of H4K16ac peak found across each category of genomic sequence on the X and autosomes in XX and XO hermaphrodites compared to the fraction of the total genome and the X and A genome fraction found in each genomic category
Fig. 7
Fig. 7
RNA-seq analysis of gene expression changes in MYS-1-depleted XO worms. a X and autosome expression levels of genes with RPKM > 1 and expressed genes on individual chromosomes in XX and XO hermaphrodites. b Boxplot shows the distribution of log2 expression ratios on the X, autosomes and all separate chromosomes between dpy-21(e428) mutant XX hermaphrodites and wild-type XX hermaphrodites. X chromosome was significantly derepressed compared to the autosomal average and all other chromosomes. Increased expression from the X was tested between X and autosome by one-sided Wilcoxon rank-sum test (***P < .001). c Boxplot shows the distribution of log2 expression ratios on the X, autosomes and all separate chromosomes between XO hermaphrodites fed mys-1(RNAi) and XO hermaphrodites fed vector RNAi. X chromosome was statistically significantly repressed compared to the autosomal average and all other chromosomes, although the degree of repression was minor. Decreased expression from the X was tested between X and autosomes by one-sided Wilcoxon rank-sum test (*P < .05; **P < .01; ***P < .001). d The magnitude of log2 expression ratios of X-linked (green) and autosomal genes (gray) between XO hermaphrodites fed mys-1(RNAi) and control XO plotted against dpy-21(e428) mutants and wild-type animals. The percentages of X-linked and autosomal genes with >10 % change in expression (±0.1 in log2) in both knockdown and mutant compared to control worms are indicated in each quadrant. e Boxplots show the distribution of log2 ratios on the X between dpy-21(e428) mutants and wild-type animals and mys-1(RNAi) XO hermaphrodites and control XO hermaphrodites. The first 3 sets of boxplots show the distribution of log2 ratios of the top 5 %, top 10 % and top 15 % of highly differentially expressed X-linked genes in dpy-21(e428) mutants. The last set shows the distribution of all X-linked genes
Fig. 8
Fig. 8
Relationships between levels of H4K16ac and gene expression. a Average normalized H4K16ac ChIP-seq enrichment scores separated into quartiles according to expression plotted for X and autosomes in XX and XO hermaphrodites. b Average H4K16ac ChIP score within 500 bp upstream of the TSS plotted against the RNA level of each gene for XX and c XO hermaphrodites. Expressed autosomal genes (RPKM > 1) are represented as gray points, with point density shown by black line contour. Expressed X-linked (RPKM > 1) are represented by green dots and green line contour. d Average normalized H4K16ac ChIP-seq enrichment scores in XO hermaphrodites separated by the top 15 % downregulated X-linked genes in mys-1(RNAi) XO hermaphrodites and X-linked genes that were not differentially expressed
Fig. 9
Fig. 9
X chromosome decondensation and condensation during dosage compensation. A graphical cartoon illustrates the effects of MYS-1 and DCC on X chromosome structure in male and hermaphrodite C. elegans. In young embryos, the genome is uniformly compacted. The HAT MYS-1, which is a member of a putative worm Tip60-/NuA4-like complex, mediates decondensation of the X in males, while the DCC mediates condensation of the X in hermaphrodites. Additionally, MYS-1 activity is required for proper DCC localization, and therefore function, in hermaphrodites. Note that DCC-mediated compaction in hermaphrodites is accompanied by a twofold repression of X-linked gene expression, but MYS-1-mediated gene expression changes on the male X are much less significant

Similar articles

Cited by

References

    1. Ohno S. Sex chromosomes and sex-linked genes. Berlin: Springer; 1967. pp. 1–140.
    1. Conrad T, Akhtar A. Dosage compensation in Drosophila melanogaster: epigenetic fine-tuning of chromosome-wide transcription. Nat Rev Genet. 2011;13:123–134. doi: 10.1038/nrg3124. - DOI - PubMed
    1. Ferrari F, Alekseyenko AA, Park PJ, Kuroda MI. Transcriptional control of a whole chromosome: emerging models for dosage compensation. Nat Struct Mol Biol. 2014;21:118–125. doi: 10.1038/nsmb.2763. - DOI - PMC - PubMed
    1. Barakat TS, Gribnau J. X chromosome inactivation in the cycle of life. Development. 2012;139:2085–2089. doi: 10.1242/dev.069328. - DOI - PubMed
    1. Heard E, Disteche CM. Dosage compensation in mammals: fine-tuning the expression of the X chromosome. Genes Dev. 2006;20:1848–1867. doi: 10.1101/gad.1422906. - DOI - PubMed

Publication types

MeSH terms