

Separation of benign and malignant breast lesions using dynamic contrast enhanced MRI in a biopsy cohort
- PMID: 27766710
- PMCID: PMC5395340
- DOI: 10.1002/jmri.25501
Separation of benign and malignant breast lesions using dynamic contrast enhanced MRI in a biopsy cohort
Abstract
Purpose: To assess the diagnostic utility of contrast kinetic analysis for breast lesions and background parenchyma of women undergoing MRI-guided biopsies, for whom standard clinical analysis had failed to separate benign and malignant lesions.
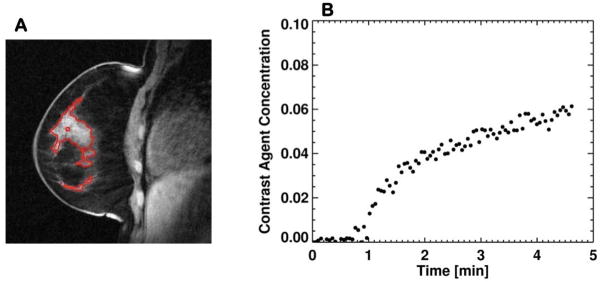
Materials and methods: This study included 115 women who had indeterminate lesions based on routine diagnostic breast MRI exams and underwent an MRI (3 Tesla) -guided biopsy of one or more lesions suspicious for breast cancer. Breast dynamic contrast-enhanced (DCE)-MRI was performed using a radial stack-of-stars three-dimensional spoiled gradient echo pulse sequence and modified k-space weighted image contrast image reconstruction. Contrast kinetic model analysis was conducted to characterize the contrast enhancement patterns measured in lesions and background parenchyma (BP). The transfer rate (Ktrans ), interstitial volume fraction (ve ), and vascular volume fraction (vp ) estimated from the lesion and BP were used to separate malignant from benign lesions.
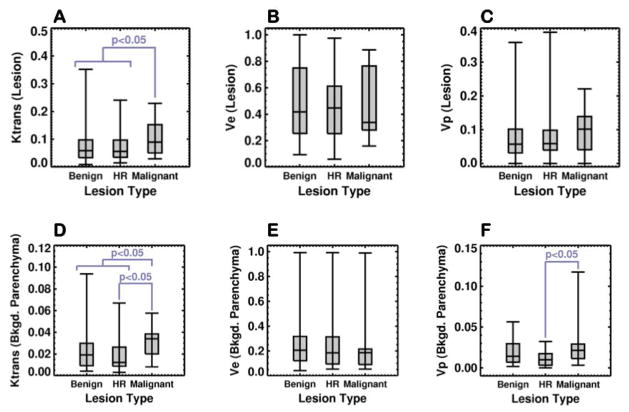
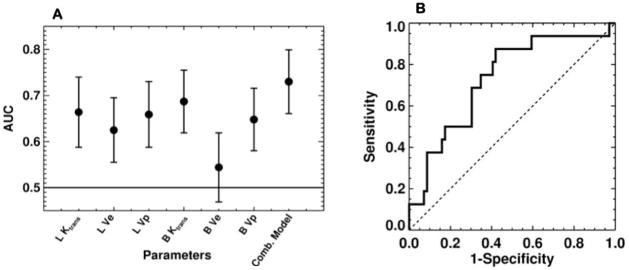
Results: The patients with malignant lesions had significantly (P < 0.05) higher median lesion-Ktrans (0.081 min-1 ), higher median BP-Ktrans (0.032 min-1 ), and BP-vp (0.020) than those without malignant lesions (0.056 min-1 , 0.017 min-1 and 0.012, respectively). The area under the receiver operating characteristic curve (AUC) of the BP-Ktrans (0.687) was highest among the single parameters and higher than that of the lesion-Ktrans (0.664). The combined logistic regression model of lesion-Ktrans , lesion-ve , BP-Ktrans , BP-ve , and BP-vp had the highest AUC of 0.730.
Conclusion: Our results suggest that the contrast kinetic analysis of DCE-MRI data can be used to differentiate the malignant lesions from the benign and high-risk lesions among the indeterminate breast lesions recommended for MRI-guided biopsy exams.
Level of evidence: 3 J. MAGN. RESON. IMAGING 2017;45:1385-1393.
Keywords: biopsy; breast cancer; breast compression; contrast kinetic analysis; dynamic contrast enhanced MRI.
© 2016 International Society for Magnetic Resonance in Medicine.
Figures

Similar articles
-
High-temporal resolution DCE-MRI improves assessment of intra- and peri-breast lesions categorized as BI-RADS 4.BMC Med Imaging. 2023 Apr 19;23(1):58. doi: 10.1186/s12880-023-01015-4. BMC Med Imaging. 2023. PMID: 37076817 Free PMC article. Clinical Trial.
-
Application of whole-lesion histogram analysis of pharmacokinetic parameters in dynamic contrast-enhanced MRI of breast lesions with the CAIPIRINHA-Dixon-TWIST-VIBE technique.J Magn Reson Imaging. 2018 Jan;47(1):91-96. doi: 10.1002/jmri.25762. Epub 2017 Jun 3. J Magn Reson Imaging. 2018. PMID: 28577335
-
Free-breathing dynamic contrast-enhanced MRI for assessment of pulmonary lesions using golden-angle radial sparse parallel imaging.J Magn Reson Imaging. 2018 Aug;48(2):459-468. doi: 10.1002/jmri.25977. Epub 2018 Feb 13. J Magn Reson Imaging. 2018. PMID: 29437281 Free PMC article.
-
Ultrafast Dynamic Contrast-Enhanced MRI of the Breast: From Theory to Practice.J Magn Reson Imaging. 2024 Aug;60(2):401-416. doi: 10.1002/jmri.29082. Epub 2023 Dec 12. J Magn Reson Imaging. 2024. PMID: 38085134 Review.
-
MRI-guided breast interventions.J Magn Reson Imaging. 2017 Sep;46(3):631-645. doi: 10.1002/jmri.25738. Epub 2017 May 4. J Magn Reson Imaging. 2017. PMID: 28470744 Review.
Cited by
-
Estimation of the capillary level input function for dynamic contrast-enhanced MRI of the breast using a deep learning approach.Magn Reson Med. 2022 May;87(5):2536-2550. doi: 10.1002/mrm.29148. Epub 2022 Jan 9. Magn Reson Med. 2022. PMID: 35001423 Free PMC article.
-
High-temporal resolution DCE-MRI improves assessment of intra- and peri-breast lesions categorized as BI-RADS 4.BMC Med Imaging. 2023 Apr 19;23(1):58. doi: 10.1186/s12880-023-01015-4. BMC Med Imaging. 2023. PMID: 37076817 Free PMC article. Clinical Trial.
-
Diagnostic performance of dynamic contrast-enhanced magnetic resonance imaging for breast cancer detection: An update meta-analysis.Thorac Cancer. 2021 Dec;12(23):3201-3207. doi: 10.1111/1759-7714.14187. Epub 2021 Oct 20. Thorac Cancer. 2021. PMID: 34668649 Free PMC article.
-
Automation of pattern recognition analysis of dynamic contrast-enhanced MRI data to characterize intratumoral vascular heterogeneity.Magn Reson Med. 2018 Mar;79(3):1736-1744. doi: 10.1002/mrm.26822. Epub 2017 Jul 20. Magn Reson Med. 2018. PMID: 28727185 Free PMC article.
-
Magnetic resonance imaging semantic and quantitative features analyses: an additional diagnostic tool for breast phyllodes tumors.Am J Transl Res. 2020 May 15;12(5):2083-2092. eCollection 2020. Am J Transl Res. 2020. PMID: 32509202 Free PMC article.
References
-
- Saslow D, Boetes C, Burke W, et al. American Cancer Society guidelines for breast screening with MRI as an adjunct to mammography. CA Cancer J Clin. 2007;57(2):75–89. - PubMed
-
- Warner E, Messersmith H, Causer P, Eisen A, Shumak R, Plewes D. Systematic review: using magnetic resonance imaging to screen women at high risk for breast cancer. Ann Intern Med. 2008;148(9):671–679. - PubMed
-
- Kuhl C. The current status of breast MR imaging. Part I. Choice of technique, image interpretation, diagnostic accuracy, and transfer to clinical practice. Radiology. 2007;244(2):356–378. - PubMed
-
- Heywang-Kobrunner SH, Bick U, Bradley WG, Jr, et al. International investigation of breast MRI: results of a multicentre study (11 sites) concerning diagnostic parameters for contrast-enhanced MRI based on 519 histopathologically correlated lesions. European radiology. 2001;11(4):531–546. - PubMed
Publication types
MeSH terms
Substances
Grants and funding
LinkOut - more resources
Full Text Sources
Other Literature Sources
Medical
Research Materials
Miscellaneous
