. 2016 Oct 18:6:35314.
doi: 10.1038/srep35314.

Altered T cell phenotypes associated with clinical relapse of multiple sclerosis patients receiving fingolimod therapy

Affiliations

Altered T cell phenotypes associated with clinical relapse of multiple sclerosis patients receiving fingolimod therapy

Chihiro Fujii et al. Sci Rep. .

Abstract

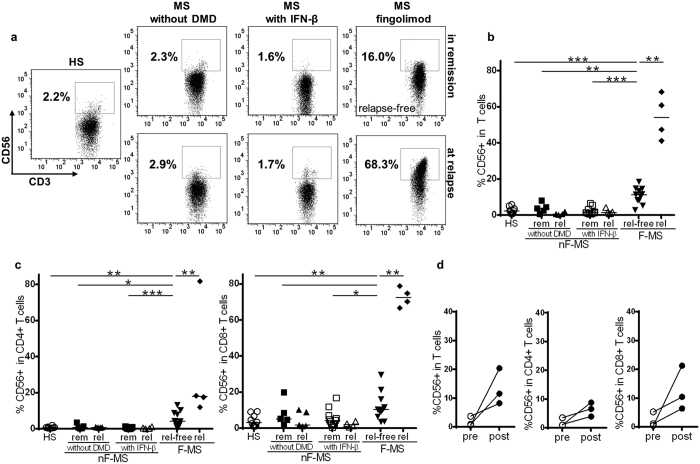
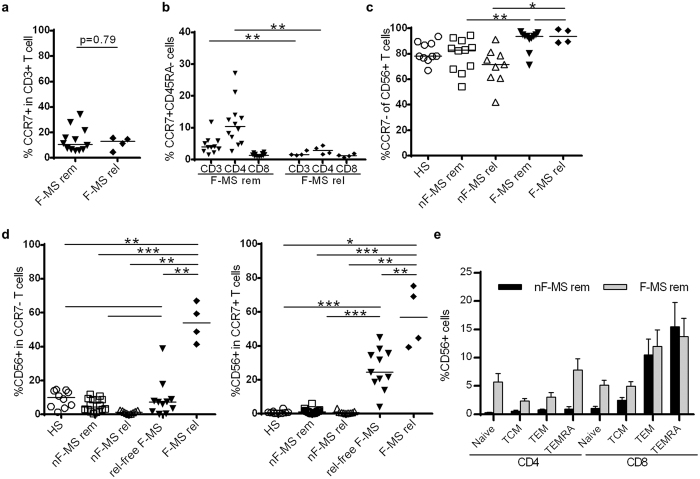
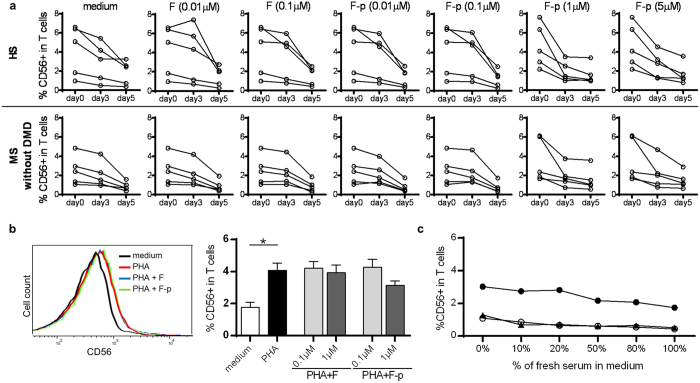
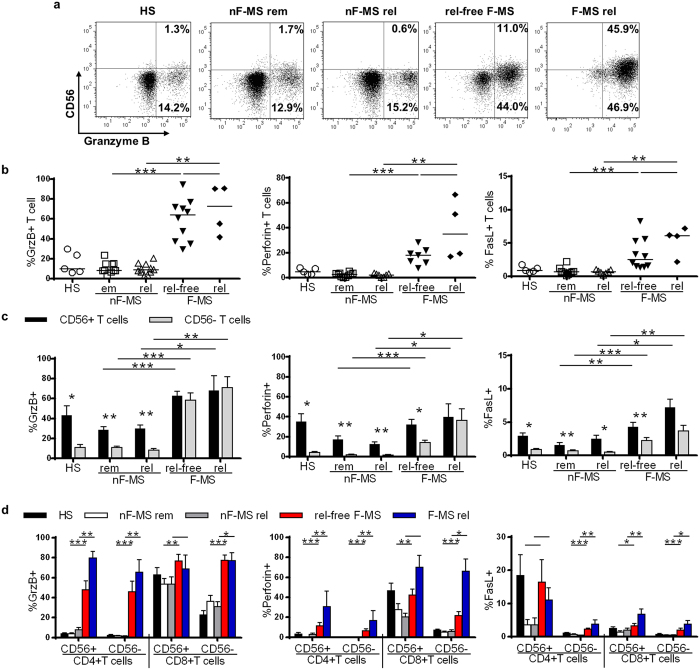
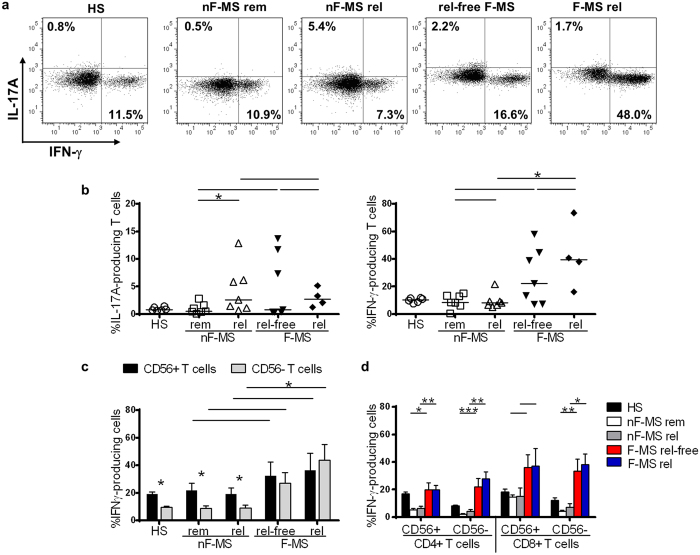
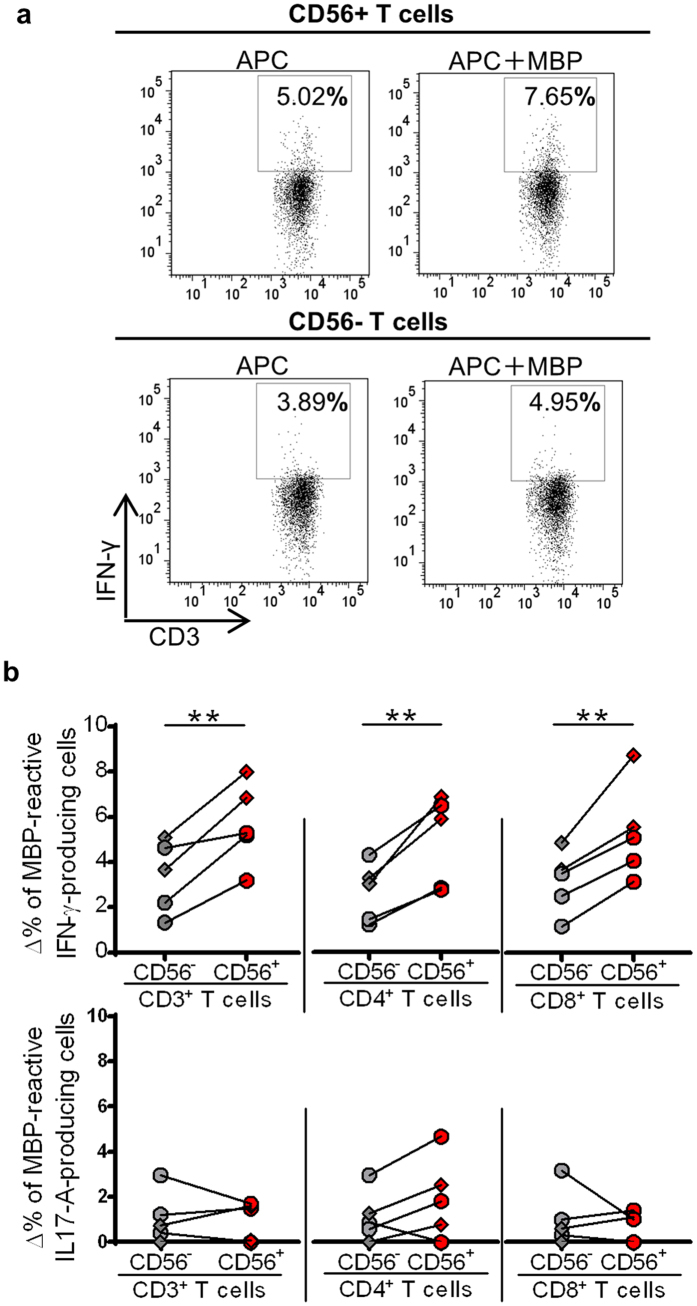
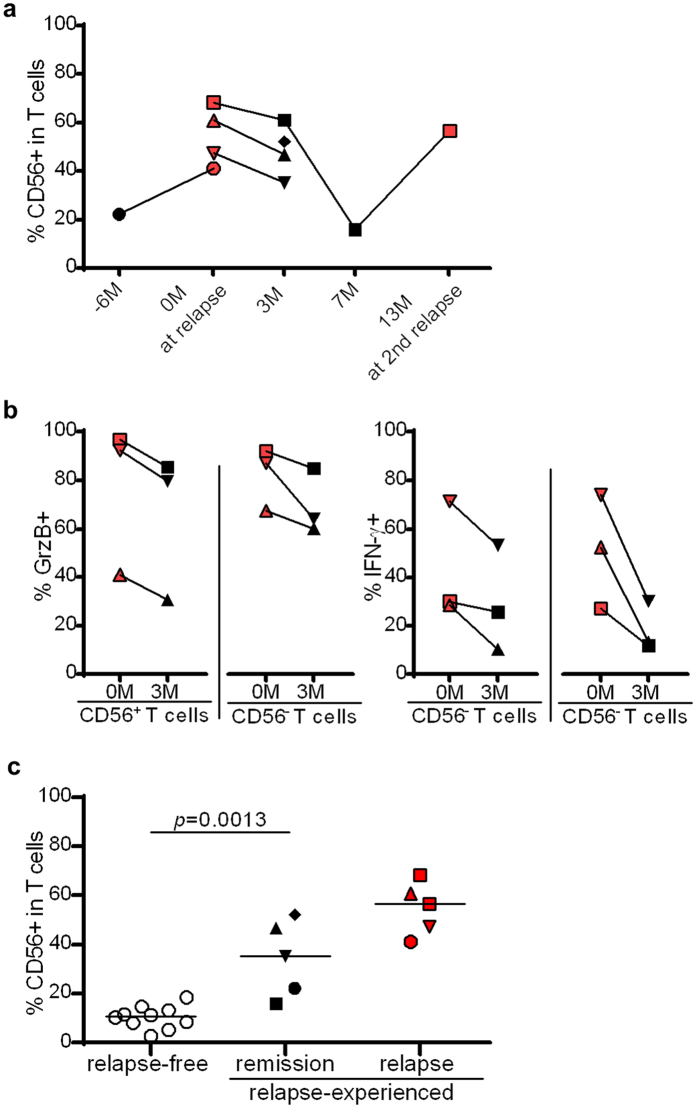
Multiple sclerosis (MS) is a T cell-mediated autoimmune disease. Fingolimod, a highly effective disease-modifying drug for MS, retains CCR7+ central memory T cells in which autoaggressive T cells putatively exist, in secondary lymphoid organs, although relapse may still occur in some patients. Here, we analyzed the T cell phenotypes of fingolimod-treated, fingolimod-untreated patients, and healthy subjects. The frequency of CD56+ T cells and granzyme B-, perforin-, and Fas ligand-positive T cells significantly increased during fingolimod treatment. Each T cell subpopulation further increased during relapse. Interestingly, T cells from fingolimod-treated patients exhibited interferon-γ biased production, and more myelin basic protein-reactive cells was noted in CD56+ than in CD56- T cells. It is likely that the altered T cell phenotypes play a role in MS relapse in fingolimod-treated patients. Further clinical studies are necessary to investigate whether altered T cell phenotypes are a biomarker for relapse under fingolimod therapy.


Figures

Figure 1
Figure 1. Frequency of CD56+ T cells in healthy subjects (HS) and patients with multiple sclerosis (MS).
(a) CD56 expression on CD3-gated T cells. Representative FACS dot plots of HS, MS patients without disease-modifying drug (MS without DMD), MS patients with IFN-β therapy (MS with IFN-β), and those with fingolimod therapy (MS with fingolimod) are shown. (b) The frequency of CD56+ cells in CD3+ T cells in the indicated groups. (c) The frequency of CD56+ cells in CD4+ T cells in the indicated groups (left), and that of CD56+ cells in CD8+ T cells in the indicated groups (right). (d) The frequency of CD56+ T cells before and after fingolimod treatment in MS patients. The frequency of CD56+ T cells within total T cells, and CD4+ and CD8+ T cell subsets is shown. nF-MS: multiple sclerosis patients without fingolimod therapy, F-MS: multiple sclerosis patients with fingolimod therapy, rem: remission, rel: relapse, rel-free: relapse-free. Bars represent median values. p-values: *p < 0.05; **p < 0.01; ***p < 0.001.
Figure 2
Figure 2. Association of CD56 and CCR7 expression on T cells in healthy subjects (HS) and multiple sclerosis (MS) patients.
(a) The frequency of CCR7+ T cells within CD3+ T cells in F-MS patients both in remission and at relapse. (b) The frequency of central memory T cells (CCR7+CD45RA T cells) within CD3+, CD4+ or CD8+ T cells in F-MS patients both in remission and at relapse. (c) The frequency of CCR7 T cells within CD56+ T cells in HS and each patient group. (d) The frequency of CD56+ cells within CCR7 and CCR7+ T cells. (e) The frequency of CD56+ cells within naïve (CCR7+CD45RA+), central memory (CCR7+CD45RA) (TCM), effector memory (CCR7CD45RA) (TEM) and CD45RA+ TEM (TEMRA) subsets in CD4+ and CD8+ T cells. nF-MS: multiple sclerosis patients without fingolimod therapy, F-MS: multiple sclerosis patients with fingolimod therapy, rem: remission, rel: relapse, rel-free: relapse-free. Bars represent median values. p-values: *p < 0.05; **p < 0.01; ***p < 0.001.
Figure 3
Figure 3. Effect of fingolimod, fingolimod-phosphate and the serums of patients under fingolimod therapy on CD56 expression in vitro.
(a) Kinetic change of CD56+ T cells co-cultured with fingolimod (F) or fingolimod-phosphate (F-p) for 5 days in healthy subjects (HS) and multiple sclerosis patients without disease-modifying drug (MS without DMD). (b) CD56 expression on T cells stimulated by PHA in the presence or absence of fingolimod or fingolimod phosphate at a concentration of 0.1 and 1 μM. Representative graphs of CD56 expression on T cells cultured in the presence of PHA, PHA with 0.1 μM fingolimod and PHA with 0.1 μM fingolimod-phosphate (left panel) (c) CD56 expression on T cells of MS without DMD co-cultured with serum of the same patient after fingolimod therapy. Each column represents mean ± SEM. p-values: *p < 0.05.
Figure 4
Figure 4. Expression of cytotoxic molecules in each T cell subset of healthy subjects (HS) and multiple sclerosis (MS) patients.
(a) Representative analysis of CD56 and granzyme B expression, gated on CD3+ T cells from left to right: a healthy subject, an MS patient not on fingolimod in remission (nF-MS rem) and one at relapse (nF-MS rel), a relapse-free MS patient with fingolimod therapy (rel-free F-MS) and one at relapse (F-MS rel). (b) The expression of granzyme B (GrzB), perforin, and Fas-Ligand (FasL) in or on CD3+ T cells are shown. (c) The frequency of cells expressing each cytotoxic molecule was compared between CD56+ and CD56 T cells. (d) The frequency of cells expressing each cytotoxic molecule in CD4+CD56+ T cells, CD4+CD56 T cells, CD8+CD56+ T cells, and CD8+CD56 T cells. Bars represent median values. Each column represents mean ± SEM. p-values: *p < 0.05; **p < 0.01; ***p < 0.001.
Figure 5
Figure 5. The frequency of proinflammatory cytokine-producing cells in response to PMA/ionomycin stimulation.
(a) Representative data of FACS dot plots analyzing IFN-γ and IL-17A production gated on CD3+ T cells. Depicted as follows from left to right, a healthy subject (HS), a multiple sclerosis (MS) patient not on fingolimod in remission (nF-MS rem) and one at relapse (nF-MS rel), and a relapse-free patient with fingolimod therapy (rel-free F-MS) and one at relapse (F-MS rel). (b) The frequency of IL-17A-producing cells in CD3+ T cells (left) and that of IFN-γ-producing cells in CD3+ T cells (right). (c) The frequency of IFN-γ producing cells was compared between CD56+ and CD56 T cells. (d) The frequency of IFN-γ-producing cells in CD4+CD56+ T cells and CD4+CD56 T cells, CD8+CD56+ T cells and CD8+CD56 T cells. Bars represent median values. Each column represents mean ± SEM. P-values: *p < 0.05; **p < 0.01; ***p < 0.001.
Figure 6
Figure 6. Myelin basic protein (MBP)-reactive proinflammatory cytokine production by CD56+ T cells from multiple sclerosis (MS) patients on fingolimod in remission.
CD56+ and CD56 T cells were co-cultured with antigen-presenting cells (APC) in the presence or absence of MBP peptide mixture, and intracellular cytokines were analyzed by flow cytometry. (a) Representative FACS dot plots of IFN-γ-producing cells in CD56+ and CD56 T cells when the cells were co-cultured with APC in the presence or absence of MBP. (b) The delta frequency of cells that produced IFN-γ (upper row) and IL-17A (bottom row) within CD56+ and CD56 T cells. The delta frequency was calculated by subtracting the frequency of cytokine-producing cells in the absence of MBP from that in the presence of MBP. Diamonds are data from relapse-experienced MS patients with fingolimod therapy in remission, and circles represent relapse-free MS patients while on fingolimod treatment. Bars represent median values. p-values: **p < 0.01.
Figure 7
Figure 7. Longitudinal analysis of CD56 expression, granzyme B (GrzB) expression, and frequency of IFN-γ-producing cells in relapse-experienced multiple sclerosis (MS) patients on fingolimod.
(a) Temporal changes in the frequency of CD56-expressing cells within the CD3+ T cell fraction. (b) The frequency of GrzB-expressing cells and IFN-γ-producing cells in CD56+ and CD56 T cell subsets decreased 3 months after relapse. (c) The frequency of CD56 expression in relapse-experienced MS patients with fingolimod therapy in remission remained higher than in patients who did not have any relapse while on fingolimod treatment. Each relapse-experienced patient is indicated by different-shaped dots. The frequencies at relapse are presented as red dots, and those in remission are presented as black dots. Bars represent median values. p-values: **p < 0.01.
Figure 8
Figure 8. The frequency of Foxp3+ regulatory T cells in multiple sclerosis patients and healthy subjects.
The frequency of regulatory T cells (Treg cells: CD3+CD4+CD25+Foxp3+ cells) in CD3+ T cells (upper) and CD4+ T cells (bottom). HS: healthy subjects, nF-MS: multiple sclerosis patients without fingolimod therapy, F-MS: multiple sclerosis patients with fingolimod therapy, rem: remission, rel: relapse, rel-free: relapse-free. Bars represent median values. p-values: *p < 0.05; **p < 0.01.

Similar articles

Cited by

References

    1. Sospedra M. & Martin R. Immunology of multiple sclerosis. Annual review of immunology 23, 683–747 (2005). - PubMed
    1. Axtell R. C. et al.. T helper type 1 and 17 cells determine efficacy of interferon-beta in multiple sclerosis and experimental encephalomyelitis. Nature medicine 16, 406–412 (2010). - PMC - PubMed
    1. Sallusto F. et al.. T-cell trafficking in the central nervous system. Immunological reviews 248, 216–227 (2012). - PubMed
    1. Steinman L. Immunology of relapse and remission in multiple sclerosis. Annual review of immunology 32, 257–281 (2014). - PubMed
    1. Brinkmann V. et al.. Fingolimod (FTY720): discovery and development of an oral drug to treat multiple sclerosis. Nature reviews. Drug discovery 9, 883–897 (2010). - PubMed

MeSH terms