Dynamics of the mouse brain cortical synaptic proteome during postnatal brain development
- PMID: 27748445
- PMCID: PMC5066275
- DOI: 10.1038/srep35456
Dynamics of the mouse brain cortical synaptic proteome during postnatal brain development
Abstract
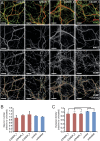
Development of the brain involves the formation and maturation of numerous synapses. This process requires prominent changes of the synaptic proteome and potentially involves thousands of different proteins at every synapse. To date the proteome analysis of synapse development has been studied sparsely. Here, we analyzed the cortical synaptic membrane proteome of juvenile postnatal days 9 (P9), P15, P21, P27, adolescent (P35) and different adult ages P70, P140 and P280 of C57Bl6/J mice. Using a quantitative proteomics workflow we quantified 1560 proteins of which 696 showed statistically significant differences over time. Synaptic proteins generally showed increased levels during maturation, whereas proteins involved in protein synthesis generally decreased in abundance. In several cases, proteins from a single functional molecular entity, e.g., subunits of the NMDA receptor, showed differences in their temporal regulation, which may reflect specific synaptic development features of connectivity, strength and plasticity. SNARE proteins, Snap 29/47 and Stx 7/8/12, showed higher expression in immature animals. Finally, we evaluated the function of Cxadr that showed high expression levels at P9 and a fast decline in expression during neuronal development. Knock down of the expression of Cxadr in cultured primary mouse neurons revealed a significant decrease in synapse density.
Figures


Similar articles
-
Fmr1 deficiency promotes age-dependent alterations in the cortical synaptic proteome.Proc Natl Acad Sci U S A. 2015 Aug 25;112(34):E4697-706. doi: 10.1073/pnas.1502258112. Epub 2015 Aug 11. Proc Natl Acad Sci U S A. 2015. PMID: 26307763 Free PMC article.
-
Developmental genetic profiles of glutamate receptor system, neuromodulator system, protector of normal tissue and mitochondria, and reelin in marmoset cortex: potential molecular mechanisms of pruning phase of spines in primate synaptic formation process during the end of infancy and prepuberty (II).Biochem Biophys Res Commun. 2014 Feb 14;444(3):307-10. doi: 10.1016/j.bbrc.2014.01.023. Epub 2014 Jan 16. Biochem Biophys Res Commun. 2014. PMID: 24440696
-
Comparative study of human and mouse postsynaptic proteomes finds high compositional conservation and abundance differences for key synaptic proteins.PLoS One. 2012;7(10):e46683. doi: 10.1371/journal.pone.0046683. Epub 2012 Oct 5. PLoS One. 2012. PMID: 23071613 Free PMC article.
-
The synaptic proteome.Cell Tissue Res. 2015 Jan;359(1):255-65. doi: 10.1007/s00441-014-1943-4. Epub 2014 Jul 20. Cell Tissue Res. 2015. PMID: 25038742 Review.
-
LAR-RPTPs: synaptic adhesion molecules that shape synapse development.Trends Cell Biol. 2013 Oct;23(10):465-75. doi: 10.1016/j.tcb.2013.07.004. Epub 2013 Aug 3. Trends Cell Biol. 2013. PMID: 23916315 Review.
Cited by
-
Active presynaptic ribosomes in the mammalian brain, and altered transmitter release after protein synthesis inhibition.Elife. 2018 Oct 30;7:e36697. doi: 10.7554/eLife.36697. Elife. 2018. PMID: 30375975 Free PMC article.
-
Astrocytes, neurons, synapses: a tripartite view on cortical circuit development.Neural Dev. 2018 May 1;13(1):7. doi: 10.1186/s13064-018-0104-y. Neural Dev. 2018. PMID: 29712572 Free PMC article. Review.
-
Distinct brain regional proteome changes in the rTg-DI rat model of cerebral amyloid angiopathy.J Neurochem. 2021 Oct;159(2):273-291. doi: 10.1111/jnc.15463. Epub 2021 Aug 17. J Neurochem. 2021. PMID: 34218440 Free PMC article.
-
Nacc1 Mutation in Mice Models Rare Neurodevelopmental Disorder with Underlying Synaptic Dysfunction.J Neurosci. 2024 Apr 3;44(14):e1610232024. doi: 10.1523/JNEUROSCI.1610-23.2024. J Neurosci. 2024. PMID: 38388424 Free PMC article.
-
Age-Dependent Hippocampal Proteomics in the APP/PS1 Alzheimer Mouse Model: A Comparative Analysis with Classical SWATH/DIA and directDIA Approaches.Cells. 2021 Jun 24;10(7):1588. doi: 10.3390/cells10071588. Cells. 2021. PMID: 34202490 Free PMC article.
References
-
- Chua J. J., Kindler S., Boyken J. & Jahn R. The architecture of an excitatory synapse. J Cell Sci 123, 819–823 (2010). - PubMed
-
- Bayes A. & Grant S. G. Neuroproteomics: understanding the molecular organization and complexity of the brain. Nat Rev Neurosci 10, 635–646 (2009). - PubMed
-
- Meredith R. M. Sensitive and critical periods during neurotypical and aberrant neurodevelopment: a framework for neurodevelopmental disorders. Neuroscience and biobehavioral reviews 50, 180–188 (2015). - PubMed
-
- Li M. et al.. Synaptogenesis in the developing mouse visual cortex. Brain Res Bull 81, 107–113 (2010). - PubMed
Publication types
MeSH terms
Substances
LinkOut - more resources
Full Text Sources
Other Literature Sources
Research Materials

