. 2016 Oct 13;7(10):e2421.
doi: 10.1038/cddis.2016.305.

Natural product pectolinarigenin inhibits osteosarcoma growth and metastasis via SHP-1-mediated STAT3 signaling inhibition

Affiliations

Natural product pectolinarigenin inhibits osteosarcoma growth and metastasis via SHP-1-mediated STAT3 signaling inhibition

Tao Zhang et al. Cell Death Dis. .

Erratum in

Retraction in

Abstract

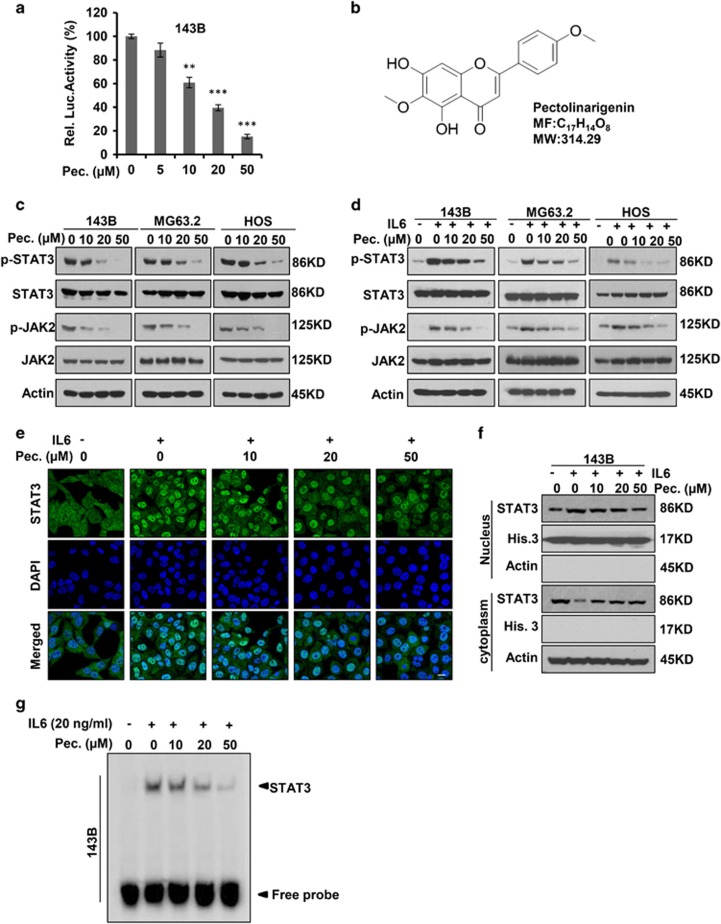
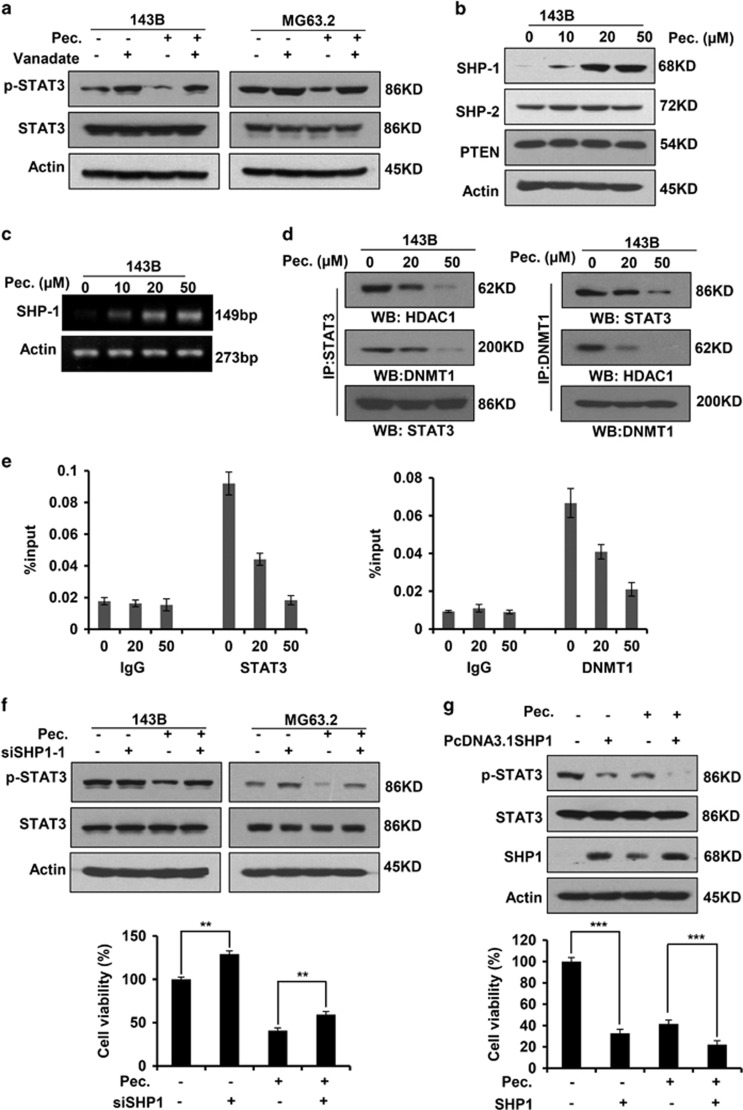
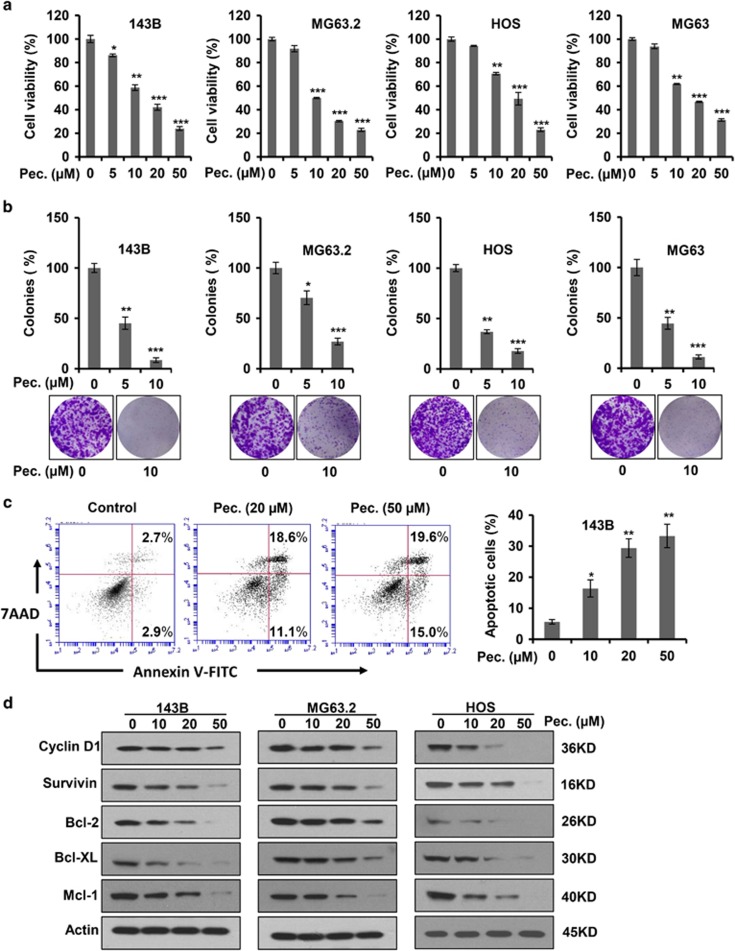
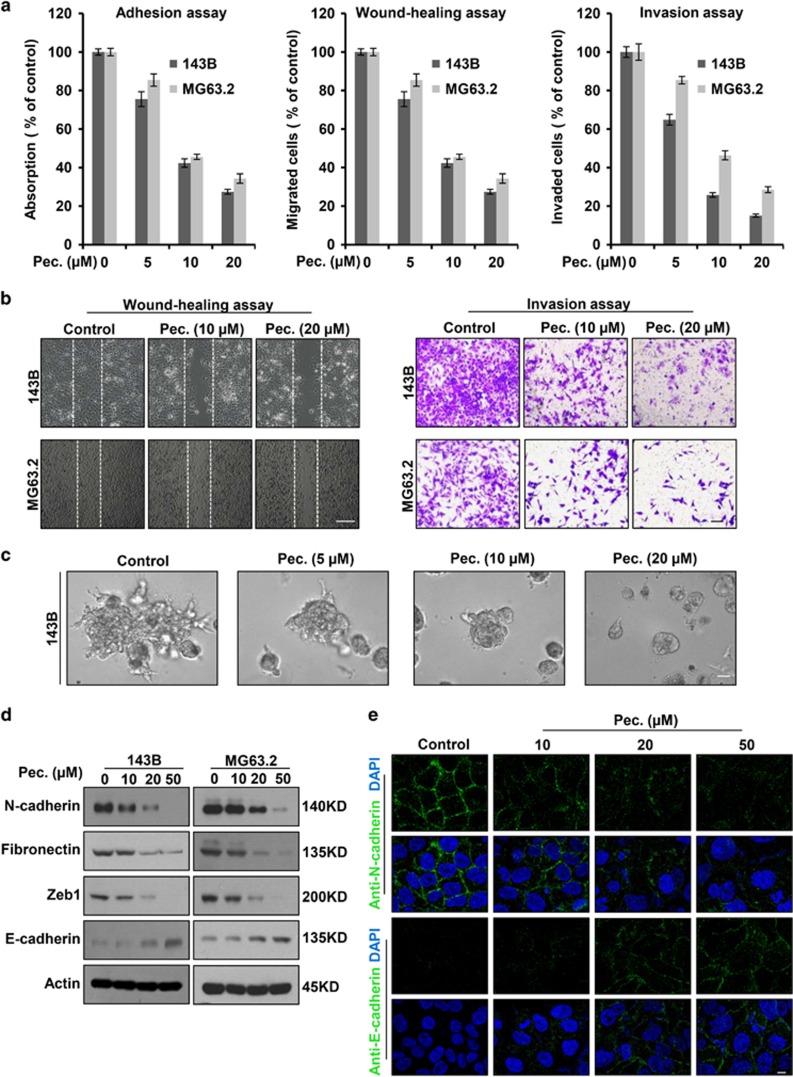
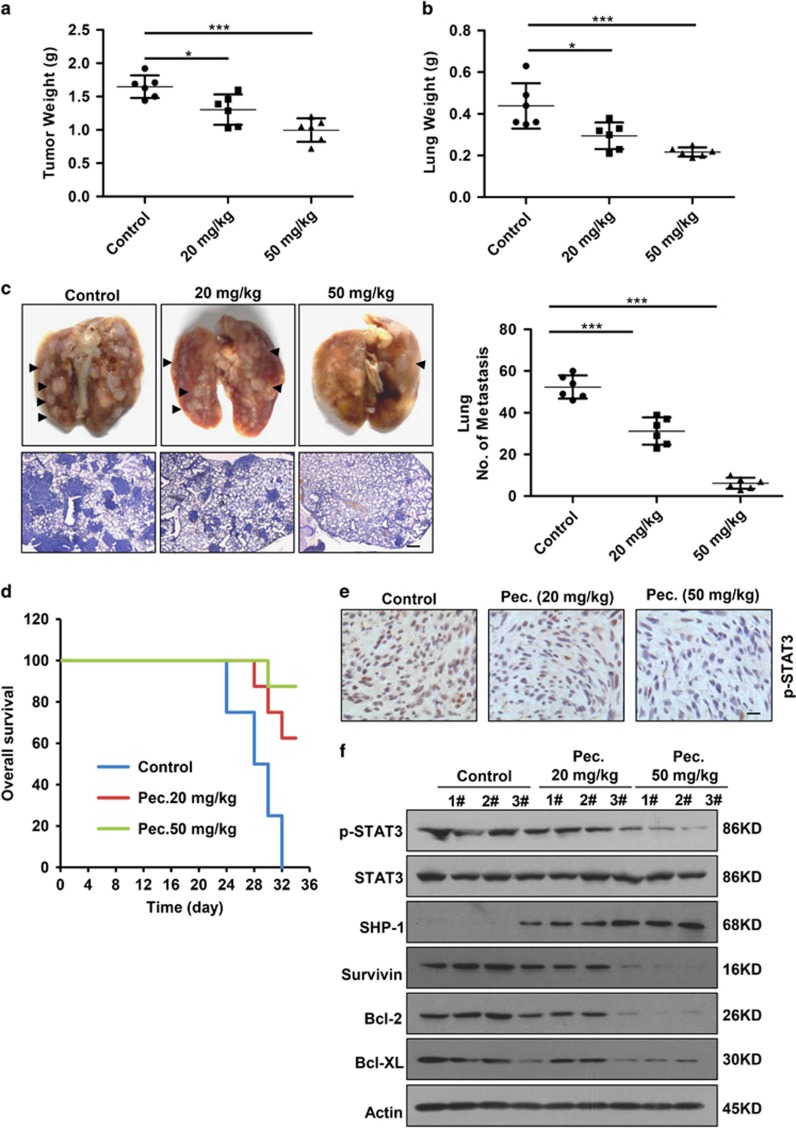
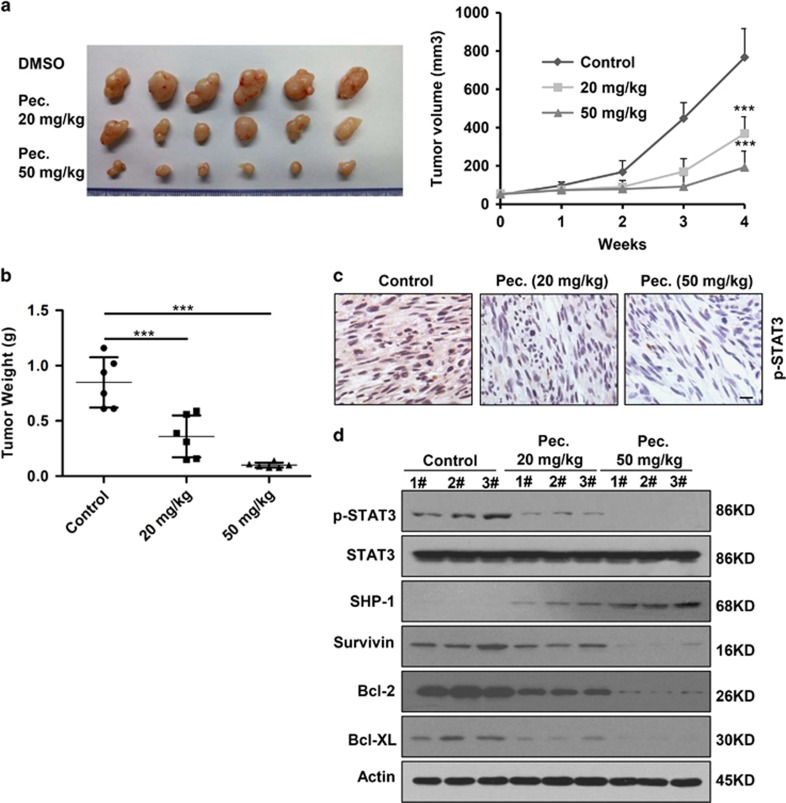
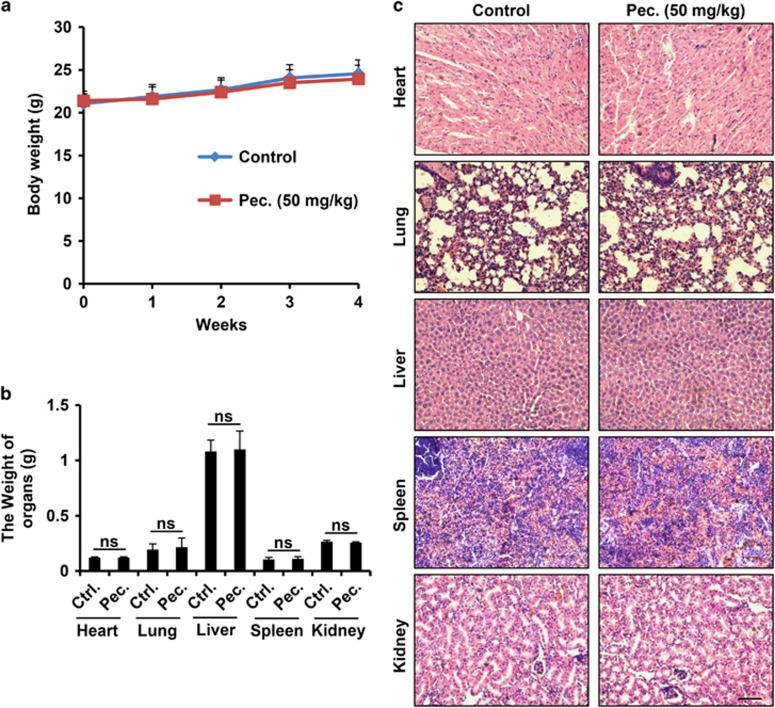
Signal transducer and activator of transcription 3 (STAT3) has important roles in cancer aggressiveness and has been confirmed as an attractive target for cancer therapy. In this study, we used a dual-luciferase assay to identify that pectolinarigenin inhibited STAT3 activity. Further studies showed pectolinarigenin inhibited constitutive and interleukin-6-induced STAT3 signaling, diminished the accumulation of STAT3 in the nucleus and blocked STAT3 DNA-binding activity in osteosarcoma cells. Mechanism investigations indicated that pectolinarigenin disturbed the STAT3/DNA methyltransferase 1/HDAC1 histone deacetylase 1 complex formation in the promoter region of SHP-1, which reversely mediates STAT3 signaling, leading to the upregulation of SHP-1 expression in osteosarcoma. We also found pectolinarigenin significantly suppressed osteosarcoma cell proliferation, induced apoptosis and reduced the level of STAT3 downstream proteins cyclin D1, Survivin, B-cell lymphoma 2 (Bcl-2), B-cell lymphoma extra-large (Bcl-xl) and myeloid cell leukemia 1 (Mcl-1). In addition, pectolinarigenin inhibited migration, invasion and reserved epithelial-mesenchymal transition (EMT) phenotype in osteosarcoma cells. In spontaneous and patient-derived xenograft models of osteosarcoma, we identified administration (intraperitoneal) of pectolinarigenin (20 mg/kg/2 days and 50 mg/kg/2 days) blocked STAT3 activation and impaired tumor growth and metastasis with superior pharmacodynamic properties. Taken together, our findings demonstrate that pectolinarigenin may be a candidate for osteosarcoma intervention linked to its STAT3 signaling inhibitory activity.


Figures

Figure 1
Figure 1
Pectolinarigenin inhibits STAT3 activity in osteosarcoma. (a) 143B cells were transfected with STAT3 luciferase reporter gene plasmid and treated with different concentrations of pectolinarigenin for 24 h. The results were normalized to the Renilla luciferase activity (**P<0.01; ***P<0.001). (b) Chemical structure of pectolinarigenin. (c) A panel of osteosarcoma cell lines was exposed to the indicated concentrations of pectolinarigenin for 24 h. Cells were then lysed and applied to immunoblotting with the indicated antibodies. Actin was used as an internal control. (d) Osteosarcoma cell lines were pretreated with the indicated concentrations of pectolinarigenin for 24 h and then stimulated with IL-6 (20 ng/μl) for 30 min. Whole-cell extracts were prepared and subjected to western blot using the indicated antibodies. (e) 143B cells were seeded on gelatin-coated coverslips and pretreated with pectolinarigenin for 24 h followed by stimulating with IL-6 (20 ng/μl) for 30 min. The coverslips were examined by a confocal microscopy. Anti-STAT3 antibody (green) was used to locate endogenous STAT3. Cell nuclei were stained with 4′, 6-diamidino-2-phenylindole (DAPI). Scale bar, 20 μm. (f) 143B cells were treated with pectolinarigenin for 24 h, and the cytoplasmic and nuclear extractions were subjected to immunoblotting to detect the level of STAT3. (g) 143B cells were pretreated with pectolinarigenin and stimulated with IL-6. An EMSA assay was performed to analyze STAT3 DNA-binding activity
Figure 2
Figure 2
SHP-1 has an important role in pectolinarigenin-mediated STAT3 Tyr705 phosphrylation repression. (a) 143B and MG63.2 cells were treated with vanadate (100 μM) and pectolinarigenin (20 μM). Whole-cell lysates were prepared and applied to immunoblotting with an anti-phospho-STAT3 (Y705) antibody. (b) 143B cells were exposed to increasing concentrations of pectolinarigenin. SHP-1, SHP-2 and PTEN were probed by a western blot assay. (c) 143B cells were treated with pectolinarigenin for 24 h and then analyzed for SHP-1 mRNA expression by RT-PCR. (d) 143B cells were treated with pectolinarigenin and nuclear extracts were prepared. The immunoprecipitation assay was performed using indicated antibodies. (e) 143B cells were incubated with pectolinarigenin and the proteins were cross-linked with DNA and analyzed by a quantitative ChIP assay with indicated antibodies. (f) 143B cells were transfected with SHP-1 siRNA and treated with pectolinarigenin (20 μM). Western blot analysis was used for detecting phospho-Tyr705-STAT3 expression. Cell viability was measured by a MTS assay (**P<0.01). (g) SHP-1 was overexpressed in 143B cells. Cells were then incubated with 20 μM pectolinarigenin. Phospho-Tyr705-STAT3, STAT3 and SHP-1 were detected by a western blot assay. Cell viability was measured by a MTS assay (***P<0.001)
Figure 3
Figure 3
Pectolinarigenin inhibits osteosarcoma cells proliferation, colony formation, and induces apoptosis in osteosarcoma cell lines. (a) Osteosarcoma cells (143B, MG63.2, HOS and MG63) were treated with increasing concentrations of pectolinarigenin for 48 h and a MTS assay was performed (**P<0.01; ***P<0.001). (b) Osteosarcoma cells were seeded into six-well plates and treated with or without 10 μM pectolinarigenin for a week. Colonies were then fixed and stained with 0.1% crystal violet. Images were taken by an invert microscope (Leica). Colony numbers were counted manually (*P<0.05; **P<0.01; ***P<0.001). (c) 143B cells were treated with pectolinarigenin at the indicated doses for 48 h. Apoptotic cells were labeled with Annexin V and PI and analyzed by flow cytometry (*P<0.05; **P<0.01). (d) A western blot assay was used to detect the protein level of STAT3 target genes after pectolinarigenin exposure
Figure 4
Figure 4
Pectolinarigenin inhibits adhesion, migration, invasion and reversed EMT phenotype in osteosarcoma cells. (a) Left panel, adhesion assay. 143B and MG63.2 cells were pretreated with various concentrations of pectolinarigenin for 12 h. Cells were trypsinized, and seeded on a fibronectin coated 96-well plate. After 15 min, non-adherent cells were removed and adherent cells were stained with 0.1% crystal violet. The precipitates were dissolved in 30% acetic acid, and the absorption at 590 nm was acquired. Middle panel, wound-healing migration assay. 143B and MG63.2 cells were seeded into six-well plates and left to grow to full confluence. Cells were scratched to create a wound and exposed to different concentrations of pectolinarigenin. Images were acquired after 12 h. Cell migration was quantified manually. Right panel, invasion assay. 143B and MG63.2 cells were resuspended in serum-free medium and seeded into the upper chamber of the transwell inserts precoated with Matrigel. Complete medium containing different concentrations of pectolinarigenin were added in the bottom well. After 12- h incubation, images were obtained. Cell invasion was quantified manually. (b) Representative images of migration (left panel) and invasion assay (right panel). Scale bar, 100 μm. (c) 3D culture assay. 143B cells were seeded onto solidified Matrigel. Complete medium containing 10% Matrigel and increasing concentrations of pectolinarigenin were added on top of the cells. Four days later, cells were photographed using an inverted microscope. Scale bar, 100 μm. (d) 143B and MG63.2 cells were incubated with increasing doses of pectolinarigenin for 72 h. EMT-related markers were probed by a western blot assay. (e) 143B cells were treated with pectolinarigenin at the indicated doses. Cells were examined for the expression of N-cadherin (green) and E-cadherin (green) by immunofluorescence staining. Nuclei were stained with DAPI (blue). Scale bar, 10 μm
Figure 5
Figure 5
Pectolinarigenin inhibits tumor growth, metastasis and prolongs survival in an orthotopic osteosarcoma mouse model. (a) 143B cells were injected into the medullary cavity of tibia of the tested mice. Twenty-four days after pectolinarigenin administration, mice in different groups were killed and the posterior limb with tumors was weighed (*P<0.05; ***P<0.001). (b) Lungs in different groups were excised and weighed (*P<0.05; ***P<0.001). (c) Lung colonization was visualized by a dissecting microscope and lung metastasis nodules were counted manually (***P<0.001). In all, 4 μm sections of lungs were subject to H&E staining (left lower panel). Scale bar, 100 μm. (d) Overall survival rate in the orthotopic osteosarcoma mouse model. (e) Primary tumors were removed, fixed and paraffin embedded at the end of the experiment. Four micrometer (4 μm) sections were analyzed by IHC using an anti-phospho-STAT3 (Y705) antibody. Scale bar, 100 μm. (f) Primary tumors were lysed and subjected to immunoblotting with indicated antibodies. Actin was used as a loading control
Figure 6
Figure 6
Pectolinarigenin inhibits tumor growth in a patient-derived osteosarcoma xenograft (PDX) animal model. (a) Representative images of patient-derived osteosarcoma grafts removed from mice after administration of pectolinarigenin for 28 days (left panel). Summary results of the PDX tumor volume in control group and pectolinarigenin-treated group (***P<0.001) (right panel). (b) PDX tumor weight in each group was measured (***P<0.001). (c) Patient-derived grafts were fixed and paraffin embedded. Four micrometer (4 μm) sections were analyzed by IHC using an anti-phospho-STAT3 (Y705) antibody. Scale bar, 100 μm. (d) PDX tumor was lysed and applied to immunoblotting with with indicated antibodies. Actin was used as a loading control
Figure 7
Figure 7
The potential toxicity of pectolinarigenin on mice. (a) Pectolinarigenin was administrated at the dose of 50 mg/kg/2 days for 28 days. Mice body weight was monitored once a week. (b) Major organs weight was evaluated when the experiment terminated. NS, no significance. (c) Major organs from control group and pectolinarigenin-treated group were stained with H&E. Scale bar, 100 μm

Similar articles

Cited by

References

    1. Picci P. Osteosarcoma (osteogenic sarcoma). Orphanet J Rare Dis 2007; 2: 6. - PMC - PubMed
    1. Broadhead ML, Clark JC, Myers DE, Dass CR, Choong PF. The molecular pathogenesis of osteosarcoma: a review. Sarcoma 2011; 2011: 959248. - PMC - PubMed
    1. Mirabello L, Troisi RJ, Savage SA. Osteosarcoma incidence and survival rates from 1973 to 2004: data from the Surveillance, Epidemiology, and End Results Program. Cancer 2009; 115: 1531–1543. - PMC - PubMed
    1. Deng J, Grande F, Neamati N. Small molecule inhibitors of Stat3 signaling pathway. Curr Cancer Drug Targets 2007; 7: 91–107. - PubMed
    1. Zhang Z, Mao H, Du X, Zhu J, Xu Y, Wang S et al. A novel small molecule agent displays potent anti-myeloma activity by inhibiting the JAK2-STAT3 signaling pathway. Oncotarget 2016; 7: 9296–9308. - PMC - PubMed

Publication types

MeSH terms