. 2016 Oct 11;17(3):759-773.
doi: 10.1016/j.celrep.2016.09.034.

Defective Transcytosis of APP and Lipoproteins in Human iPSC-Derived Neurons with Familial Alzheimer's Disease Mutations

Affiliations

Defective Transcytosis of APP and Lipoproteins in Human iPSC-Derived Neurons with Familial Alzheimer's Disease Mutations

Grace Woodruff et al. Cell Rep. .

Abstract

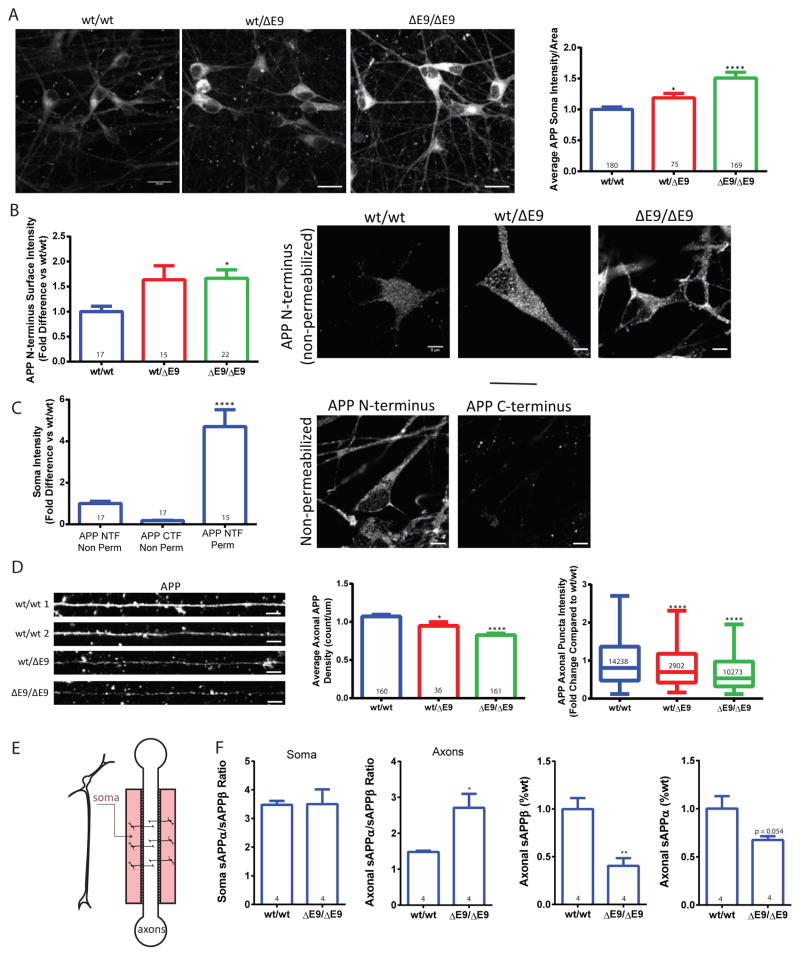
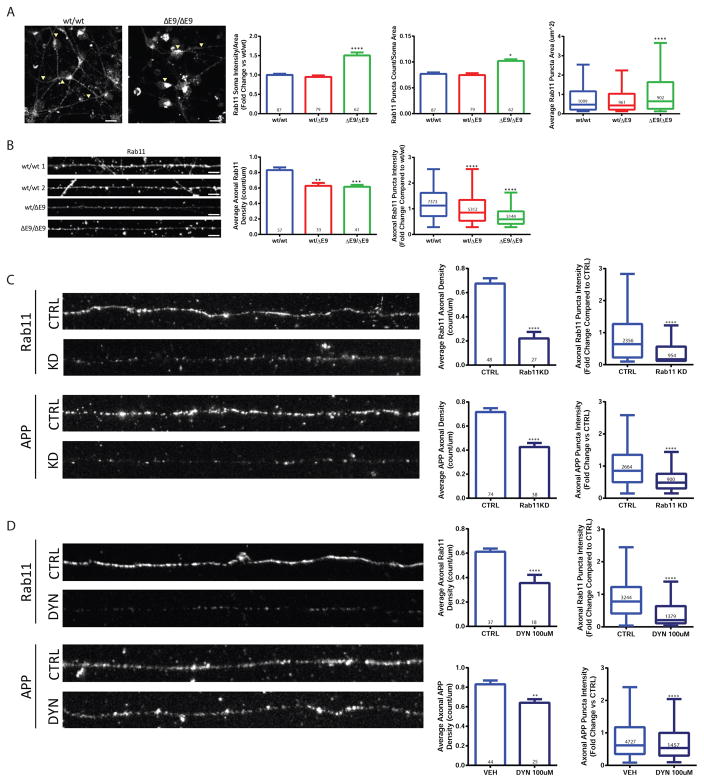
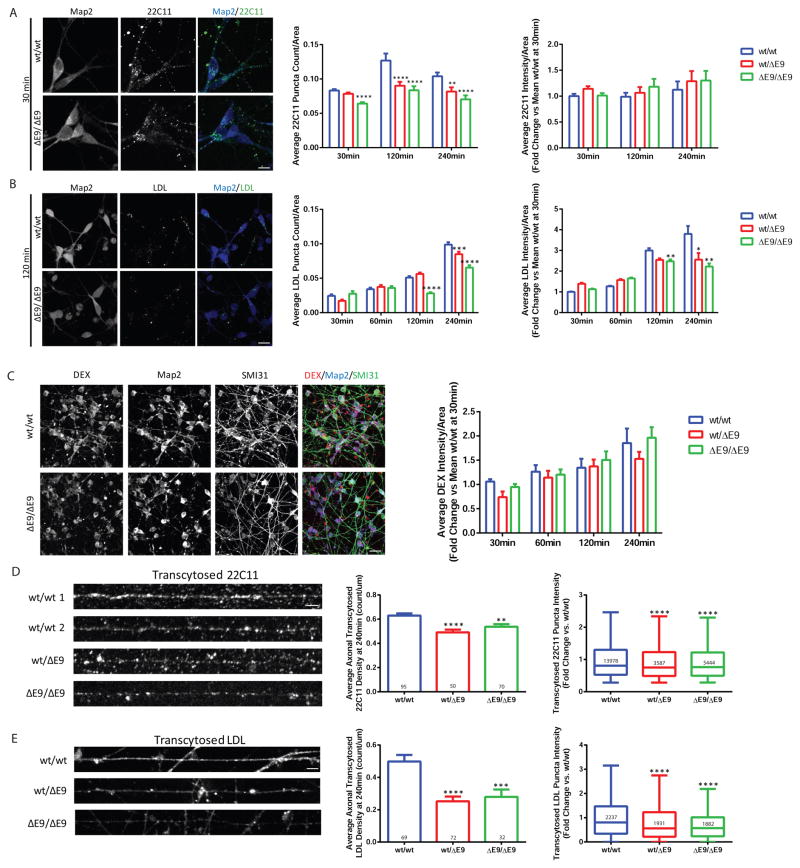
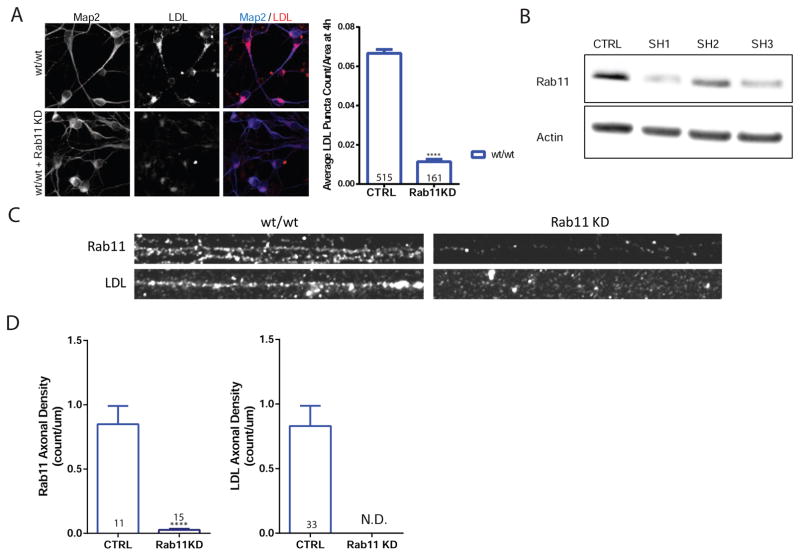
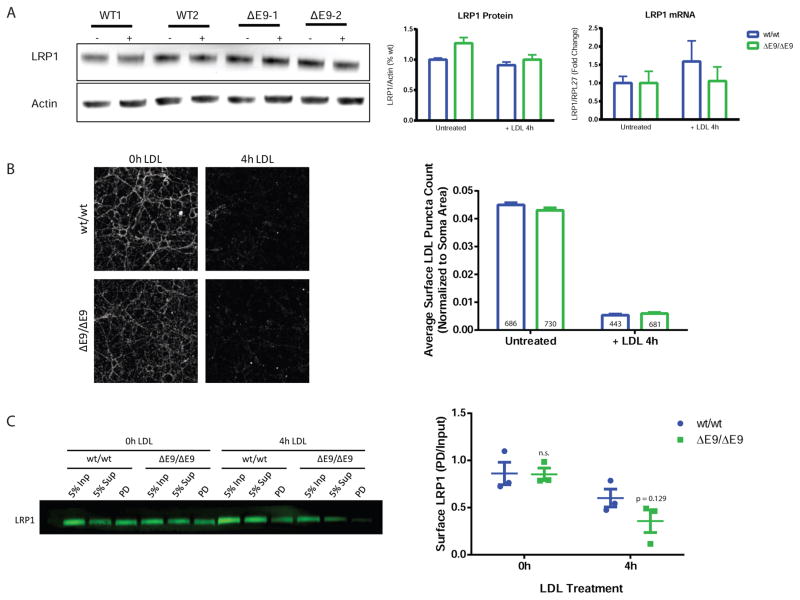
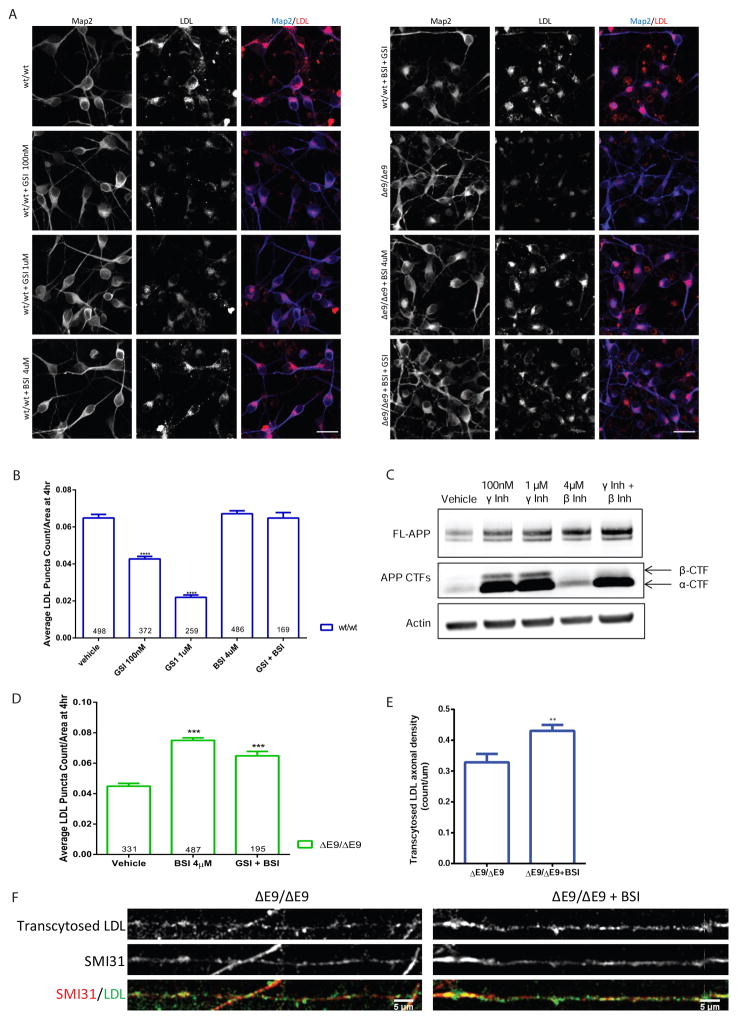
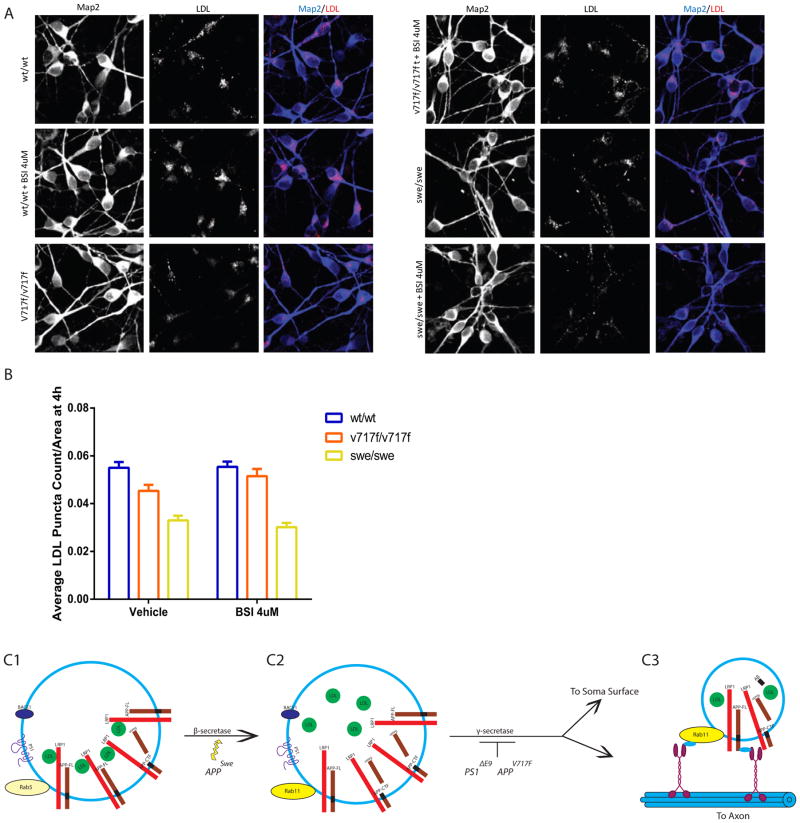
We investigated early phenotypes caused by familial Alzheimer's disease (fAD) mutations in isogenic human iPSC-derived neurons. Analysis of neurons carrying fAD PS1 or APP mutations introduced using genome editing technology at the endogenous loci revealed that fAD mutant neurons had previously unreported defects in the recycling state of endocytosis and soma-to-axon transcytosis of APP and lipoproteins. The endocytosis reduction could be rescued through treatment with a β-secretase inhibitor. Our data suggest that accumulation of β-CTFs of APP, but not Aβ, slow vesicle formation from an endocytic recycling compartment marked by the transcytotic GTPase Rab11. We confirm previous results that endocytosis is affected in AD and extend these to uncover a neuron-specific defect. Decreased lipoprotein endocytosis and transcytosis to the axon suggest that a neuron-specific impairment in endocytic axonal delivery of lipoproteins and other key materials might compromise synaptic maintenance in fAD.

Keywords: APP; Alzheimer’s disease; FAD; PS1; endocytosis; iPSC; transcytosis.


Figures

Figure 1
Figure 1. PS1ΔE9 iPSC-derived neurons exhibit altered sub-cellular distribution of APP
A) PS1ΔE9 neurons have a gene-dose dependent increase in soma APP intensity. Data are represented as mean ± SEM of all cell values with 10 PS1wt/wt, 6 PS1wt/ΔE9 and 10 PS1ΔE9/ΔE9 biological replicates. (PS1wt/ΔE9 p<0.05 and PS1ΔE9/ΔE9 p<0.0001) Scale bar = 20μm B) Surface intensity of APP is increased in PS1wt/ΔE9 and PS1ΔE9/ΔE9 (p<0.01) neurons compared to PS1wt/wt. Scale bar = 5μm C) PS1wt/wt neurons exhibited minimal APP CTF staining in unpermeabilized cells and dramatically increased NTF staining when permeabilized. Data represent the mean ± SEM from 2 immunofluorescence experiments with 2 biological replicates per control (p = 0.0262) Scale bar = 5μm D) Average density of APP (PS1wt/ΔE9 p<0.05 and PS1ΔE9/ΔE9 p<0.0001) and individual puncta intensities (PS1wt/ΔE9 p<0.0001 and PS1ΔE9/ΔE9 p<0.0001) were decreased in a gene-dose dependent manner in PS1ΔE9 axons. Data represent the pooled median values with Tukey whiskers from 3 immunofluorescence experiments representing 7 PS1wt/wt, 4 PS1wt/ΔE9 and 6 PS1ΔE9/ΔE9 biological replicates. Scale bar = 5μm E) A schematic of the microfluidic devices. F) sAPPα/β ratios in soma were not statistically different (p=0.9614), but the ratio of axonally secreted sAPPα/β was increased in PS1ΔE9/ΔE9 axons (p=0.0199). Relative amounts of secreted sAPPα and sAPPβ in PS1ΔE9/ΔE9 axons compared to PS1wt/wt. sAPPβ levels are reduced (p=0.0056), but not sAPPα levels (p=0.0540) in PS1ΔE9/ΔE9 axons. Data represent 4 PS1wt/wt and 4 PS1ΔE9/ΔE9 biological replicates. See also Figure S1.
Figure 2
Figure 2. PS1ΔE9/ΔE9 neurons exhibit altered Rab11 distribution
A) PS1wt/wt neurons exhibited distinct punctate pattern of Rab11 staining in soma, PS1ΔE9/ΔE9 neurons had a marked accumulation of Rab11 in soma (arrowheads). Quantification of staining showed that soma Rab11 intensity (PS1wt/ΔE9 p=0.3215 and PS1ΔE9/ΔE9 p<0.0001), puncta count (PS1wt/ΔE9 p=0.5876 and PS1ΔE9/ΔE9 p<0.0001), and puncta area (PS1wt/ΔE9 p=0.6791 and PS1ΔE9/ΔE9 p<0.0001) were all significantly increased in PS1ΔE9/ΔE9 neurons. Data represent the mean ± SEM or median with Tukey whiskers from 4 PS1wt/wt, 4 PS1wt/ΔE9 and 4 PS1ΔE9/ΔE9 biological replicates. Scale bar = 20μm B) Quantification of Rab11 in axons. Rab11 density (PS1wt/ΔE9 p=0.0003 and PS1ΔE9/ΔE9 p<0.0001) and puncta intensity (PS1wt/ΔE9 p<0.0001 and PS1ΔE9/ΔE9 p<0.0001) were reduced in a dose-dependent manner in PS1ΔE9 neurons. Data represent the mean ± SEM or median with Tukey whiskers of 6 PS1wt/wt, 4 PS1wt/ΔE9 and 5 PS1ΔE9/ΔE9 biological replicates. Scale bar = 5μm C) Knockdown of Rab11a diminished APP to ~60% of PS1wt/wt levels. Data represent the average of 4 untreated PS1wt/wt and 3 Rab11 shRNA-treated PS1wt/wt biological replicates. (Rab11 density p <0.0001, Rab11 intensity p <0.0001, APP density p <0.0001, APP intensity p <0.0001) D) Inhibition of soma endocytosis resulted in ~50% decrease in Rab11 density (first inset) and approximately a 20% decrease in APP density (second inset). Data represent the mean ± SEM or median with Tukey whiskers from axons of 4 untreated PS1wt/wt and 3 Rab11 shRNA-treated PS1wt/wt biological replicates. (Rab11 density p <0.0001, Rab11 intensity p <0.0001, APP density p =0.0018, APP intensity p <0.0001). See also Figure S2.
Figure 3
Figure 3. PS1 ΔE9 Neurons Exhibit Reduced Endocytosis and Transcytosis of APP and LDL
A) Example images of internalization of APP 22C11 antibody at 30 minutes in PS1wt/wt and PS1ΔE9/ΔE9 neurons. Bar graphs depict average APP puncta count and average intensity normalized to cell area at time 30min (PS1wt/ΔE9 p=0.1341 and PS1ΔE9/ΔE9 p<0.0001), 120min (PS1wt/ΔE9 p<0.0001 and PS1ΔE9/ΔE9 p<0.0001), and 240min (PS1wt/ΔE9 p=0.0024 and PS1ΔE9/ΔE9 p<0.0001). Data represent the mean ± SEM of a minimum of 50 neurons per time point from 4 PS1wt/wt, 4 PS1wt/ΔE9 and 4 PS1ΔE9/ΔE9 biological replicates. Scale bar = 10μm B) Example images of LDL-BODIPY labeling in PS1wt/wt and PS1ΔE9/ΔE9 neurons. Graphs depict quantification of LDL puncta count and intensity normalized to cell area. As shown, PS1wt/ΔE9 and PS1ΔE9/ΔE9 neurons have reduced APP and LDL soma endocytosis, with the LDL defect appearing most prominently at 240min. Puncta data represent the pooled mean ± SEM or median with Tukey whiskers of over 140 cells per time point and 4–6 biological replicates per genotype per time point. 30 min (PS1wt/ΔE9 p=0.0671 and PS1ΔE9/ΔE9 p=0.1637), 60 min (PS1wt/ΔE9 p=0.0013 and PS1ΔE9/ΔE9 p<0.0001), 120 min (PS1wt/ΔE9 p<0.0001 and PS1ΔE9/ΔE9 p<0.0001), and 240 min (PS1wt/ΔE9 p<0.0001 and PS1ΔE9/ΔE9 p<0.0001). Scale bar = 20μm C) Example images and a graph of intensity quantification are depicted for endocytosis of the fluid phase fixable marker, Dextran-TetramethylRhodamine. Data represent the mean ± SEM of soma intensities across 23–28 images per time point representing 8 PS1wt/wt, 8 PS1wt/ΔE9 and 8 PS1ΔE9/ΔE9 biological replicates. 30 min (PS1wt/ΔE9 p=0.1683 and PS1ΔE9/ΔE9 p=0.6532), 60 min (PS1wt/ΔE9 p=0.6265 and PS1ΔE9/ΔE9 p=0.8126), 120 min (PS1wt/ΔE9 p=0.9117 and PS1ΔE9/ΔE9 p=0.5285), and 240 min (PS1wt/ΔE9 p=0.1595 and PS1ΔE9/ΔE9 p=0.6465). Scale bar = 20μm D and E) Neurons were grown in microfluidic devices and then allowed to internalized either APP antibody (densities PS1wt/ΔE9 p <0.0001 and PS1ΔE9/ΔE9 p = 0.0011) or LDL-BODIPY (densities PS1wt/ΔE9 p <0.0001 and PS1ΔE9/ΔE9 p = 0.0024) on the soma side with the axons in fluidic isolation. All intensity comparisons were p<0.0001. Axons that passed through the channels were imaged and puncta densities and intensities were evaluated. Data represent the mean ± SEM of 4 PS1wt/wt, 3 PS1wt/ΔE9 and 4 PS1ΔE9/ΔE9 biological replicates per stain. Scale bar = 5μm. See also Figure S3.
Figure 4
Figure 4. Rab11 Mediates Endocytosis and Transcytosis of LDL
A) PS1wt/wt neurons were transduced with lentivirus containing control (CTRL) or Rab11 shRNA (Rab11 KD) and then treated with LDL for 4 hours. Rab11 KD data represent mean ± SEM of soma obtained from 3 biological replicates of PS1wt/wt (p <0.0001). Scale bar = 10μm B) Western blot of cells transduced with control or one of 3 different Rab11 shRNAs. C) PS1wt/wt axons and PS1wt/wt axons with Rab11 knockdown and co-stains. Scale bar = 5μm D) Vesicle densities of Rab11 and LDL, under control and Rab11 knockdown conditions. For LDL density graph, Rab11 knockdown (KD) resulted in non-detectable (N.D.) levels of axonal LDL. Puncta seen in Rab11 KD were the result of background auto fluorescence. LDL transyctosis data represent the mean ± SEM of 3 biological replicates. See also Figure S4.
Figure 5
Figure 5. PS1ΔE9 Impairs Recycling of LRP1
A) LRP1 protein and mRNA levels were measured before and after 4 hours of LDL treatment. PS1ΔE9 LRP1 protein were not different without (p = 0.1064) and with 4h LDL treatment (p = 0.4395). Nor were PS1ΔE9 LRP1 mRNA levels in untreated (p = 1.0) and 4h LDL-treated neurons (p = 0.4627). Data represent mean ± SEM of 4 biological replicates. B) Surface LDL levels were not different in PS1ΔE9 neurons after 4h of LDL treatment (p = 0.5793). Data represent mean ± SEM of soma values from 12 PS1wt/wt, 12 PS1wt/ΔE9 and 12 PS1ΔE9/ΔE9 biological replicates. Scale bar = 20μm C) PS1ΔE9/ΔE9 LRP1 surface levels, identified in the pull-down (PD) lane, were not different at baseline, but trended to lower compared to PS1wt/wt after 4 hours LDL treatment, though results did not reach significance (p = 0.129) Whiskers depict mean ± SEM of 3 biological replicates per condition. See also Figure S5.
Figure 6
Figure 6. LDL Endocytosis Defects in PS1ΔE9 Neurons are Rescued by β-Secretase Inhibition
A) Example images from drug-treated PS1wt/wt, PS1wt/ΔE9 and PS1ΔE9/ΔE9 neurons. Scale bar = 20μm B) Quantification of LDL puncta count per soma in 4 hour LDL-treated PS1wt/wt neurons. Treatment with a γ-secretase inhibitor (GSI) resulted in a decrease in LDL endocytosis in PS1wt/wt neurons, while treatment with a β-secretase inhibitor (BSI) had no effect. Data represent the mean ± SEM 12 PS1wt/wt, 6 GSI 100nM (p <0.0001), 6 GSI 1uM (p <0.0001), 12 BSI 4uM (n.s.), and 4 GSI 1uM + BSI 4uM (n.s) biological replicates. C) Example Western blot of neurons treated with β- and γ-secretase inhibitors. α-CTFs and β-CTFs are indicated by arrows. D) Quantification of LDL endocytosis in PS1 ΔE9/ΔE9 neurons treated with inhibitors. N= 10 PS1ΔE9/ΔE9 for VEH, 12 12 PS1 ΔE9/ΔE9 for BSI, and 4 PS1ΔE9/ΔE9 for 4uM BSI + 1uM GSI biological replicates (*** p<0.0001 compared to vehicle). E) Quantification of LDL transcytosis in PS1 ΔE9/ΔE9 under control and β-secretase inhibition. Treatment with 4uM of BSI increased levels of transcytosed, axonal LDL compared to untreated PS1ΔE9/ΔE9 from an average density of ~0.33 count/um to ~0.43 count/um (p = 0.0044). F) Example images of PS1 ΔE9/ΔE9 axons with and without β-secretase inhibition after 4 hours of LDL transcytosis. Axons were co-stained with the axonal marker SMI31 for neurofilament-H.
Figure 7
Figure 7. LDL Endocytosis Defects are Common to Other fAD Mutations
A) Representative images of LDL uptake in APPv717f and APPswe neurons and co-stained with the somatodendritic marker Map2. Scale bar = 20μm B) Quantification of LDL puncta count after 4 hours of LDL treatment in APPwt/wt, APPV717F/V717F, and APPswe/swe neurons with vehicle and 4uM BSI treatment demonstrates that APP mutations also result in decreased LDL uptake (APPV717F/V717F p = 0.0009, APPswe/swe p<.0001), which is rescued with BSI treatment in APPV717F (APPV717F/V717F p = 0.5545) but not APPswe. Data represent the mean ± SEM of 6 APPwt/wt, 3 APPV717F/V717F and 3 APPswe/swe biological replicates. C) Model of APP and lipoprotein transcytosis in neurons. C1) FL-APP is internalized in Rab5+ sorting endosomes that contain LDL associated with LRP1 as well as β-secretase (BACE1) and possibly PS1. C2) As vesicles become more acidic along the endocytic pathway, LDL dissociates from LRP1 and FL-APP gets cleaved by β-secretase. A proportion of the cleaved APP population resides in Rab11+ endosomes containing LRP1, β-CTF and LDL. C3) When β-CTF gets cleaved by γ-secretase, LRP1 can be recycled back to cell surface and transcytosis of LDL and FL-APP to the axon can occur. fAD mutations increase β-CTFs either by enhancing β-Secretase processing or impairing γ-secretase-mediated cleavage of APP. β-CTFs impair recycling of LRP1 and decrease transcytosis of APP and lipoproteins, possibly by directly sequestering LRP1 in a Rab11+ endosome. See also Figure S6.

Similar articles

Cited by

References

    1. Anderson E, Maday S, Sfakianos J, Hull M, Winckler B, Sheff D, Fölsch H, Mellman I. Transcytosis of NgCAM in epithelial cells reflects differential signal recognition on the endocytic and secretory pathways. J Cell Biol. 2005;170:595–605. - PMC - PubMed
    1. Anthony SM, Granick S. Image analysis with rapid and accurate two-dimensional Gaussian fitting. Langmuir. 2009;25:8152–8160. - PubMed
    1. Antonell A, Lladó A, Altirriba J, Botta-Orfila T, Balasa M, Fernández M, Ferrer I, Sánchez-Valle R, Molinuevo JL. A preliminary study of the whole- genome expression profile of sporadic and monogenic early-onset Alzheimer’s disease. Neurobiol Aging. 2013;34:1772–1778. - PubMed
    1. Arold S, Sullivan P, Bilousova T, Teng E, Miller CA, Poon WW, Vinters HV, Cornwell LB, Saing T, Cole GM, et al. Apolipoprotein e level and cholesterol are associated with reduced synaptic amyloid beta in Alzheimer’s disease and apoE TR mouse cortex. Acta Neuropathol. 2012;123:39–52. - PMC - PubMed
    1. Ascaño M, Richmond A, Borden P, Kuruvilla R. Axonal targeting of Trk receptors via transcytosis regulates sensitivity to neurotrophin responses. J Neurosci. 2009;29:11674–11685. - PMC - PubMed

Publication types

MeSH terms