Optimized Collection Protocol for Plasma MicroRNA Measurement in Patients with Cardiovascular Disease
- PMID: 27725938
- PMCID: PMC5048034
- DOI: 10.1155/2016/2901938
Optimized Collection Protocol for Plasma MicroRNA Measurement in Patients with Cardiovascular Disease
Abstract
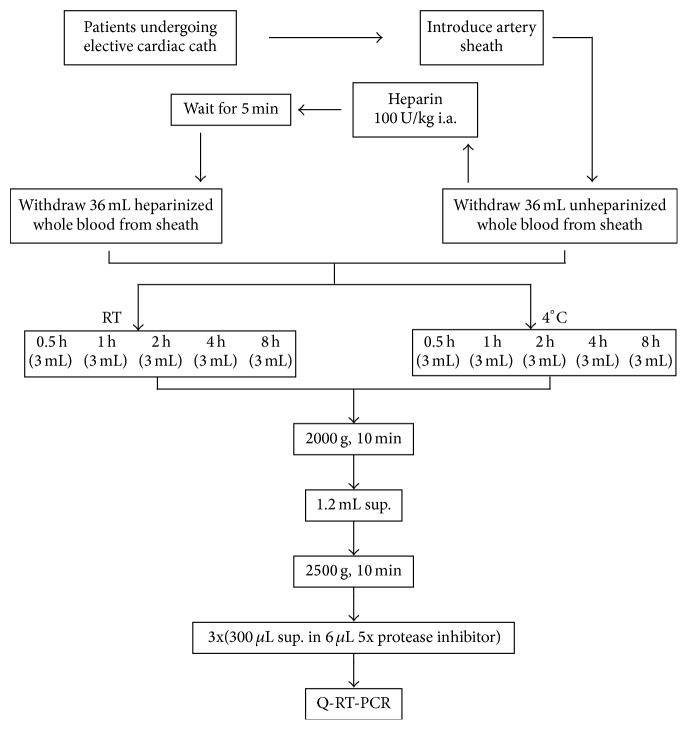
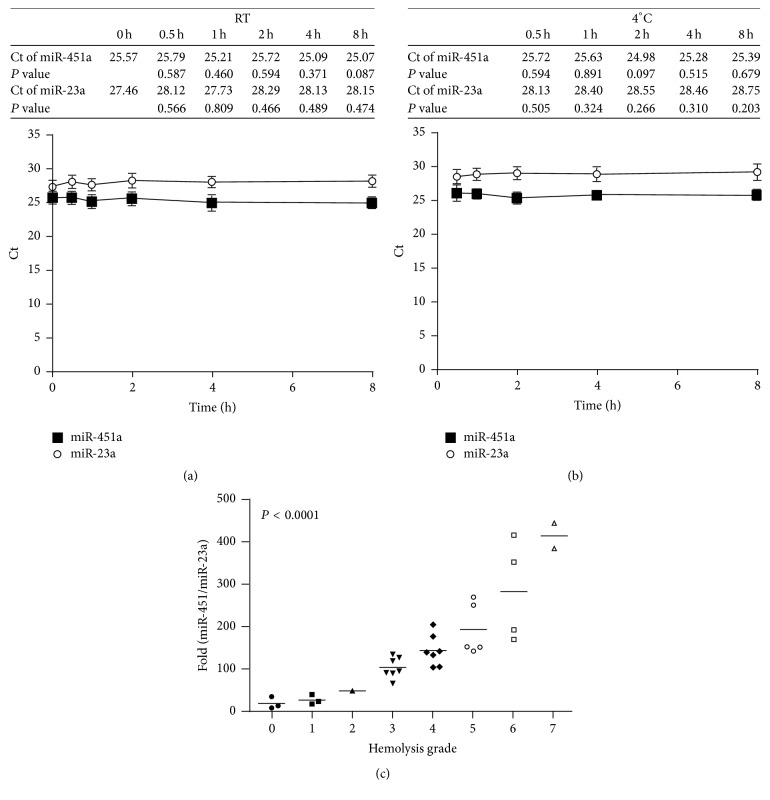
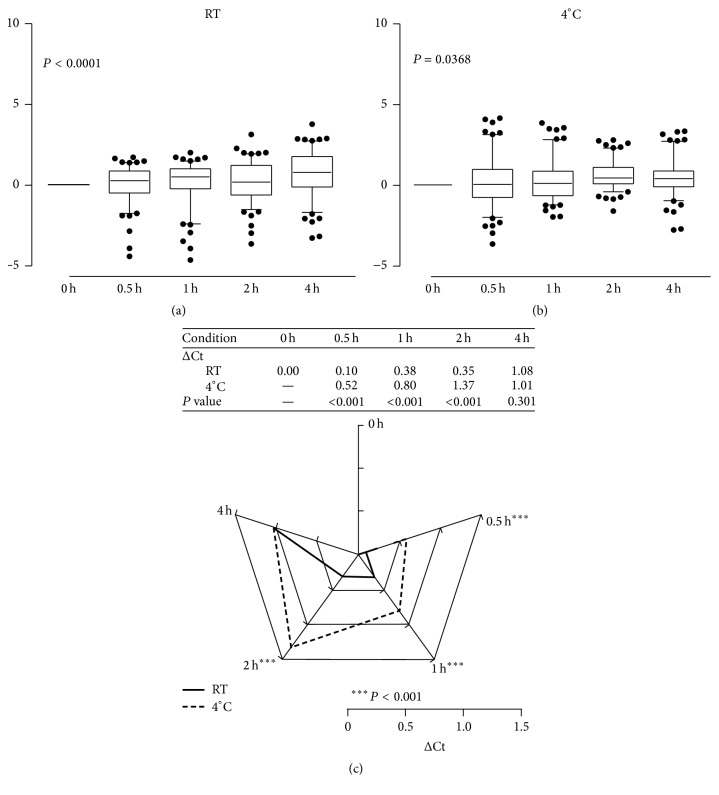
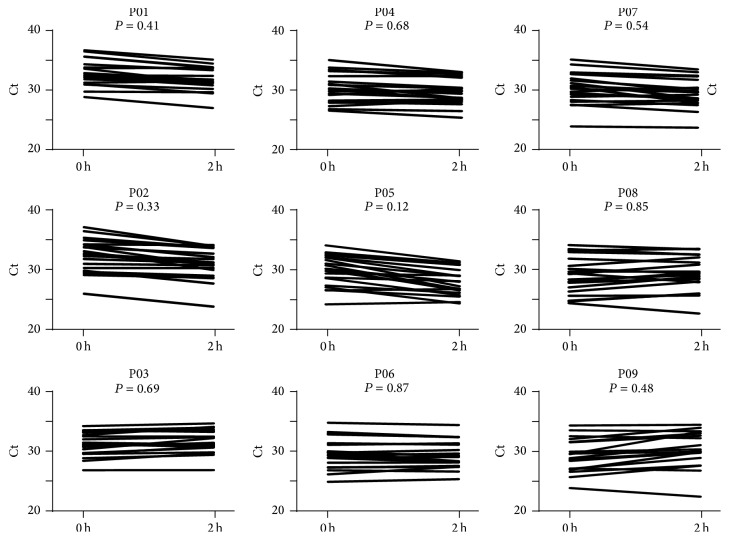
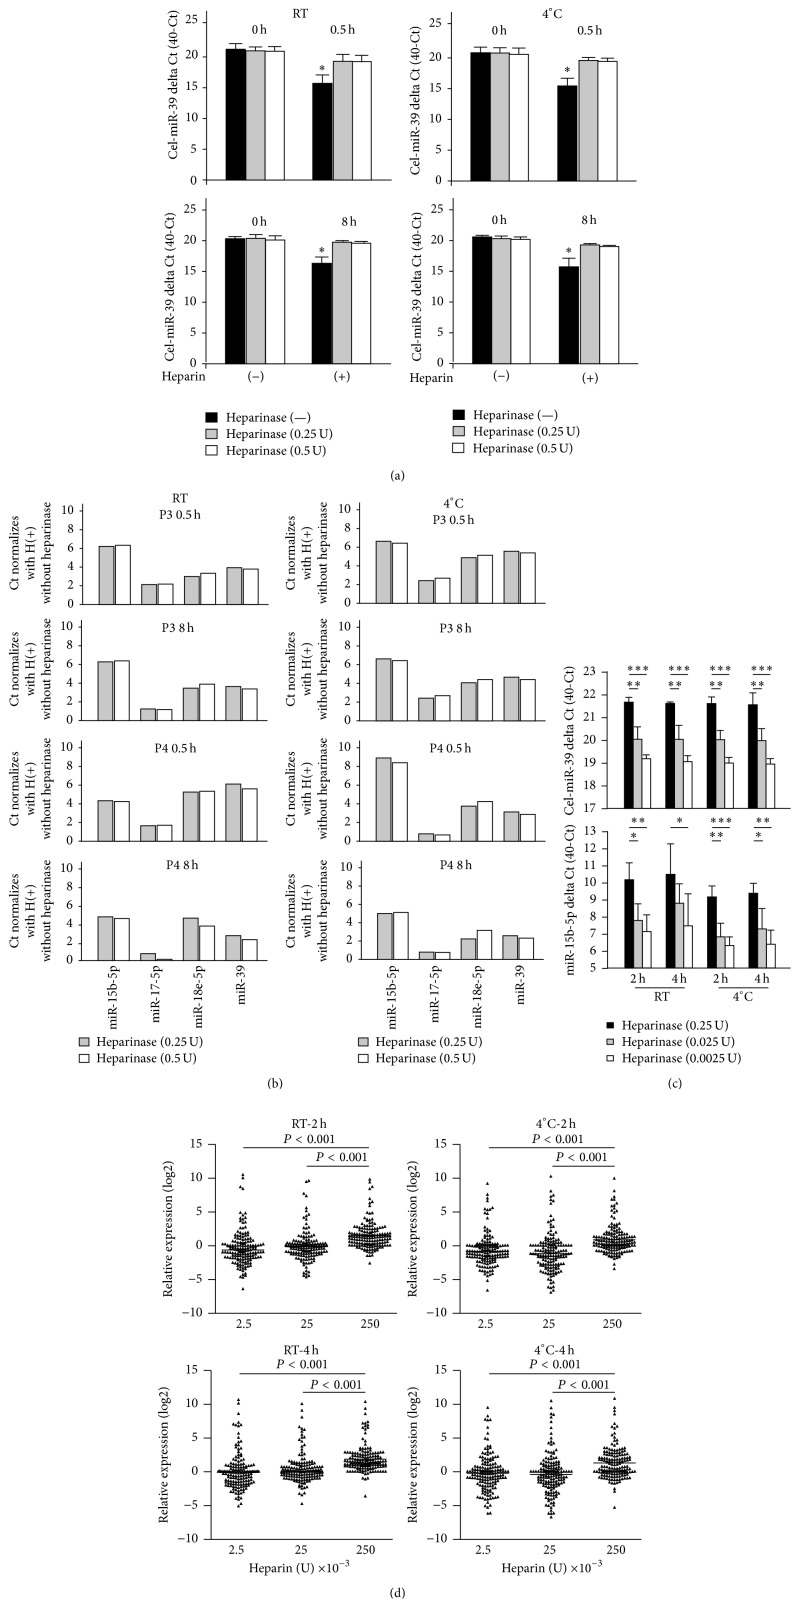
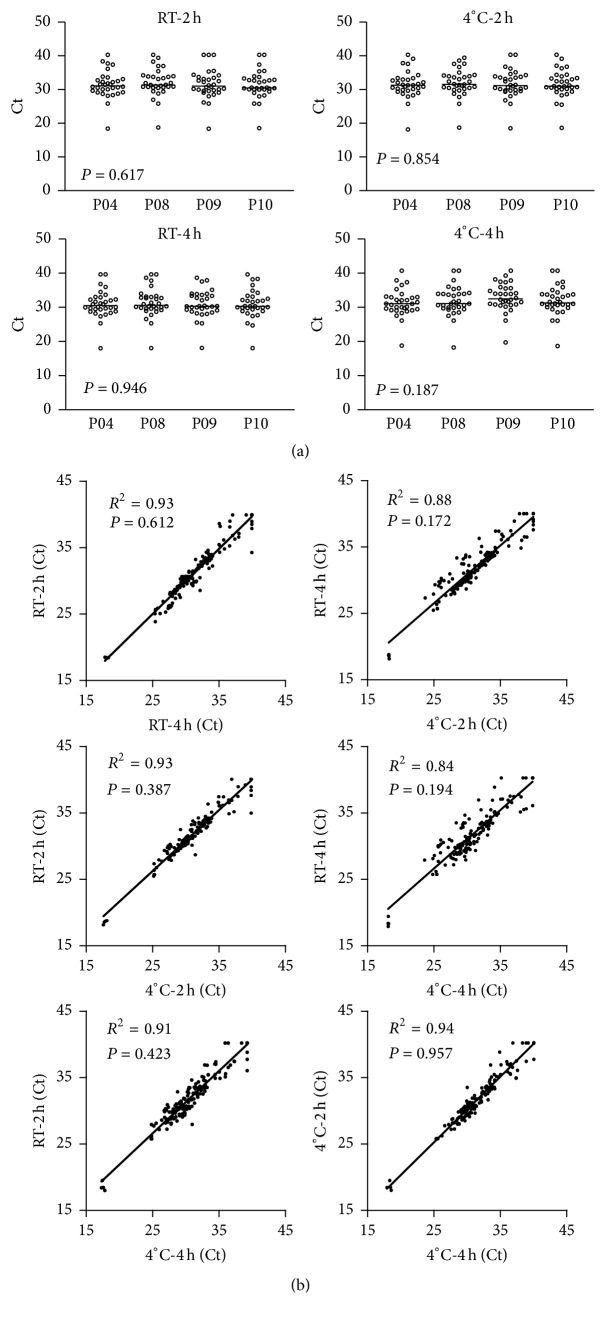
Background. Various microRNAs (miRNAs) are used as markers of acute coronary syndrome, in which heparinization is considered mandatory therapy. Nevertheless, a standard method of handling plasma samples has not been proposed, and the effects of heparin treatment on miRNA detection are rarely discussed. Materials and Method. This study used quantitative polymerase chain reaction (qPCR) analysis to investigate how storage temperature, standby time, hemolysis, and heparin treatment affect miRNA measurement in plasma samples from 25 patients undergoing cardiac catheterization. Results. For most miRNAs, the qPCR results remained consistent during the first 2 hours. The miRNA signals did not significantly differ between samples stored at 4°C before processing and samples stored at room temperature (RT) before processing. miR-451a/miR-23a ratio < 60 indicated < 0.12% hemolysis with 100% sensitivity and 100% specificity. Pretreatment with 0.25 U heparinase I recovered qPCR signals that were reduced by in vivo heparinization. Conclusions. For miRNA measurement, blood samples stored at RT should be processed into plasma within 2 hours after withdrawal and should be pretreated with 0.25 U heparinase I to overcome heparin-attenuated miRNA signals. The miR-451a/miR-23a ratio is a reliable indicator of significant hemolysis.
Conflict of interest statement
No author has any commercial associations or interests in this research, including consultancies, stock ownership, or other competing equity interests or patent-licensing arrangements.
Figures
Similar articles
-
Comparison of Methodologies to Detect Low Levels of Hemolysis in Serum for Accurate Assessment of Serum microRNAs.PLoS One. 2016 Apr 7;11(4):e0153200. doi: 10.1371/journal.pone.0153200. eCollection 2016. PLoS One. 2016. PMID: 27054342 Free PMC article.
-
Overcoming Heparin-Associated RT-qPCR Inhibition and Normalization Issues for microRNA Quantification in Patients with Acute Myocardial Infarction.Thromb Haemost. 2018 Jul;118(7):1257-1269. doi: 10.1055/s-0038-1660437. Epub 2018 Jun 11. Thromb Haemost. 2018. PMID: 29890520
-
Impact of Delayed Whole Blood Processing Time on Plasma Levels of miR- 1 and miR-423-5p up to 24 Hours.Microrna. 2018;7(2):115-119. doi: 10.2174/2211536607666180322093119. Microrna. 2018. PMID: 29564990
-
Impact of Anticoagulation and Sample Processing on the Quantification of Human Blood-Derived microRNA Signatures.Cells. 2020 Aug 18;9(8):1915. doi: 10.3390/cells9081915. Cells. 2020. PMID: 32824700 Free PMC article.
-
Variability in, variability out: best practice recommendations to standardize pre-analytical variables in the detection of circulating and tissue microRNAs.Clin Chem Lab Med. 2017 May 1;55(5):608-621. doi: 10.1515/cclm-2016-0471. Clin Chem Lab Med. 2017. PMID: 28306519 Review.
Cited by
-
Pre-Analytical Modification of Serum miRNAs: Diagnostic Reliability of Serum miRNAs in Hemolytic Diseases.J Clin Med. 2021 Oct 28;10(21):5045. doi: 10.3390/jcm10215045. J Clin Med. 2021. PMID: 34768564 Free PMC article.
-
A circulating miRNA signature for early diagnosis of acute kidney injury following acute myocardial infarction.J Transl Med. 2019 Apr 30;17(1):139. doi: 10.1186/s12967-019-1890-7. J Transl Med. 2019. PMID: 31039814 Free PMC article.
-
Multiple cancer type classification by small RNA expression profiles with plasma samples from multiple facilities.Cancer Sci. 2022 Jun;113(6):2144-2166. doi: 10.1111/cas.15309. Epub 2022 Mar 14. Cancer Sci. 2022. PMID: 35218669 Free PMC article.
-
Circulating microRNAs as Diagnostic Markers in Primary Aldosteronism.Cancers (Basel). 2021 Oct 22;13(21):5312. doi: 10.3390/cancers13215312. Cancers (Basel). 2021. PMID: 34771478 Free PMC article. Review.
-
Circulating MicroRNAs as Potential Biomarkers of Atrial Fibrillation.Biomed Res Int. 2017;2017:7804763. doi: 10.1155/2017/7804763. Epub 2017 Mar 2. Biomed Res Int. 2017. PMID: 28349066 Free PMC article. Review.
References
-
- Jousilahti P., Vartiainen E., Tuomilehto J., Puska P. Sex, age, cardiovascular risk factors, and coronary heart disease: a prospective follow-up study of 14 786 middle-aged men and women in Finland. Circulation. 1999;99(9):1165–1172. - PubMed
-
- Gueyffier F., Boissel J. P., Pocock S., et al. Identification of risk factors in hypertensive patients: contribution of randomized controlled trials through an individual patient database. Circulation. 1999;100(18):e88–e94. - PubMed
MeSH terms
Substances
LinkOut - more resources
Full Text Sources
Other Literature Sources
Miscellaneous