. 2017 Feb 15;595(4):1223-1238.
doi: 10.1113/JP273115. Epub 2016 Dec 2.

Synaptic vesicle pool-specific modification of neurotransmitter release by intravesicular free radical generation

Affiliations

Synaptic vesicle pool-specific modification of neurotransmitter release by intravesicular free radical generation

Olusoji A T Afuwape et al. J Physiol. .

Abstract

Key points: Synaptic transmission is mediated by the release of neurotransmitters from synaptic vesicles in response to stimulation or through the spontaneous fusion of a synaptic vesicle with the presynaptic plasma membrane. There is growing evidence that synaptic vesicles undergoing spontaneous fusion versus those fusing in response to stimuli are functionally distinct. In this study, we acutely probe the effects of intravesicular free radical generation on synaptic vesicles that fuse spontaneously or in response to stimuli. By targeting vesicles that preferentially release spontaneously, we can dissociate the effects of intravesicular free radical generation on spontaneous neurotransmission from evoked neurotransmission and vice versa. Taken together, these results further advance our knowledge of the synapse and the nature of the different synaptic vesicle pools mediating neurotransmission.

Abstract: Earlier studies suggest that spontaneous and evoked neurotransmitter release processes are maintained by synaptic vesicles which are segregated into functionally distinct pools. However, direct interrogation of the link between this putative synaptic vesicle pool heterogeneity and neurotransmission has been difficult. To examine this link, we tagged vesicles with horseradish peroxidase (HRP) - a haem-containing plant enzyme - or antibodies against synaptotagmin-1 (syt1). Filling recycling vesicles in hippocampal neurons with HRP and subsequent treatment with hydrogen peroxide (H2 O2 ) modified the properties of neurotransmitter release depending on the route of HRP uptake. While strong depolarization-induced uptake of HRP suppressed evoked release and augmented spontaneous release, HRP uptake during mild activity selectively impaired evoked release, whereas HRP uptake at rest solely potentiated spontaneous release. Expression of a luminal HRP-tagged syt1 construct and subsequent H2 O2 application resulted in a similar increase in spontaneous release and suppression as well as desynchronization of evoked release, recapitulating the canonical syt1 loss-of-function phenotype. An antibody targeting the luminal domain of syt1, on the other hand, showed that augmentation of spontaneous release and suppression of evoked release phenotypes are dissociable depending on whether the antibody uptake occurred at rest or during depolarization. Taken together, these findings indicate that vesicles that maintain spontaneous and evoked neurotransmitter release preserve their identity during recycling and syt1 function in suppression of spontaneous neurotransmission can be acutely dissociated from syt1 function to synchronize synaptic vesicle exocytosis upon stimulation.

Keywords: spontaneous neurotransmitter release; synaptic vesicle recycling; synaptotagmin.


Figures

Figure 1
Figure 1. Optical analysis of spontaneous vesicle fusion from recycling pool and spontaneously fusing vesicles
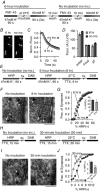
A–D, recycling pool vesicles begin to fuse spontaneously after 6 h at physiological temperatures. A, diagram of the protocol for FM1‐43 uptake and the release of dye after a 6‐h incubation at 37°C in the absence of action potentials (using tetrodotoxin, TTX) (left) and the following uptake and release without incubation in the same synapses (right). B, fluorescence images before dye release after incubating for 6 h (left) and the following initial fluorescence in the same boutons after washing for only 10 min (right). C, summary plot of the average rate of fluorescence lost during stimulation depicting no change in the rate of dye release from boutons incubated 6 h after FM1‐43 uptake and the subsequent rate in the same synapses without incubating (two‐way repeated measures (RM) ANOVA, F (1,2) = 0.8642, P = 0.4507). D, quantity of the average fluorescence before (initial) and after (final) dye release along with amount of dye released (ΔF, initial minus final) showing a non‐significant decrease in the quantity of dye released after a 6‐h incubation (1.1‐fold, two‐way RM ANOVA, F (1,2) = 2.509, P = 0.2540) compared to the amount of dye released from the recycling pool of the same synapse (180 boutons total from n = 3 coverslips; A.U., arbitrary fluorescence units; scale bar in B = 2 μm). E–G, quantification of spontaneous fusion of recycling pool vesicles over 6 h at physiological temperature. E, diagram depicting the experimental protocol: briefly, hippocampal cultures were depolarized in the presence of HRP to label the recycling pool with HRP. Neurons were then washed and fixed or washed and incubated for 6 h at 37°C before fixing. Vesicles containing HRP were then visualized by electron microscopy after reacting HRP with DAB creating an electron dense material in HRP‐containing vesicles. F, representative electron micrograph images. Scale bar in F = 200 nm. G, cumulative histogram of the percentage of HRP‐positive (HRP+) vesicles per synapse in cultures maximally loaded with HRP with or without a 6‐h incubation. The average percentage of HRP+ vesicles are represented in the inset graph. These plots depict an 18% decrease in the percentage of HRP+ vesicles per synapse in cultures incubated for 6 h, which indicates that 18% of recycling pool vesicles fuse spontaneously over 6 h. (n, number of synapses analysed from 3 coverslips each; no inc. n = 56, 6 h inc. n = 57, t test(111) = 2.372, * P = 0.0194.) H–J, spontaneous fusion of spontaneously fusing vesicles over 30 min. H, diagram of the experiment. Briefly, dissociated hippocampal cultures were incubated in HRP with TTX and either immediately washed and fixed or incubated for 30 min in TTX before fixing. Cultures were treated with DAB to react with HRP making an electron dense substance and then synapses were imaged by electron microscopy. I, representative images. J, cumulative histogram of the percentage of HRP‐positive (HRP+) vesicles per synapse in cultures that were fixed immediately or 30 min after spontaneous labeling with HRP. The inset plot depicts the average percentage of HRP+ vesicles. These graphs depict a 50% loss in the percentage of HRP+ vesicles per synapse in cultures incubated for 30 min before fixing. (n, number of synapses analysed from 3 coverslips each; no inc. n = 61, 30 min inc. n = 61, t (120) = 5.156, ** P <  0.0001.) Error bars represent the SEM. Scale bar in I = 200 nm.
Figure 2
Figure 2. Reciprocal effect of chemical modification of recycling vesicles on spontaneous and Ca2+‐dependent fusing vesicles
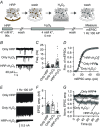
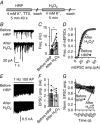
A, diagram of the experiment: hippocampal neurons were depolarized with a high K+ buffer containing HRP for 90 s, washed, perfused with H2O2 and then patched to record spontaneous and evoked synaptic currents (mEPSCs and EPSCs, HRP + H2O2). As a control (diagram not shown), neurons were also treated with either HRP or H2O2 alone by omitting HRP from the high K+ buffer (Only HRP) or H2O2 from the 5 min perfusion (Only H2O2). B–D, mEPSC frequency and amplitudes from control and treated neurons (Only HRP, n = 39; Only H2O2, n = 23; HRP + H2O2, n = 40). B, representative mEPSC recordings. C, plot summarizing the average frequency of mEPSCs with each treatment (Kruskal–Wallis, H (2,99) = 41.05, P < 0.0001; Dunn's post hoc, * P < 0.0001). D, average cumulative distribution of mEPSC amplitudes (two‐way RM ANOVA, F (2,106) = 0.05919, P = 0.9426). E–G, EPSC amplitudes with and without treatment with both HRP and H2O2 (Only HRP, n = 22; Only H2O2, n = 13; HRP + H2O2, n = 17). E, representative traces of the first 40 ms of EPSCs recorded during 1 Hz train of 100 APs. F, summary graph of the average maximum EPSC amplitude showing an approximately 4‐fold decrease in amplitude in treated neurons compared to controls (Kruskal–Wallis, H (2,49) = 25.84, P < 0.0001, Dunn's post hoc, * P < 0.0001). G, plot of the average EPSC amplitude normalized to the first response of 100 stimuli at 1 Hz. After treatment with both HRP and H2O2, EPSC amplitudes decreased faster compared to the controls (ordinary two‐way ANOVA, F (2,3349) = 807.4, P < 0.0001; Sidak's post hoc, ** P < 0.002). Error bars represent the SEM. [Colour figure can be viewed at wileyonlinelibrary.com]
Figure 3
Figure 3. Free radical acceptor, ascorbic acid, blocks the defects in neurotransmission observed after H2O2 perfusion of synapses containing HRP labelled vesicles
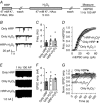
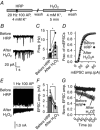
A, diagram of the experiment: hippocampal neurons were depolarized with a high K+ buffer containing HRP and ascorbic acid (HAsc) for 90 s. HRP was washed out for 10 min, and H2O2 was perfused for 5 min then washed out for another 10 min. Neurons were patched and mEPSCs and EPSCs were recorded (HRP + H2O2). Control experiments (diagram not shown) were performed by omitting the HRP from the high K+ buffer (Only HRP) or H2O2 from the 5‐min perfusion (Only H2O2). B–D, mEPSC frequency and amplitudes before and after treatment (n, number of patched neurons; Only HRP, n = 12; Only H2O2, n = 7; HRP + H2O2, n = 9). B, representative mEPSC recordings. C, plot summarizing the average frequency of mEPSCs showing that the average frequency did not differ between groups (Kruskal–Wallis, H (2,25) = 4.452, P = 0.1079). D, distribution of mEPSC amplitudes showing no significant difference between groups (two‐way RM ANOVA, F (3,37) = 0.3939, P = 0.7581). E–G, EPSC amplitudes of control and experimental treatment (n, number of patched neurons; Only HRP, n = 4; Only H2O2, n = 4; HRP + H2O2, n = 5). E, representative traces of the first 40 ms of EPSCs recorded during a 1 Hz train of 100 APs. F, summary graph of the average maximum EPSC amplitude showing no change in amplitude after treatment (one‐way ANOVA, F (2,10) = 0.5380, P = 0.5999). G, plot of EPSC amplitude per AP normalized to the first response. After HRP uptake with HAsc and H2O2 perfusion, the rate of change of EPSC amplitudes was unchanged compared to control treatments (two‐way RM ANOVA, F (2,10) = 0.06903, P = 0.9337). Error bars represent the SEM.
Figure 4
Figure 4. Free radical modification of vesicles that are mobilized during 1 Hz stimulation decreases evoked EPSC amplitudes without affecting spontaneous neurotransmission
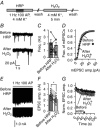
A, diagram of the experiment: a hippocampal neuron was first patched, and mEPSCs and EPSCs were recorded (Before HRP). HRP was perfused and the neurons were stimulated with a 1 Hz train of 100 APs (1 min 40 s). After incubating for another 2 min, HRP was washed out for 10 min. H2O2 was perfused for 5 min and washed out for another 10 min. Then mEPSCs and EPSCs were recorded again from the same neuron (After H2O2). B–D, mEPSC frequency and amplitudes before and after treatment. B, representative mEPSC recordings before HRP and after H2O2. C, plot summarizing the average frequency of mEPSCs before and after treatment (values from the same neurons are connected). The average frequency did not significantly change after treatment (paired t test, t (9) = 0.8823, P = 0.4006. D, distribution of mEPSC amplitudes showing no significant difference between groups (two‐way RM ANOVA, F (1,9) = 0.0698, P = 0.7976). E–G, EPSC amplitudes before HRP and after H2O2. E, representative traces of the first 40 ms of EPSCs recorded during a 1 Hz train of 100 APs. F, summary graph of the average maximum EPSC amplitude showing a 1.5‐fold decrease in amplitude after treatment (values from the same neurons are connected, t (9) = 14.86, P = 0.0004). G, plot of EPSC amplitude per AP normalized to the first response before HRP and after H2O2. After H2O2, the rate of decrease in EPSC amplitude was unchanged when compared to the rate of change before HRP (two‐way RM ANOVA, F (1,9) = 1.108, P = 0.3200). Error bars represent the SEM (n = 10).
Figure 5
Figure 5. Chemical modification of spontaneously recycling vesicles enhances spontaneous neurotransmission without affecting evoked neurotransmission
A, diagram of the experiment: a hippocampal neuron was first patched, and mEPSCs and EPSCs were recorded (Before HRP). HRP was perfused with TTX and incubated for 5 min 40 s. HRP was washed out for 10 min, and then H2O2 was perfused for 5 min and again washed out for 10 min. Then mEPSCs and EPSCs were recorded again from the same neuron (After H2O2). B–D, mEPSC frequency and amplitudes before and after treatment. B, representative mEPSC recordings before HRP and after H2O2. C, plot summarizing the average frequency of mEPSCs before and after treatment (values from the same neurons are connected). The average frequency increased 2.2‐fold after treatment (paired t test, t (5) = 3.197, * P = 0.0117). D, distribution of mEPSC amplitudes showing no significant difference between groups (two‐way RM ANOVA, F (1,5) = 1.308, P = 0.3046). E–G, EPSC amplitudes before HRP and after H2O2. E, representative traces of the first 40 ms of EPSCs recorded during 1 Hz train of 100 APs. F, summary graph of the average maximum EPSC amplitude showing no change in amplitude after treatment (values from the same neurons are connected, paired t test, t (5) = 1.138, P = 0.3065). G, plot of EPSC amplitude per AP normalized to the first response before HRP and after H2O2. After H2O2, the rate of decrease in EPSC amplitude was unchanged when compared to the rate of change before HRP (two‐way RM ANOVA, F (1,5) = 0.09709, P = 0.7679. Error bars represent the SEM (n = 6).
Figure 6
Figure 6. Chemical modification of vesicles fusing at a high frequency stimulation decreases Ca2+‐dependent neurotransmission and enhances spontaneous fusion
A, diagram of the experiment: a hippocampal neuron was first patched, and mEPSCs and EPSCs were recorded (Before HRP). HRP was perfused and the neurons were stimulated with a 20 Hz train of 100 AP (5 s). After incubating for another 2 min, HRP was washed out for 10 min. H2O2 was perfused for 5 min and washed out for another 10 min. Then mEPSCs and EPSCs were recorded again from the same neuron (After H2O2). B–D, mEPSC frequency and amplitudes before and after treatment. B, representative mEPSC recordings before HRP and after H2O2. C, plot summarizing the average frequency of mEPSCs before and after treatment (values from the same neurons are connected). The average frequency increased 2.7‐fold after chemical modification (paired t test, t (6) = 4.044, * P = 0.0007). D, average cumulative distribution of mEPSC amplitudes showing no significant difference between groups (two‐way RM ANOVA, F (1,6) = 1.247, P = 0.3069). E–G, EPSC amplitudes before HRP and after H2O2. E, representative traces of the first 40 ms of EPSCs recorded during a 1 Hz train of 100 APs. F, summary graph of the average maximum EPSC amplitude showing a 2.2‐fold decrease in amplitude after treatment (values from the same neurons are connected; paired t test, t (6) = 6.357, * P = 0.0007). G, plot of EPSC amplitude per AP normalized to the first response before HRP and after H2O2. After H2O2, EPSC amplitudes decreased faster compared to the rate of amplitude change before HRP (two‐way RM ANOVA, F (1,6) = 12.44, P = 0.0124). Error bars represent the SEM (n = 7).
Figure 7
Figure 7. Acute chemo‐genetic impairment of synaptotagmin‐1
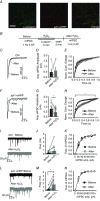
A, immunostaining of endogenous synapsin (green) and visualizing syt1‐eHRP (red) using a TSA kit in neurons infected with lentivirus expressing the syt1‐eHRP plasmid. Right, merge of both images. B, diagram of experiment: a hippocampal neuron was patched and either mIPSC or eIPSC (evoked by 5 pulses at a 1 Hz frequency) recordings were taken before and after a 5 min H2O2 treatment with a 2 min washout period. C, representative traces of the 1st AP before (black) and after (grey) H2O2 treatment in control neurons. D, summary graph of the average IPSC amplitude in control neurons before (black) and after (grey) H2O2 treatment (paired t test; t (6) = 0.3966; n = 7; P = 0.7053). E, normalized charge transfer plot for the average IPSC over 1 s in control neurons before (black) and after (white) H2O2 treatment (two‐way RM ANOVA; F (1,6) = 0.3415; P = 0.5803). F, representative traces of the 1st AP before (black) and after (grey) H2O2 treatment in syt1‐eHRP neurons. G, summary graph of the average IPSC amplitude in syt1‐eHRP neurons before (black) and after (grey) H2O2 treatment (paired t test; t (12) = 2.210; n = 13; P = 0.0472). H, normalized charge transfer plot for the average IPSC over 1 s in syt1‐eHRP neurons before (black) and after (white) H2O2 treatment (two‐way RM ANOVA; F (1,12) = 11.70; P = 0.0051). I, representative mIPSC recordings from control neurons before (black) and after (grey) H2O2 treatment. J, summary graph of the average mIPSC frequency in control neurons before (black) and after (grey) H2O2 treatment (values from the same neurons are connected) (paired t test; t (11) = 1.500; n = 12; P = 0.1617). K, distribution of mIPSC amplitudes from control neurons before and after H2O2 treatment (two‐way RM ANOVA; F (1,11) = 0.4623; P = 0.5106). L, representative mIPSC recordings from syt1‐eHRP neurons before (black) and after (grey) H2O2 treatment. M, summary graph of the average mIPSC frequency in syt1‐eHRP neurons before (black) and after (grey) H2O2 treatment (values from the same neurons are connected) (paired t test; t (9) = 3.060; n = 10; P = 0.0136). N, distribution of mIPSC amplitudes from syt1‐eHRP neurons before and after H2O2 treatment (two‐way RM ANOVA; F (1,9) = 0.1717; P = 0.6883). Scale bar, 30 μm. [Colour figure can be viewed at wileyonlinelibrary.com]
Figure 8
Figure 8. Synaptotagmin‐1 luminal domain antibody acutely disrupts synaptotagmin‐1 function
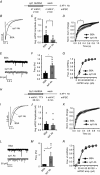
A, diagram of experiment: neurons were incubated in either 1% syt1 lumen antibody or 3% BSA–47 mm modified Tyrode solution for 2 min and then washed out for 2 min before mIPSC or eIPSC (evoked by 5 pulses at a 1 Hz frequency) recordings were taken. B, representative traces of the 1st AP after treatment with either BSA (black) or syt1 lumen antibody (grey). C, summary graph of the average IPSC amplitude after treatment with either BSA (black) or syt1 lumen antibody (grey) (BSA, n = 16; syt1 lumen antibody, n = 14; t (28) = 3.158; P = 0.0038; t test). D, normalized charge transfer plot for the average IPSC over 1 s in neurons treated with BSA (black) and syt1 lumen antibody (grey) (ordinary two‐way ANOVA; F (1,588) = 59.49; P < 0.0001). E, representative mIPSC traces from neurons treated with BSA (black) and syt1 lumen antibody (grey). F, summary graph of the average mIPSC frequency in neurons treated with BSA (black) and syt1 lumen antibody (grey) (BSA, n = 6; syt1 lumen antibody, n = 7; t (12) = 3.138; P = 0.0086; t test). G, distribution of mIPSC amplitude from neurons treated with BSA (black) and syt1 lumen antibody (grey) (ordinary two‐way ANOVA; F (1,84) = 0.3033; P = 0.5833). H, diagram of experiment: neurons were incubated in either 1% syt1 lumen antibody or 3% BSA Tyrode solution for 30 min in the presence of tetrodotoxin (TTX) and then washed out for 5 min before mIPSC or eIPSC (evoked by 5 pulses at a 1 Hz frequency) recordings were taken. I, representative traces of the 1st AP after treatment with either BSA (black) or syt1 lumen antibody (grey). J, summary graph of the average IPSC amplitude after treatment with either BSA (black) or syt1 lumen antibody (grey) (BSA, n = 11; syt1 lumen antibody, n = 10; t (19) = 0.5023; P = 0.6212; t test). K, normalized charge transfer plot for the average IPSCs over 1 s in neurons treated with BSA (black) and syt1 lumen antibody (grey) (ordinary two‐way ANOVA; F (1,399) = 2.394; P = 0.1226). L, representative mIPSC traces from neurons treated with BSA (black) and syt1 lumen antibody (grey). M, summary graph of the average mIPSC frequency in neurons treated with BSA (black) and syt1 lumen antibody (grey) (BSA, n = 10; syt1 lumen antibody, n = 9; t (17) = 2.601; P = 0.0186; t test). N, distribution of mIPSC amplitude from neurons treated with BSA (black) and syt1 lumen antibody (grey) (ordinary two‐way ANOVA; F (1,119) = 0.1594; P = 0.3069).

Comment in

Similar articles

Cited by

References

    1. Bai H, Xue R, Bao H, Zhang L, Yethiraj A, Cui Q & Chapman ER (2016). Different states of synaptotagmin regulate evoked versus spontaneous release. Nat Commun 7, 10971. - PMC - PubMed
    1. Bal M, Leitz J, Reese AL, Ramirez DM, Durakoglugil M, Herz J, Monteggia LM & Kavalali ET (2013). Reelin mobilizes a VAMP7‐dependent synaptic vesicle pool and selectively augments spontaneous neurotransmission. Neuron 80, 934–946. - PMC - PubMed
    1. Bezprozvanny I & Mattson MP (2008). Neuronal calcium mishandling and the pathogenesis of Alzheimer's disease. Trends Neurosci 31, 454–463. - PMC - PubMed
    1. Chamberland S & Toth K (2016). Functionally heterogeneous synaptic vesicle pools support diverse synaptic signalling. J Physiol 594, 825–835. - PMC - PubMed
    1. Chung C, Barylko B, Leitz J, Liu X & Kavalali ET (2010). Acute dynamin inhibition dissects synaptic vesicle recycling pathways that drive spontaneous and evoked neurotransmission. J Neurosci 30, 1363–1376. - PMC - PubMed

Publication types

LinkOut - more resources