Distinct patterns of cytolytic T-cell activation by different tumour cells revealed by Ca2+ signalling and granule mobilization
- PMID: 27716898
- PMCID: PMC5214755
- DOI: 10.1111/imm.12679
Distinct patterns of cytolytic T-cell activation by different tumour cells revealed by Ca2+ signalling and granule mobilization
Abstract
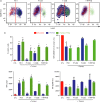
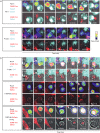
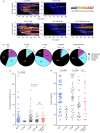
Cancer-germline genes in both humans and mice have been shown to encode antigens susceptible to targeting by cytotoxic CD8 T effector cells (CTL). We analysed the ability of CTL to kill different tumour cell lines expressing the same cancer-germline gene P1A (Trap1a). We previously demonstrated that CTL expressing a T-cell receptor specific for the P1A35-43 peptide associated with H-2Ld , although able to induce regression of P1A-expressing P815 mastocytoma cells, were much less effective against P1A-expressing melanoma cells. Here, we analysed parameters of the in vitro interaction between P1A-specific CTL and mastocytoma or melanoma cells expressing similar levels of the P1A gene and of surface H-2Ld . The mastocytoma cells were more sensitive to cytolysis than the melanoma cells in vitro. Analysis by video-microscopy of early events required for target cell killing showed that similar patterns of increase in cytoplasmic Ca2+ concentration ([Ca2+ ]i) were induced by both types of P1A-expressing tumour cells. However, the use of CTL expressing a fluorescent granzyme B (GZMB-Tom) showed a delay in the migration of cytotoxic granules to the tumour interaction site, as well as a partially deficient GZMB-Tom exocytosis in response to the melanoma cells. Among surface molecules possibly affecting tumour-CTL interactions, the mastocytoma cells were found to express intercellular adhesion molecule-1, the ligand for LFA-1, which was not detected on the melanoma cells.
Keywords: cytolytic T lymphocyte; fluorescent granzyme B; melanoma; tumour.
© 2016 John Wiley & Sons Ltd.
Figures


Similar articles
-
Visualization of cytolytic T cell differentiation and granule exocytosis with T cells from mice expressing active fluorescent granzyme B.PLoS One. 2013 Jun 28;8(6):e67239. doi: 10.1371/journal.pone.0067239. Print 2013. PLoS One. 2013. PMID: 23840635 Free PMC article.
-
Intramuscular electroporation of a P1A-encoding plasmid vaccine delays P815 mastocytoma growth.Bioelectrochemistry. 2014 Dec;100:112-8. doi: 10.1016/j.bioelechem.2013.11.002. Epub 2013 Dec 1. Bioelectrochemistry. 2014. PMID: 24342164
-
Localization of two cytotoxic T lymphocyte epitopes and three anchoring residues on a single nonameric peptide that binds to H-2Ld and is recognized by cytotoxic T lymphocytes against mouse tumor P815.Eur J Immunol. 1994 Nov;24(11):2740-5. doi: 10.1002/eji.1830241125. Eur J Immunol. 1994. PMID: 7525302
-
[Analysis of tumor rejection antigen peptides recognized by specific CTL].Nihon Rinsho. 1996 Jan;54(1):242-9. Nihon Rinsho. 1996. PMID: 8587197 Review. Japanese.
-
Cellular mechanisms of lymphocyte-mediated lysis of tumor cells.Ann Ist Super Sanita. 1990;26(3-4):369-84. Ann Ist Super Sanita. 1990. PMID: 2151107 Review.
Cited by
-
Dynamic visualization of the whole process of cytotoxic T lymphocytes killing B16 tumor cells in vitro.J Biomed Opt. 2019 Mar;24(5):1-7. doi: 10.1117/1.JBO.24.5.051413. J Biomed Opt. 2019. PMID: 30825298 Free PMC article.
-
Signal strength controls the rate of polarization within CTLs during killing.J Cell Biol. 2021 Oct 4;220(10):e202104093. doi: 10.1083/jcb.202104093. Epub 2021 Jul 22. J Cell Biol. 2021. PMID: 34292303 Free PMC article.
References
-
- Coulie PG, Van den Eynde BJ, van der Bruggen P, Boon T. Tumour antigens recognized by T lymphocytes: at the core of cancer immunotherapy. Nat Rev Cancer 2014; 14:135–46. - PubMed
-
- Kvistborg P, Philips D, Kelderman S, Hageman L, Ottensmeier C, Joseph‐Pietras D et al Anti‐CTLA‐4 therapy broadens the melanoma‐reactive CD8+ T cell response. Sci Transl Med 2014; 6:254ra128. - PubMed
Publication types
MeSH terms
Substances
LinkOut - more resources
Full Text Sources
Other Literature Sources
Medical
Molecular Biology Databases
Research Materials
Miscellaneous

