

EpiMINE, a computational program for mining epigenomic data
- PMID: 27708717
- PMCID: PMC5043526
- DOI: 10.1186/s13072-016-0095-z
EpiMINE, a computational program for mining epigenomic data
Abstract
Background: In epigenetic research, both the increasing ease of high-throughput sequencing and a greater interest in genome-wide studies have resulted in an exponential flooding of epigenetic-related data in public domain. This creates an opportunity for exploring data outside the limits of any specific query-centred study. Such data have to undergo standard primary analyses that are accessible with multiple well-stabilized programs. Further downstream analyses, such as genome-wide comparative, correlative and quantitative analyses, are critical in deciphering key biological features. However, these analyses are only accessible for computational researchers and completely lack platforms capable of handling, analysing and linking multiple interdisciplinary datasets with efficient analytical methods.
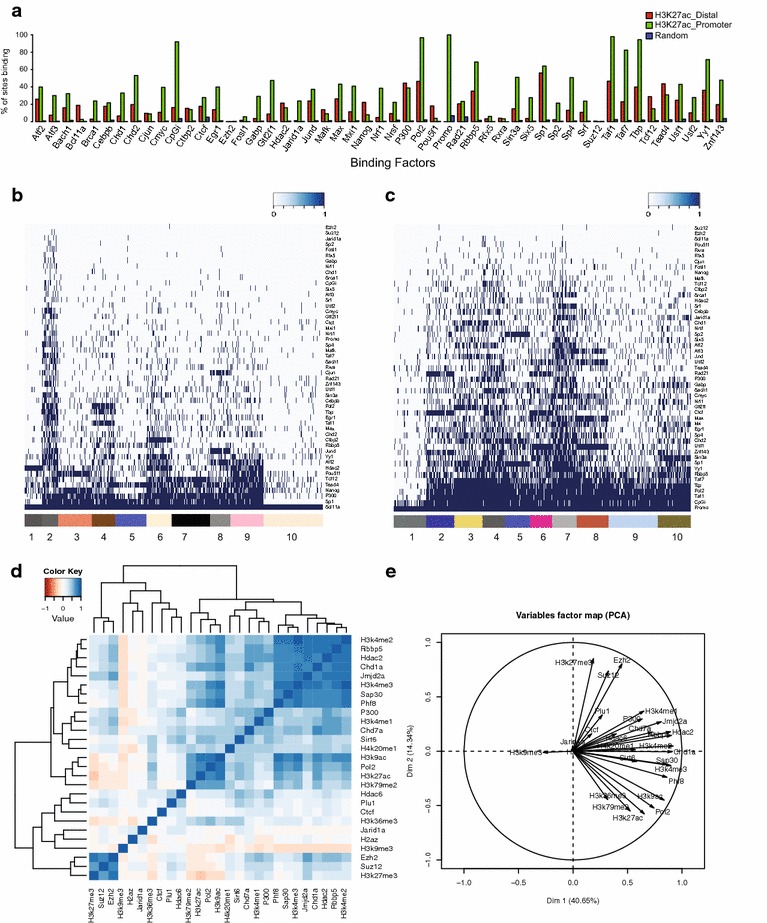
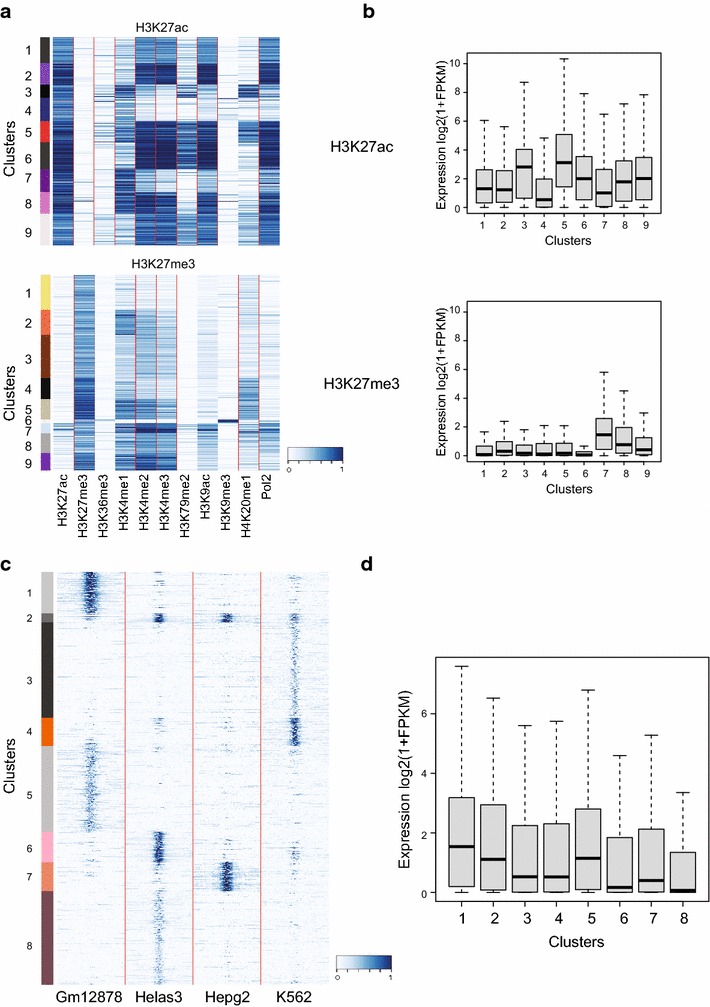
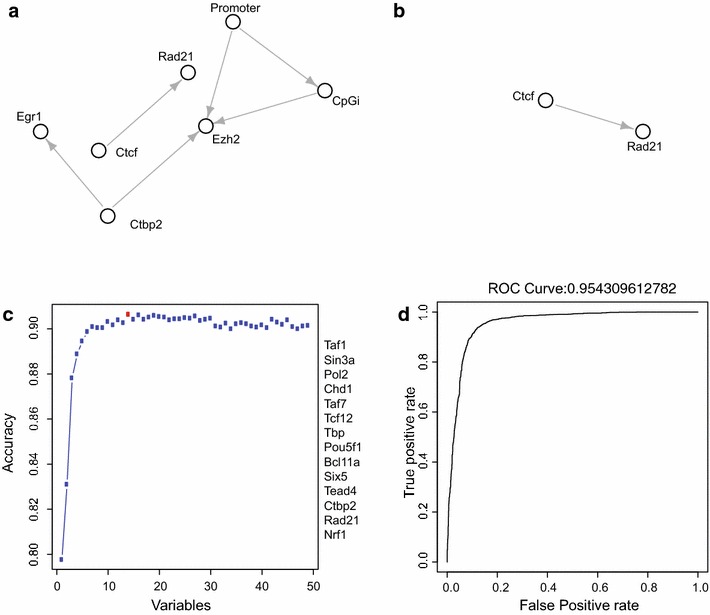
Results: Here, we present EpiMINE, a program for mining epigenomic data. It is a user-friendly, stand-alone computational program designed to support multiple datasets, for performing genome-wide correlative and quantitative analysis of ChIP-seq and RNA-seq data. Using data available from the ENCODE project, we illustrated several features of EpiMINE through different biological scenarios to show how easy some known observations can be verified. These results highlight how these approaches can be helpful in identifying novel biological features.
Conclusions: EpiMINE performs different kinds of genome-wide quantitative and correlative analyses, using ChIP-seq- and RNA-seq-related datasets. Its framework enables it to be used by both experimental and computational researchers. EpiMINE can be downloaded from https://sourceforge.net/projects/epimine/.
Keywords: ChIP-seq; Chromatin immunoprecipitation; Correlation; NGS; Quantification; RNA-seq.
Figures
Similar articles
-
ePIANNO: ePIgenomics ANNOtation tool.PLoS One. 2016 Feb 9;11(2):e0148321. doi: 10.1371/journal.pone.0148321. eCollection 2016. PLoS One. 2016. PMID: 26859295 Free PMC article.
-
Development and application of an integrated allele-specific pipeline for methylomic and epigenomic analysis (MEA).BMC Genomics. 2018 Jun 15;19(1):463. doi: 10.1186/s12864-018-4835-2. BMC Genomics. 2018. PMID: 29907088 Free PMC article.
-
ORIO (Online Resource for Integrative Omics): a web-based platform for rapid integration of next generation sequencing data.Nucleic Acids Res. 2017 Jun 2;45(10):5678-5690. doi: 10.1093/nar/gkx270. Nucleic Acids Res. 2017. PMID: 28402545 Free PMC article.
-
Revolution of nephrology research by deep sequencing: ChIP-seq and RNA-seq.Kidney Int. 2014 Jan;85(1):31-8. doi: 10.1038/ki.2013.321. Epub 2013 Aug 28. Kidney Int. 2014. PMID: 23986147 Review.
-
Utility of next-generation RNA-sequencing in identifying chimeric transcription involving human endogenous retroviruses.APMIS. 2016 Jan-Feb;124(1-2):127-39. doi: 10.1111/apm.12477. APMIS. 2016. PMID: 26818267 Review.
Cited by
-
Quality-controlled R-loop meta-analysis reveals the characteristics of R-loop consensus regions.Nucleic Acids Res. 2022 Jul 22;50(13):7260-7286. doi: 10.1093/nar/gkac537. Nucleic Acids Res. 2022. PMID: 35758606 Free PMC article.
-
ChroKit: a Shiny-based framework for interactive analysis, visualization and integration of genomic data.Nucleic Acids Res. 2023 Jul 5;51(W1):W83-W92. doi: 10.1093/nar/gkad345. Nucleic Acids Res. 2023. PMID: 37144464 Free PMC article.
-
GsmPlot: a web server to visualize epigenome data in NCBI.BMC Bioinformatics. 2020 Feb 12;21(1):55. doi: 10.1186/s12859-020-3386-0. BMC Bioinformatics. 2020. PMID: 32050905 Free PMC article.
-
Profile of Histone H3 Lysine 4 Trimethylation and the Effect of Lipopolysaccharide/Immune Complex-Activated Macrophages on Endotoxemia.Front Immunol. 2020 Jan 10;10:2956. doi: 10.3389/fimmu.2019.02956. eCollection 2019. Front Immunol. 2020. PMID: 31998290 Free PMC article.
References
-
- Jean G, Kahles A, Sreedharan VT, De Bona F, Ratsch G. RNA-Seq read alignments with PALMapper. Curr Protoc Bioinformatics, Chapter 11, Unit 11 16 (2010). - PubMed
Publication types
MeSH terms
Substances
LinkOut - more resources
Full Text Sources
Other Literature Sources
