. 2016 Nov 1;7(44):72148-72166.
doi: 10.18632/oncotarget.12355.

NSAID-activated gene 1 mediates pro-inflammatory signaling activation and paclitaxel chemoresistance in type I human epithelial ovarian cancer stem-like cells

Affiliations

NSAID-activated gene 1 mediates pro-inflammatory signaling activation and paclitaxel chemoresistance in type I human epithelial ovarian cancer stem-like cells

Ki-Hyung Kim et al. Oncotarget. .

Abstract

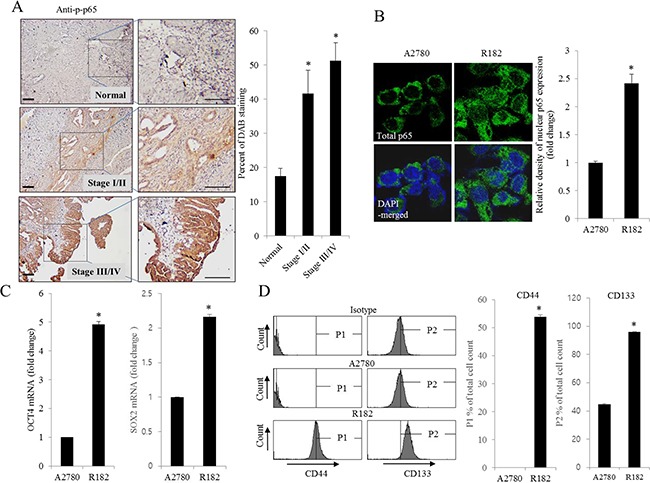
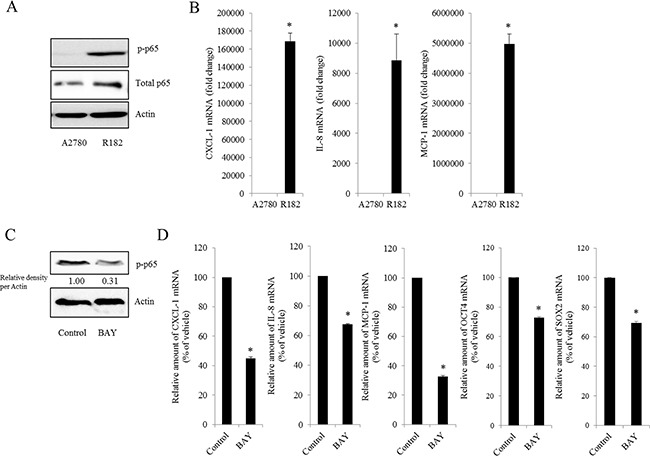
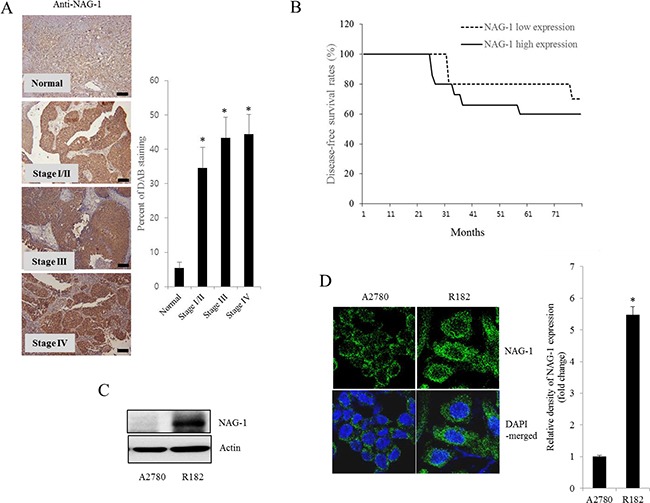
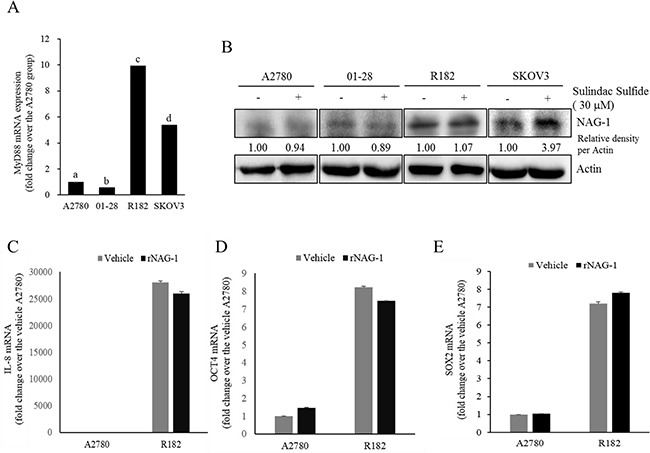
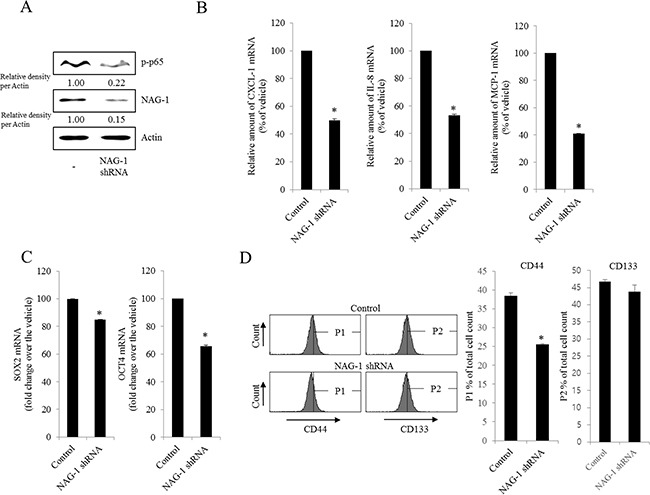
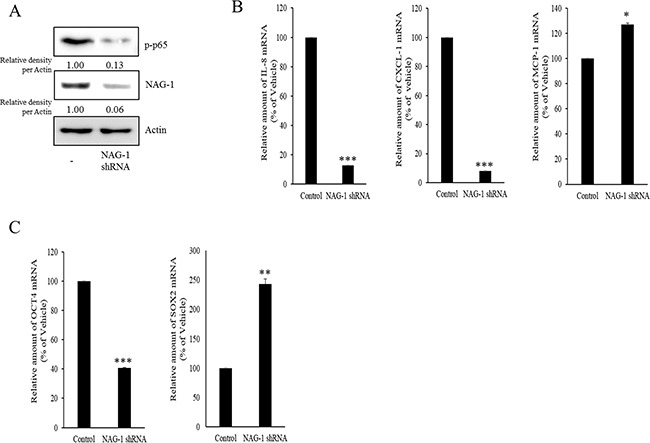
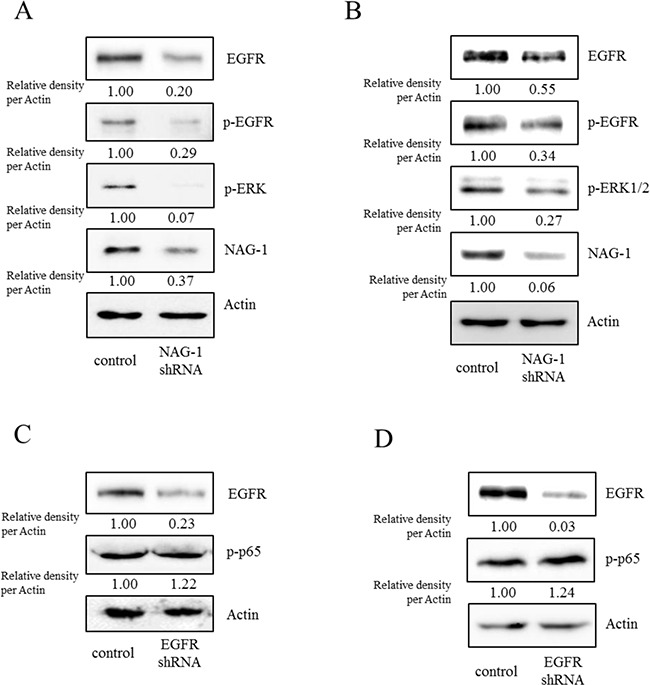
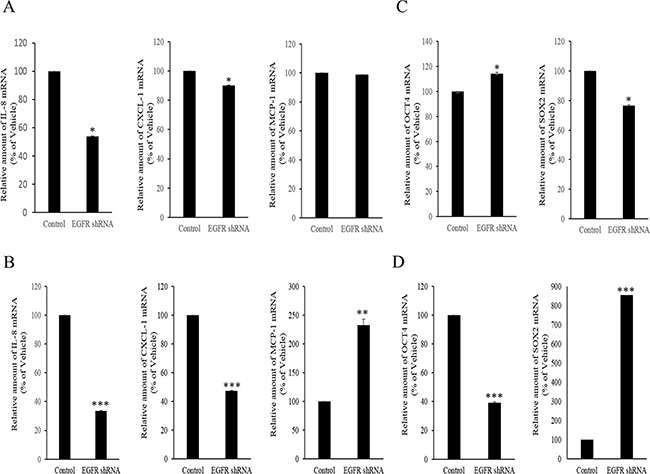
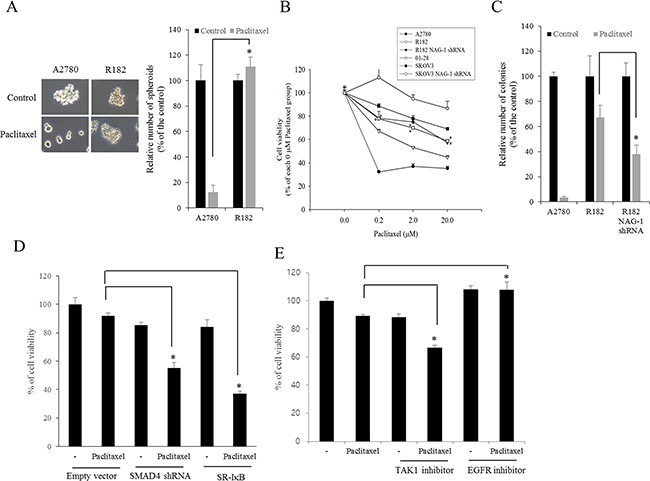
Epithelial ovarian cancer (EOC) remains the most lethal gynecologic malignancy in developed countries. Chronic endogenous sterile pro-inflammatory responses are strongly linked to EOC progression and chemoresistance to anti-cancer therapeutics. In the present study, the activity of epithelial NF-κB, a key pro-inflammatory transcription factor, was enhanced with the progress of EOC. This result was mechanistically linked with an increased expression of NSAID-Activated Gene 1 (NAG-1) in MyD88-positive type I EOC stem-like cells, compared with that in MyD88-negative type II EOC cells. Elevated NAG-1 as a potent biomarker of poor prognosis in the ovarian cancer was positively associated with the levels of NF-κB activation, chemokines and stemness markers in type I EOC cells. In terms of signal transduction, NAG-1-activated SMAD-linked and non-canonical TGFβ-activated kinase 1 (TAK-1)-activated pathways contributed to NF-κB activation and the subsequent induction of some chemokines and cancer stemness markers. In addition to effects on NF-κB-dependent gene regulation, NAG-1 was involved in expression of EGF receptor and subsequent activation of EGF receptor-linked signaling. The present study also provided evidences for links between NAG-1-linked signaling and chemoresistance in ovarian cancer cells. NAG-1 and pro-inflammatory NF-κB were positively associated with resistance to paclitaxel in MyD88-positive type I EOC cells. Mechanistically, this chemoresistance occurred due to enhanced activation of the SMAD-4- and non-SMAD-TAK-1-linked pathways. All of the present data suggested NAG-1 protein as a crucial mediator of EOC progression and resistance to the standard first-line chemotherapy against EOC, particularly in MyD88-positive ovarian cancer stem-like cells.

Keywords: NAG-1; NF-κB; chemoresistance; epithelial ovary cancer; paclitaxel.


Conflict of interest statement

CONFLICTS OF INTEREST

The authors have no conflicts of interest to declare.

Figures

Figure 1
Figure 1. Histological and molecular phenotype of human ovarian cancer
A. Paraffin sections of human ovarian tissues from normal or cancer patients were stained with anti-p-p65 Ab by the immunoperoxidase method as described in the Materials and Methods section (original magnification ×100) (Black scale bar, 0.2 μm). The right panel shows the percentage of p-p65-positive cells measured using HistoQuest tissue analysis software. *A significant difference from the normal group (p< 0.05). B. A2780 cells and R182 cells were stained with an anti-p65 Ab and DAPI before being assessed by confocal microscopy (original magnification ×1800). The right panel shows the relative density of nuclear p65 expression in the cell. *A significant difference from levels in A2780 cells (p< 0.05). C. mRNA levels of OCT4 and SOX2 in A2780 cells and R182 cells were measured using reverse transcription real-time PCR. *A significant difference from levels in A2780 cells (p< 0.05). D. Cellular fluorescence from binding of anti-CD44-FITC Ab and anti-CD133-APC Ab was measured using flow cytometry analysis. *A significant difference from levels in A2780 cells (p< 0.05).
Figure 2
Figure 2. Effect of NF-κB activation on human ovarian cancer chemokines
A. Cellular lysates of A2780 cells and R182 cells were subjected to western blot analysis. B. mRNA levels of A2780 and R182 cells were measured using reverse transcription real-time PCR. *A significant difference from levels in A2780 cells (p< 0.05). C. R182 cells were treated with control or 20 μM BAY 11-7082 for 4 h. Cellular lysates were subjected to western blot analysis. D. R182 cells were treated with the vehicle or 20 μM of BAY11-7082 for 4 h. mRNA levels were measured using reverse transcription real-time PCR. *A significant difference from the vehicle-treated group (p< 0.05).
Figure 3
Figure 3. NAG-1 expression in human ovarian cancer and type I EOC cells
A. Paraffin sections of human ovarian tissues from normal or cancer patients were stained with anti-NAG-1 Ab by the immunoperoxidase method as described in the Materials and Methods section (original magnification ×100) (Black scale bar, 0.2 μm). The right panel shows the percentage of cells stained for NAG-1 DAB measured using HistoQuest tissue analysis software. *A significant difference from the normal group (p< 0.05). B. Kaplan-Meier survival analysis of disease-free survival in ovarian cancer patients comparing the low NAG-1 expression group (n=10) and the high NAG-1 expression group (n=15). C. Cellular lysates of A2780 cells and R182 cells were subjected to western blot analysis. D. A2780 cells and R182 cells were stained with an anti-NAG-1 Ab and DAPI before being assessed by confocal microscopy (original magnification ×1800). The right panel shows the relative quantitative values of NAG-1 expression. *A significant difference from A2780 (p< 0.05).
Figure 4
Figure 4. Effects of sulindac sulfide or recombinant NAG-1 (rNAG-1) on NAG-1-linked signals
A. MyD88 mRNA levels in human EOC cell lines (A2780, 01-28, R182, or SKOV3) were measured using reverse transcription real-time PCR. Different letters represent significant difference between two groups (p < 0.05). B. A2780, 01-28, R182 or SKOV3 cells were treated with vehicle or 30 μM sulindac sulfide (S.S) for 48 h. Cellular lysates were subjected to Western blotting analysis. (C-E) A2780 and R182 cells were treated with vehicle or 10 ng/ml rNAG-1 for 24 h. Cellular mRNA levels were measured using reverse transcription real-time PCR.
Figure 5
Figure 5. Involvement of NAG-1 expression in NF-κB-mediated inflammatory responses and stemness in R182 cells
R182 cells expressing the control vector or NAG-1 shRNA plasmid were compared. A. Cellular lysates were subjected to western blot analysis. B. and C. mRNA levels were analyzed by reverse transcription real-time PCR. *A significant difference from the control (p< 0.05). D. Cellular fluorescence from the binding of anti-CD44-FITC Ab and anti-CD133-APC Ab was measured using flow cytometry analysis. *A significant difference from the control (p < 0.05).
Figure 6
Figure 6. Involvement of NAG-1 expression in NF-κB-medicated inflammatory responses and stemness in SKOV3 cells
A. Control or NAG-1 shRNA vector-transfected SKOV3 cells were subjected to Western blot analysis. B. and C. mRNA levels of control or NAG-1 shRNA vector-transfected SKOV3 cells was measured using reverse transcription real-time PCR. A significant difference from the control (*, p< 0.05; **, p< 0.01; or ***, p< 0.001).
Figure 7
Figure 7. Involvement of TAK-1 and SMAD4 expression in NF-κB-mediated inflammatory responses in type I EOC cells
R182 cells were treated with 2 μM of the TAK-1 inhibitor 5Z-7-oxozeaenol for 4 h. A. Cellular lysates were subjected to western blot analysis. B. mRNA levels were analyzed by reverse transcription real-time PCR. *A significant difference from the control (p< 0.05). (C–E) R182 cells expressing the control vector or SMAD4 shRNA plasmid were compared. C. SMAD4 expression were analyzed using RT-PCR. D. Cellular lysates were subjected to western blot analysis. E. mRNA levels were analyzed by reverse transcription real-time PCR. *A significant difference from the control (p< 0.05).
Figure 8
Figure 8. Involvement of NAG-1-mediated EGFR activation in inflammatory signals in type I EOC cells
R182 A, C. and SKOV3 B, D. cells expressing the control vector or NAG-1 shRNA plasmid were compared. Cellular lysates were subjected to western blot analysis.
Figure 9
Figure 9. Involvement of NAG-1-mediated EGFR activation in inflammatory responses in type I EOC cells
R182 A, C. and SKOV3 B, D. cells expressing the control vector or EGFR shRNA plasmid were compared. Cellular mRNA levels were analyzed by reverse transcription real-time PCR. A significant difference from the control (*, p< 0.05; **, p< 0.01; or ***, p< 0.001).
Figure 10
Figure 10. Involvement of NAG-1-mediated signals in drug resistance in ovarian cancer cells
A. A2780 and R182 cells were treated with 1 μM paclitaxel for 4 days and the spheroids were counted. *A significant difference from the paclitaxel-treated A2780 cells (p < 0.05). B. The viability of EOC cells (A2780, 01-28, R182, or SKOV3 cells) expressing vector or NAG-1 shRNA plasmid were compared. Cells were treated with each dose of paclitaxel for 48 h, and cell viability was measured using MTT assay. *A significant difference from the each vehicle-treated group (p< 0.05). C. Colonies of EOC cells (A2780 or R182 cells) expressing vector or NAG-1 shRNA plasmid were treated with 1 μM paclitaxel for 48 h and then incubated for 4 days. The number of colonies were counted. *A significant difference from the paclitaxel-treated R182 cells (p < 0.05). D. R182 cells expressing the control vector, SMAD4 shRNA plasmid, or SR-IκB expression plasmid were compared. Each cells were treated with vehicle or 2 μM paclitaxel for 48 h, and cell viability was measured using MTT assay. *A significant difference from only the paclitaxel-treated group (p < 0.05). E. R182 cells were pre-exposed to control, 2 μM 5Z-7-oxozeaenol (TAK-1 inhibitor) or 1 μM AR1478 (EGFR inhibitor) and treated with vehicle or 2 μM paclitaxel for 48 h. *A significant difference from only the paclitaxel-treated group (p< 0.05).
Figure 11
Figure 11. A putative scheme for the mechanism of NAG-1-mediated chemokine production and chemoresistance in type I EOC cells
Abnormal expression of NAG-1 triggers NF-κB activation via TGFR-mediated signaling cascades including SMAD and TAK-1, which play critical roles in chemokine production and chemoresistance against paclitaxel treatment in MyD88-positive type I EOC cells. Moreover, NAG-1 and NF-κB showed partial effects on increasing the expression of ovarian stemness markers, such as OCT4, SOX2, and CD44. In addition, NAG-1-mediated EGFR-ERK signaling activation was majorly involved in NF-κB-independent chemokine production. However, MyD88-deficient EOC type II cells were sensitive to paclitaxel treatment, compared to the responses in MyD88-positive type I EOC cells, due to deficiency of NAG-1 expression and NF-κB activation.

Similar articles

Cited by

References

    1. Murdoch WJ, McDonnel AC. Roles of the ovarian surface epithelium in ovulation and carcinogenesis. Reproduction. 2002;123:743–750. - PubMed
    1. Schwartz PE. Current diagnosis and treatment modalities for ovarian cancer. Cancer Treat Res. 2002;107:99–118. - PubMed
    1. Jemal A, Siegel R, Ward E, Murray T, Xu J, Smigal C, Thun MJ. Cancer statistics, 2006. CA Cancer J Clin. 2006;56:106–130. - PubMed
    1. Lu KH, Patterson AP, Wang L, Marquez RT, Atkinson EN, Baggerly KA, Ramoth LR, Rosen DG, Liu J, Hellstrom I, Smith D, Hartmann L, Fishman D, et al. Selection of potential markers for epithelial ovarian cancer with gene expression arrays and recursive descent partition analysis. Clin Cancer Res. 2004;10:3291–3300. - PubMed
    1. Daly M, Obrams GI. Epidemiology and risk assessment for ovarian cancer. Semin Oncol. 1998;25:255–264. - PubMed

MeSH terms