

Decay of an active GPCR: Conformational dynamics govern agonist rebinding and persistence of an active, yet empty, receptor state
- PMID: 27702898
- PMCID: PMC5081659
- DOI: 10.1073/pnas.1606347113
Decay of an active GPCR: Conformational dynamics govern agonist rebinding and persistence of an active, yet empty, receptor state
Abstract
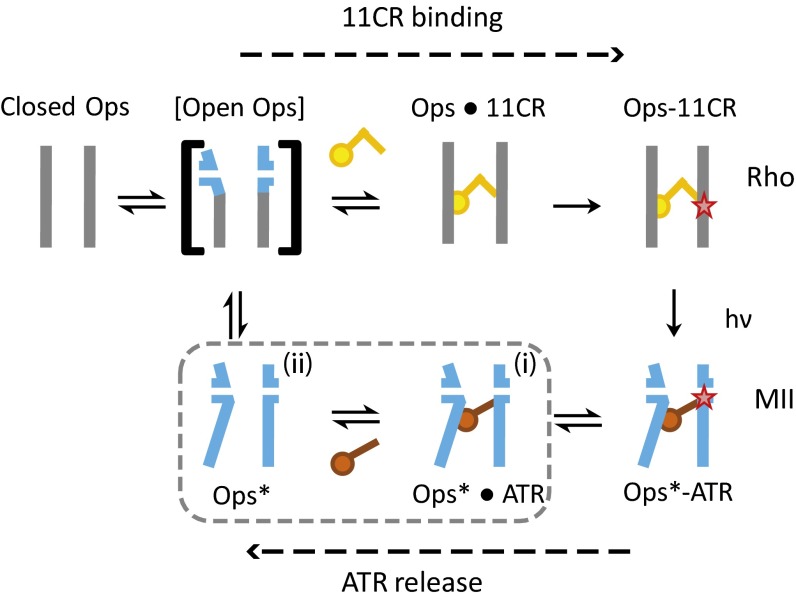
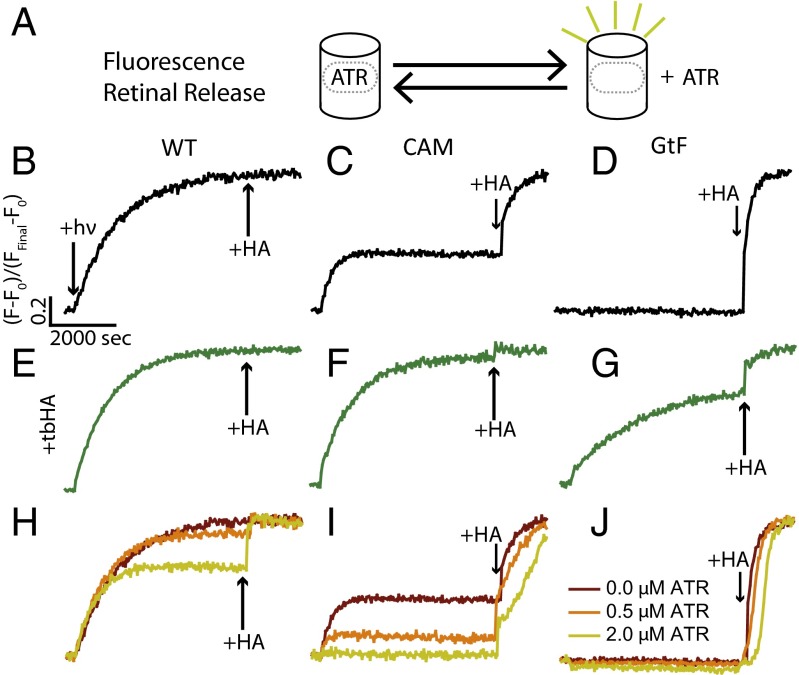
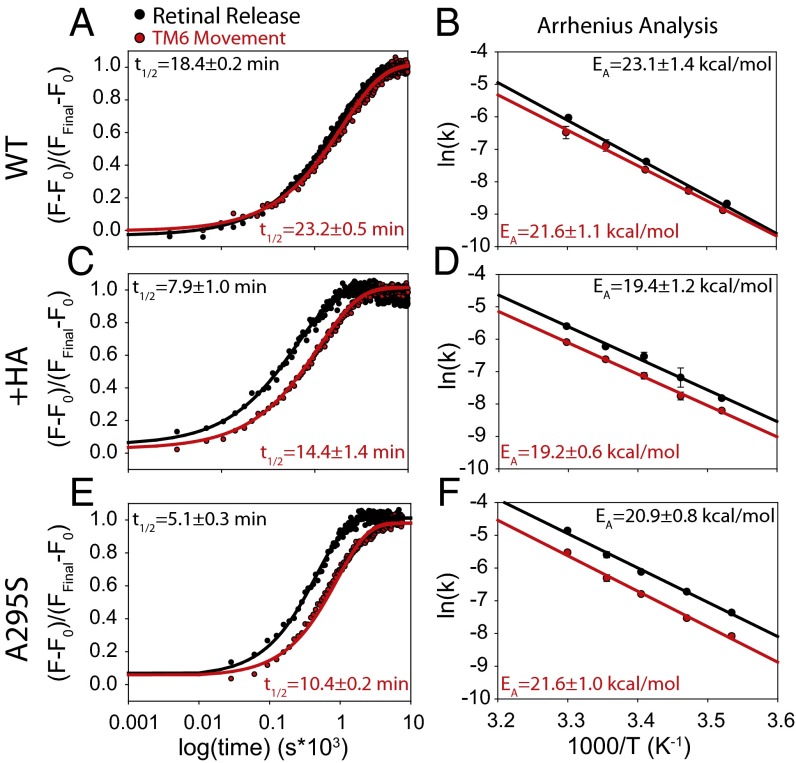
Here, we describe two insights into the role of receptor conformational dynamics during agonist release (all-trans retinal, ATR) from the visual G protein-coupled receptor (GPCR) rhodopsin. First, we show that, after light activation, ATR can continually release and rebind to any receptor remaining in an active-like conformation. As with other GPCRs, we observe that this equilibrium can be shifted by either promoting the active-like population or increasing the agonist concentration. Second, we find that during decay of the signaling state an active-like, yet empty, receptor conformation can transiently persist after retinal release, before the receptor ultimately collapses into an inactive conformation. The latter conclusion is based on time-resolved, site-directed fluorescence labeling experiments that show a small, but reproducible, lag between the retinal leaving the protein and return of transmembrane helix 6 (TM6) to the inactive conformation, as determined from tryptophan-induced quenching studies. Accelerating Schiff base hydrolysis and subsequent ATR dissociation, either by addition of hydroxylamine or introduction of mutations, further increased the time lag between ATR release and TM6 movement. These observations show that rhodopsin can bind its agonist in equilibrium like a traditional GPCR, provide evidence that an active GPCR conformation can persist even after agonist release, and raise the possibility of targeting this key photoreceptor protein by traditional pharmaceutical-based treatments.
Keywords: GPCR; conformational dynamics; fluorescence; retinal; rhodopsin.
Conflict of interest statement
The authors declare no conflict of interest.
Figures


Similar articles
-
Agonist-induced conformational changes in bovine rhodopsin: insight into activation of G-protein-coupled receptors.J Mol Biol. 2008 Oct 3;382(2):539-55. doi: 10.1016/j.jmb.2008.06.084. Epub 2008 Jul 7. J Mol Biol. 2008. PMID: 18638482
-
Conformational selection and equilibrium governs the ability of retinals to bind opsin.J Biol Chem. 2015 Feb 13;290(7):4304-18. doi: 10.1074/jbc.M114.603134. Epub 2014 Dec 1. J Biol Chem. 2015. PMID: 25451936 Free PMC article.
-
A constitutively activating mutation alters the dynamics and energetics of a key conformational change in a ligand-free G protein-coupled receptor.J Biol Chem. 2013 Sep 27;288(39):28207-16. doi: 10.1074/jbc.M113.472464. Epub 2013 Aug 12. J Biol Chem. 2013. PMID: 23940032 Free PMC article.
-
Relevance of rhodopsin studies for GPCR activation.Biochim Biophys Acta. 2014 May;1837(5):674-82. doi: 10.1016/j.bbabio.2013.09.002. Epub 2013 Sep 13. Biochim Biophys Acta. 2014. PMID: 24041646 Review.
-
Structural insights into agonist-induced activation of G-protein-coupled receptors.Curr Opin Struct Biol. 2011 Aug;21(4):541-51. doi: 10.1016/j.sbi.2011.06.002. Epub 2011 Jun 30. Curr Opin Struct Biol. 2011. PMID: 21723721 Review.
Cited by
-
Functional trade-offs and environmental variation shaped ancient trajectories in the evolution of dim-light vision.Elife. 2018 Oct 26;7:e35957. doi: 10.7554/eLife.35957. Elife. 2018. PMID: 30362942 Free PMC article.
-
Distinct Activation Mechanisms of CXCR4 and ACKR3 Revealed by Single-Molecule Analysis of their Conformational Landscapes.bioRxiv [Preprint]. 2024 Jun 20:2023.10.31.564925. doi: 10.1101/2023.10.31.564925. bioRxiv. 2024. PMID: 37961571 Free PMC article. Preprint.
-
Conformational Transitions and the Activation of Heterotrimeric G Proteins by G Protein-Coupled Receptors.ACS Pharmacol Transl Sci. 2019 Jul 26;2(4):285-290. doi: 10.1021/acsptsci.9b00054. eCollection 2019 Aug 9. ACS Pharmacol Transl Sci. 2019. PMID: 32259062 Free PMC article.
-
Ligand channel in pharmacologically stabilized rhodopsin.Proc Natl Acad Sci U S A. 2018 Apr 3;115(14):3640-3645. doi: 10.1073/pnas.1718084115. Epub 2018 Mar 19. Proc Natl Acad Sci U S A. 2018. PMID: 29555765 Free PMC article.
-
A ciliary opsin in the brain of a marine annelid zooplankton is ultraviolet-sensitive, and the sensitivity is tuned by a single amino acid residue.J Biol Chem. 2017 Aug 4;292(31):12971-12980. doi: 10.1074/jbc.M117.793539. Epub 2017 Jun 16. J Biol Chem. 2017. PMID: 28623234 Free PMC article.
References
-
- De Lean A, Stadel JM, Lefkowitz RJ. A ternary complex model explains the agonist-specific binding properties of the adenylate cyclase-coupled beta-adrenergic receptor. J Biol Chem. 1980;255(15):7108–7117. - PubMed
-
- Wald G. The molecular basis of visual excitation. Nature. 1968;219(5156):800–807. - PubMed
-
- Vogel R, Siebert F. Conformations of the active and inactive states of opsin. J Biol Chem. 2001;276(42):38487–38493. - PubMed
-
- Surya A, Foster KW, Knox BE. Transducin activation by the bovine opsin apoprotein. J Biol Chem. 1995;270(10):5024–5031. - PubMed
Publication types
MeSH terms
Substances
Grants and funding
LinkOut - more resources
Full Text Sources
Other Literature Sources
Research Materials
Miscellaneous
