Modeling complexes of modeled proteins
- PMID: 27701777
- PMCID: PMC5313347
- DOI: 10.1002/prot.25183
Modeling complexes of modeled proteins
Abstract
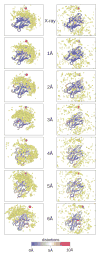
Structural characterization of proteins is essential for understanding life processes at the molecular level. However, only a fraction of known proteins have experimentally determined structures. This fraction is even smaller for protein-protein complexes. Thus, structural modeling of protein-protein interactions (docking) primarily has to rely on modeled structures of the individual proteins, which typically are less accurate than the experimentally determined ones. Such "double" modeling is the Grand Challenge of structural reconstruction of the interactome. Yet it remains so far largely untested in a systematic way. We present a comprehensive validation of template-based and free docking on a set of 165 complexes, where each protein model has six levels of structural accuracy, from 1 to 6 Å Cα RMSD. Many template-based docking predictions fall into acceptable quality category, according to the CAPRI criteria, even for highly inaccurate proteins (5-6 Å RMSD), although the number of such models (and, consequently, the docking success rate) drops significantly for models with RMSD > 4 Å. The results show that the existing docking methodologies can be successfully applied to protein models with a broad range of structural accuracy, and the template-based docking is much less sensitive to inaccuracies of protein models than the free docking. Proteins 2017; 85:470-478. © 2016 Wiley Periodicals, Inc.
Keywords: interactome; protein docking; protein modeling; protein recognition; structure prediction.
© 2016 Wiley Periodicals, Inc.
Figures


Similar articles
-
Addressing recent docking challenges: A hybrid strategy to integrate template-based and free protein-protein docking.Proteins. 2017 Mar;85(3):497-512. doi: 10.1002/prot.25234. Epub 2017 Jan 24. Proteins. 2017. PMID: 28026062
-
Modeling and minimizing CAPRI round 30 symmetrical protein complexes from CASP-11 structural models.Proteins. 2017 Mar;85(3):463-469. doi: 10.1002/prot.25182. Epub 2016 Oct 24. Proteins. 2017. PMID: 27701764
-
FlexPepDock lessons from CAPRI peptide-protein rounds and suggested new criteria for assessment of model quality and utility.Proteins. 2017 Mar;85(3):445-462. doi: 10.1002/prot.25230. Proteins. 2017. PMID: 28002624 Free PMC article.
-
What method to use for protein-protein docking?Curr Opin Struct Biol. 2019 Apr;55:1-7. doi: 10.1016/j.sbi.2018.12.010. Epub 2019 Feb 1. Curr Opin Struct Biol. 2019. PMID: 30711743 Free PMC article. Review.
-
Assessment of Protein-Protein Docking Models Using Deep Learning.Methods Mol Biol. 2024;2780:149-162. doi: 10.1007/978-1-0716-3985-6_10. Methods Mol Biol. 2024. PMID: 38987469 Review.
Cited by
-
How to choose templates for modeling of protein complexes: Insights from benchmarking template-based docking.Proteins. 2020 Aug;88(8):1070-1081. doi: 10.1002/prot.25875. Epub 2020 Feb 7. Proteins. 2020. PMID: 31994759 Free PMC article.
-
Structural quality of unrefined models in protein docking.Proteins. 2017 Jan;85(1):39-45. doi: 10.1002/prot.25188. Epub 2016 Nov 13. Proteins. 2017. PMID: 27756103 Free PMC article.
-
Computational Feasibility of an Exhaustive Search of Side-Chain Conformations in Protein-Protein Docking.J Comput Chem. 2018 Sep 15;39(24):2012-2021. doi: 10.1002/jcc.25381. Epub 2018 Sep 18. J Comput Chem. 2018. PMID: 30226647 Free PMC article.
-
Modeling CAPRI targets 110-120 by template-based and free docking using contact potential and combined scoring function.Proteins. 2018 Mar;86 Suppl 1(Suppl 1):302-310. doi: 10.1002/prot.25380. Epub 2017 Sep 28. Proteins. 2018. PMID: 28905425 Free PMC article.
-
Scoring of protein-protein docking models utilizing predicted interface residues.Proteins. 2022 Jul;90(7):1493-1505. doi: 10.1002/prot.26330. Epub 2022 Mar 14. Proteins. 2022. PMID: 35246997 Free PMC article.
References
-
- Mosca R, Pons T, Ceol A, Valencia A, Aloy P. Towards a detailed atlas of protein–protein interactions. Curr Opin Struct Biol. 2013;23:929–940. - PubMed
Publication types
MeSH terms
Substances
Grants and funding
LinkOut - more resources
Full Text Sources
Other Literature Sources

