. 2016 Oct 18;113(42):E6467-E6475.
doi: 10.1073/pnas.1605884113. Epub 2016 Oct 3.

Epstein-Barr virus microRNAs reduce immune surveillance by virus-specific CD8+ T cells

Affiliations

Epstein-Barr virus microRNAs reduce immune surveillance by virus-specific CD8+ T cells

Manuel Albanese et al. Proc Natl Acad Sci U S A. .

Abstract

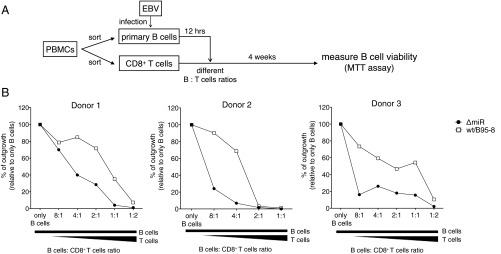
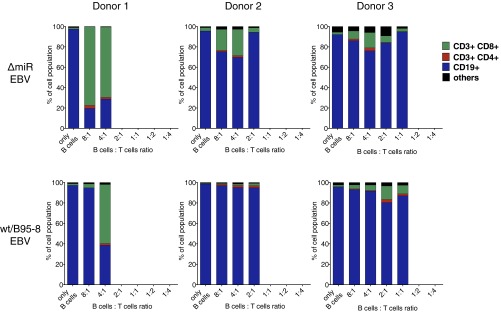
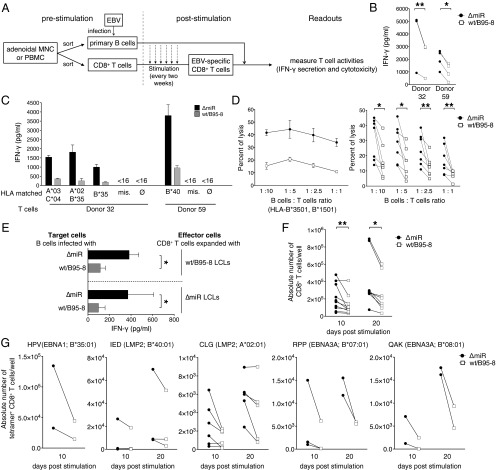
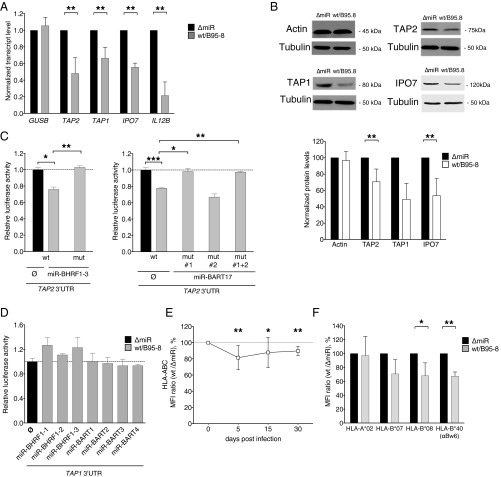
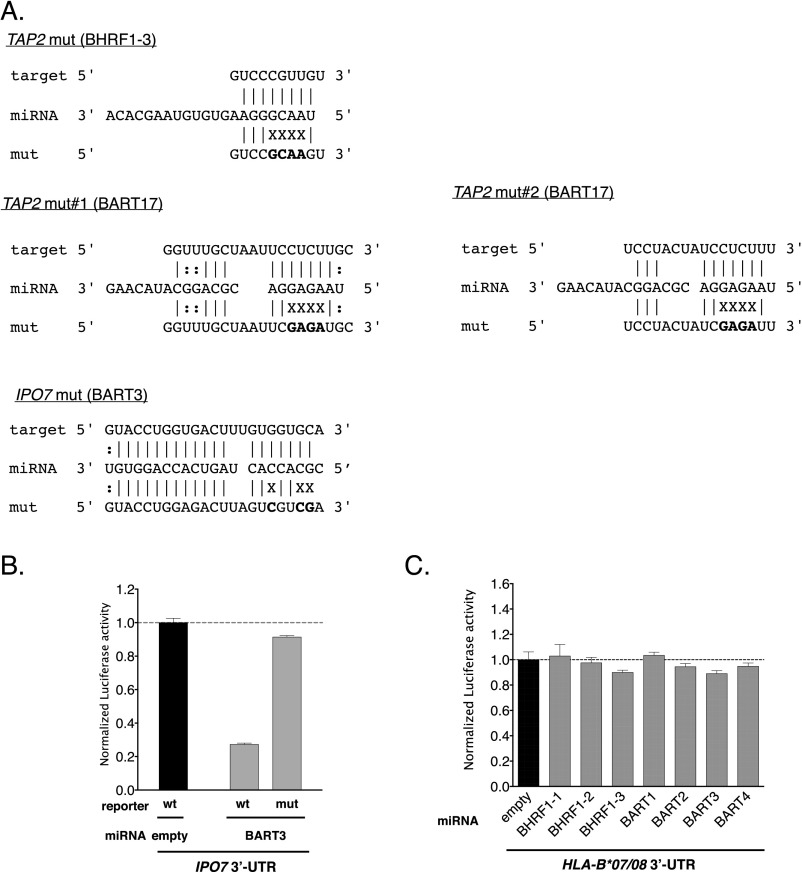
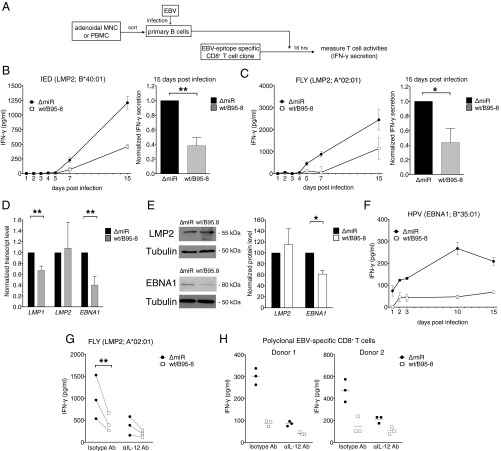
Infection with Epstein-Barr virus (EBV) affects most humans worldwide and persists life-long in the presence of robust virus-specific T-cell responses. In both immunocompromised and some immunocompetent people, EBV causes several cancers and lymphoproliferative diseases. EBV transforms B cells in vitro and encodes at least 44 microRNAs (miRNAs), most of which are expressed in EBV-transformed B cells, but their functions are largely unknown. Recently, we showed that EBV miRNAs inhibit CD4+ T-cell responses to infected B cells by targeting IL-12, MHC class II, and lysosomal proteases. Here we investigated whether EBV miRNAs also counteract surveillance by CD8+ T cells. We have found that EBV miRNAs strongly inhibit recognition and killing of infected B cells by EBV-specific CD8+ T cells through multiple mechanisms. EBV miRNAs directly target the peptide transporter subunit TAP2 and reduce levels of the TAP1 subunit, MHC class I molecules, and EBNA1, a protein expressed in most forms of EBV latency and a target of EBV-specific CD8+ T cells. Moreover, miRNA-mediated down-regulation of the cytokine IL-12 decreases the recognition of infected cells by EBV-specific CD8+ T cells. Thus, EBV miRNAs use multiple, distinct pathways, allowing the virus to evade surveillance not only by CD4+ but also by antiviral CD8+ T cells.

Keywords: CD8 T cells; adaptive immunity; herpesvirus; immune evasion; microRNA.


Conflict of interest statement

The authors declare no conflict of interest.

Figures

Fig. 1.
Fig. 1.
EBV miRNAs support infected B cells to abrogate CD8+ T-cell responses. (A) Schematic overview of the experimental system. (B) CD19+ B cells were isolated from PBMCs of three different EBV-positive donors and infected with WT/B95-8 EBV or ΔmiR EBV stocks. Twelve hours later, infected B cells were extensively washed to remove free virions. In 96-well microtiter plates 32,000 EBV-infected B cells were seeded per well and CD8+ T cells isolated from the autologous donors were added at different ratios as indicated. After 4 wk, total cell viability was assessed by MTT assay. Outgrowth of B-cell–only conditions (without T cells) was set to 100%. The results shown are based on the mean of six technical replicates per data point.
Fig. S1.
Fig. S1.
Composition of long-term cocultures of WT/B95-8 or ΔmiR EBV-infected B cells with autologous CD8+ T cells from three different EBV-positive donors. Coculture experiments of CD19+ B cells infected with WT/B95-8 EBV or ΔmiR EBV stocks and autologous CD8+ T cells were performed as shown in Fig. 1. After 4 wk, the compositions of the outgrowing cells were analyzed by FACS: B cells (CD19+), CD8+ T cells (CD8+/CD3+), CD4+ T cells (CD4+/CD3+), or cells negative for all of the four markers are indicated.
Fig. 2.
Fig. 2.
EBV miRNAs inhibit recognition and killing of infected B cells as well as expansion of EBV-specific CD8+ T cells. (A) Schematic overview of the experiments shown in the remaining panels of this figure. Polyclonal EBV-specific CD8+ T cells were obtained by repeated stimulation (every two weeks) with autologous irradiated WT/B95-8 EBV-infected LCLs. The T-cell activities of the EBV-stimulated CD8+ T cell were subsequently analyzed with target B cells infected with WT/B95-8 EBV or ΔmiR EBV stocks. (B) Equal numbers of polyclonal EBV-specific CD8+ T cells and autologous B cells infected for 15 d with the indicated EBV strains were cocultured. After 16 h, IFN-γ released from T cells was measured by ELISA. Results of three to four biological replicates are shown for each donor. (C) Polyclonal EBV-specific CD8+ T cells were cocultured with HLA-matched or mismatched EBV-infected B cells and tested as in B. Matched HLA class I alleles are indicated; mis., mismatched; ∅, only T cells; <16, below the threshold of detection (16 pg/mL). HLA allotypes of the donors are listed in Table S1. Data are shown as mean values. Error bars indicate SD of three replicates. (D) Cytotoxic activities of EBV-specific CD8+ T cells directed against HLA-matched infected B cells were analyzed at various B:T cells ratios in calcein release assays after 4 h of coculture as shown in A. A representative experiment with mean values and SD of four replicates (Left) and the overview of seven donors (Right) are shown. (E) CD8+ T cells of donor 115 were repetitively stimulated for 2 mo with irradiated autologous B cells infected with WT/B95-8 or ΔmiR EBV as indicated. The expanded effector T cells were assayed with autologous infected B cells as targets in coculture experiments and tested as in B measuring the IFN-γ released by ELISA. Error bars indicate SD of three biological replicates. (F and G) CD8+ T cells isolated from PBMCs were stimulated on day 0 and 10 with irradiated B cells infected with the indicated EBV strains. Absolute numbers of T cells were determined by flow cytometry 10 d later (on day 10 and 20). (F) Expansion of total CD3+ CD8+ T cells. (G) Expansion of EBV epitope-specific CD8+ T cells, stained with HLA/peptide pentamers as indicated. Results from 3 to 10 different donors are shown. The significance of difference in the T-cell expansion experiments was calculated by Wilcoxon matched-pairs signed rank test. *P < 0.05, **P < 0.01.
Fig. 3.
Fig. 3.
EBV miRNAs reduce TAP and MHC class I levels in infected B cells. (A) Transcript levels of TAP2, TAP1, IPO7, and IL12B were assessed by quantitative RT-PCR in EBV-infected B cells 15 d post infection (dpi). IPO7 is a known target of viral miRNAs and is used here as positive control. GUSB was used as negative control. Transcript levels were quantified relative to the mean of the housekeeping genes HPRT1 and HMBS (35) and were normalized to the transcript level of ΔmiR EBV-infected cells. Data are shown as mean values and SD of seven donors. (B) Protein levels of TAP1 and TAP2 were assessed by Western blot analyses in EBV-infected B cells 15 dpi. β-Actin served as negative and IPO7 as positive controls. Representative examples (Top) and protein levels relative to Tubulin (Bottom) are shown. The results were normalized to the protein levels of ΔmiR EBV-infected cells, set to 100%. Data are shown as mean values and SD of three to seven donors. (C and D) EBV miRNAs directly regulate TAP2 but not TAP1. HEK293T cells were cotransfected with miRNA expression vectors and dual luciferase reporter plasmids carrying a wild-type or mutated 3′UTR of TAP2 (C). For the analysis of TAP1 (D), all viral miRNAs present in WT/B95-8 EBV were tested with the exception of miR-BART15, which is barely expressed in our infection model (35). Sequence details of the 3′UTRs are contained in Fig. S2. The luciferase activities were normalized to lysates from cells cotransfected with the wild-type 3′UTR reporter and an empty plasmid in place of the miRNA expression plasmid. Data are shown as mean values and SD of three to four replicates. mut, mutated 3′UTR; WT, wild-type 3′UTR; ∅, empty plasmid. (E and F) Cell surface expression levels of total HLA class I (Left) and specific HLA class I allotypes (Right) of B cells infected with the indicated EBV strains for 15 d were measured by flow cytometry. Ratios (%) of WT/B95-8 divided by ΔmiR EBV-infected B cells are shown. Data are shown as mean values and SD of experiments with 5 to 10 different donors. *P < 0.05, **P < 0.01, ***P < 0.001.
Fig. S2.
Fig. S2.
Predicted miRNA target sites, their mutations, and luciferase assays of selected targets. (A) Partial sequences of 3′UTRs of selected transcripts analyzed in Fig. 3C and in B below are shown with corresponding miRNAs and mutations within the 3′UTRs in the reporter vectors. Complementarities are based on in silico predictions according to the RNAhybrid algorithm and depicted as Watson–Crick (‘|’) or G:U (‘:’) pairs. Nonmatching nucleotide residues are indicated (X). (B and C) HEK293T cells were cotransfected with miRNA expression plasmids and luciferase reporter plasmids carrying either a wild-type or mutated 3′UTR of IPO7 (B) or the 3′UTR of HLA-B*07/B*08 (C). The luciferase activities were normalized to lysates from cells cotransfected with the wild-type 3′UTR reporter and an empty plasmid in place of a miRNA plasmid. Data are shown as mean values and SD of three replicates. Mut, mutated 3′UTR; WT, wild-type 3′UTR; ∅, empty plasmid.
Fig. 4.
Fig. 4.
EBV miRNAs control recognition of diverse types of CD8+ T-cell epitopes. (A) Schematic overview of the experiments shown in B, C, F, and G of this figure. The presentation of viral epitopes from B cells infected with WT/B95-8 or ΔmiR EBV was analyzed with epitope-specific CD8+ T-cell clones or polyclonal lines. Equal numbers of B and T cells were cocultured for 16 h, and IFN-γ release was measured by ELISA at the indicated time points. (B and C) The presentation of two LMP2 epitopes by infected B cells was analyzed with CD8+ T-cell clones specific for the HLA-B*40:01–restricted IED epitope (B) or the HLA-A*02:01–restricted FLY (C) epitope. A representative time course experiment with mean values and SD of three replicates (Left in B and C) and the summary of all experiments performed 15 dpi with B cells from five different donors (Right in B and C) are shown. Results are normalized to values of ΔmiR EBV-infected cells. (D) Relative transcript levels of LMP1, LMP2, and EBNA1 were assessed by quantitative RT-PCR in B cells infected with WT/B95-8 or ΔmiR EBV at day 15 post infection. Transcript levels are normalized as in Fig. 3A. LMP1 is a known target of viral miRNAs (43, 44) and was used here as a positive control. Data are shown as mean values and SD of five donors. (E) Western blot analysis of EBNA1 and LMP2 in B cells infected with WT/B95-8 or ΔmiR EBV 15 dpi. Representative examples (Left) and protein levels relative to Tubulin (Right) are shown. The result from ΔmiR EBV-infected cells was set to 100%. Data are shown as mean values and SD of four different donors. (F) Recognition of the HLA-B*35:01–restricted EBNA1 epitope HPV presented by infected B cells as in B and C. (G) IL-12 neutralization reduces the activation of an epitope-specific CD8+ T-cell clone. Infected B cells (15 dpi) were cocultured as in C (Right) with the FLY-specific T-cell clone together with an anti-IL12B antibody or a control antibody of the same isotype (2.5 μg/mL). After 16 h, IFN-γ release was measured by ELISA. An overview of three experiments with different donors is shown. (H) Equal numbers of infected B cells and polyclonal EBV-specific CD8+ T cells were cocultured together with an anti-IL12B antibody or a control antibody of the same isotype (2.5 μg/mL). After 16 h, IFN-γ release was measured by ELISA. Results from two different donors are shown. *P < 0.05. **P < 0.01.
Fig. S3.
Fig. S3.
IL-12 neutralization barely reduces the activation of EBV-specific CD4+ T cells. Equal numbers of infected B cells (5 dpi) were cocultured with polyclonal EBV-specific CD4+ T cells together with an anti–IL-12B antibody or a control antibody of the same isotype (2.5 μg/mL). After 16 h, IFN-γ release was measured by ELISA. One representative experiment out of four with different donors is shown.

Similar articles

Cited by

References

    1. van Baarle D, et al. Dysfunctional Epstein-Barr virus (EBV)-specific CD8(+) T lymphocytes and increased EBV load in HIV-1 infected individuals progressing to AIDS-related non-Hodgkin lymphoma. Blood. 2001;98(1):146–155. - PubMed
    1. Smets F, et al. Ratio between Epstein-Barr viral load and anti-Epstein-Barr virus specific T-cell response as a predictive marker of posttransplant lymphoproliferative disease. Transplantation. 2002;73(10):1603–1610. - PubMed
    1. Landgren O, et al. Risk factors for lymphoproliferative disorders after allogeneic hematopoietic cell transplantation. Blood. 2009;113(20):4992–5001. - PMC - PubMed
    1. Heslop HE, et al. Long-term outcome of EBV-specific T-cell infusions to prevent or treat EBV-related lymphoproliferative disease in transplant recipients. Blood. 2010;115(5):925–935. - PMC - PubMed
    1. Moosmann A, et al. Effective and long-term control of EBV PTLD after transfer of peptide-selected T cells. Blood. 2010;115(14):2960–2970. - PubMed

Publication types

MeSH terms