

Integrative genomic and functional analysis of human oral squamous cell carcinoma cell lines reveals synergistic effects of FAT1 and CASP8 inactivation
- PMID: 27693639
- PMCID: PMC5090049
- DOI: 10.1016/j.canlet.2016.09.014
Integrative genomic and functional analysis of human oral squamous cell carcinoma cell lines reveals synergistic effects of FAT1 and CASP8 inactivation
Abstract
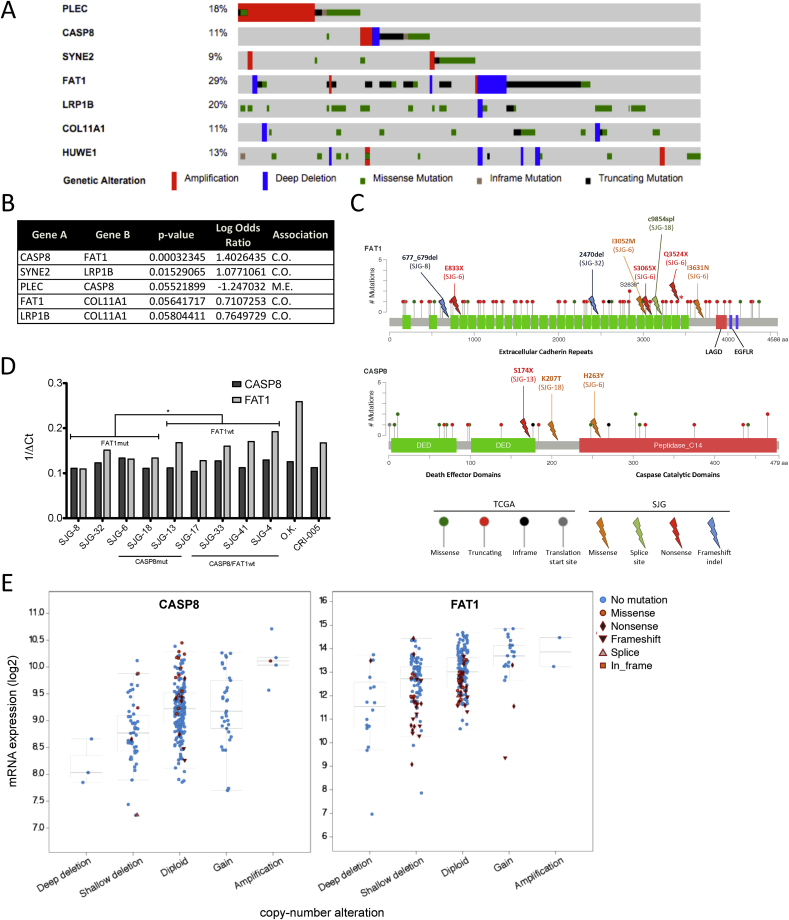
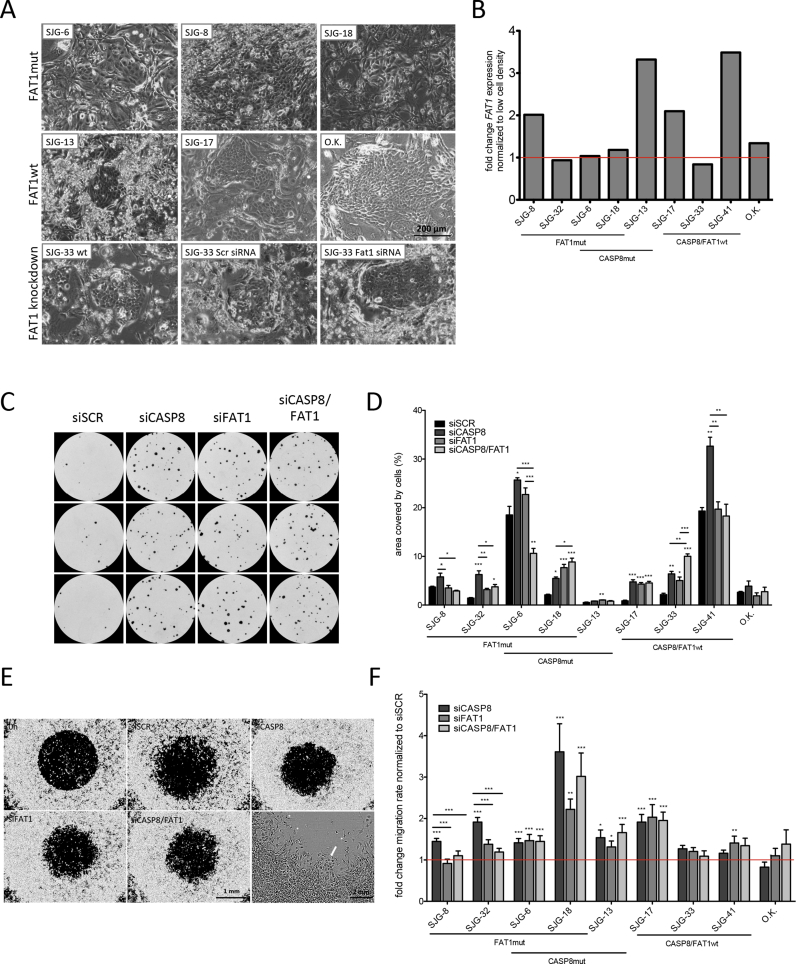
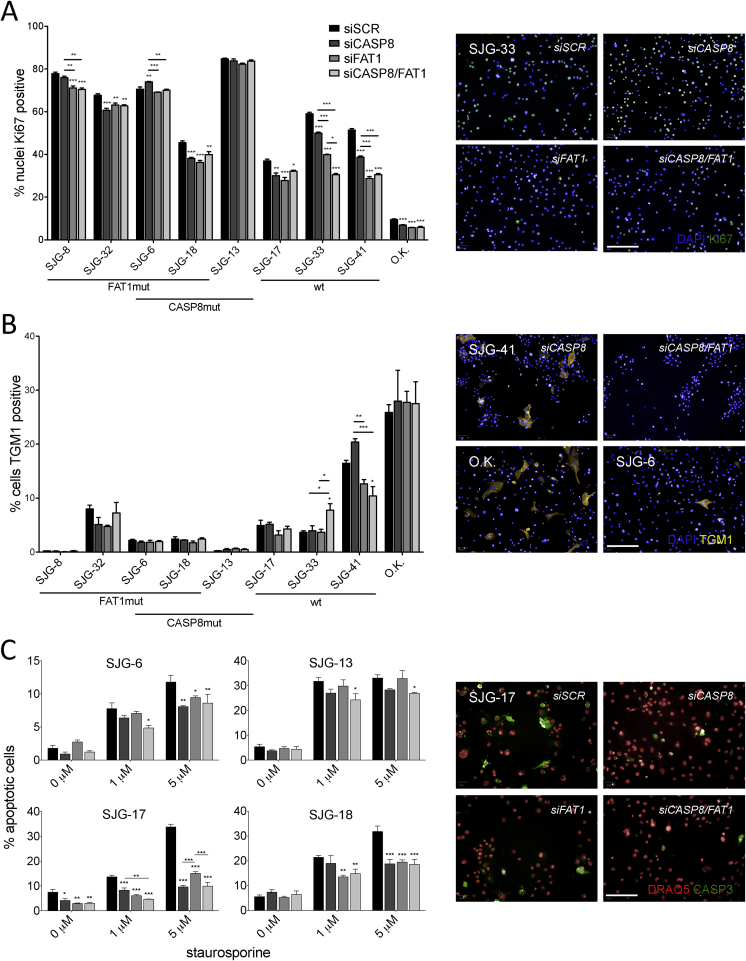
Oral squamous cell carcinoma (OSCC) is genetically highly heterogeneous, which contributes to the challenges of treatment. To create an in vitro model that accurately reflects this heterogeneity, we generated a panel of HPV-negative OSCC cell lines. By whole exome sequencing of the lines and matched patient blood samples, we demonstrate that the mutational spectrum of the lines is representative of primary OSCC in The Cancer Genome Atlas. We show that loss of function mutations in FAT1 (an atypical cadherin) and CASP8 (Caspase 8) frequently occur in the same tumour. OSCC cells with inactivating FAT1 mutations exhibited reduced intercellular adhesion. Knockdown of FAT1 and CASP8 individually or in combination in OSCC cells led to increased cell migration and clonal growth, resistance to Staurosporine-induced apoptosis and, in some cases, increased terminal differentiation. The OSCC lines thus represent a valuable resource for elucidating the impact of different mutations on tumour behaviour.
Keywords: Caspase 8; FAT1; Oral squamous cell carcinoma; Whole exome sequencing.
Copyright © 2016 The Authors. Published by Elsevier Ireland Ltd.. All rights reserved.
Figures

Similar articles
-
LncRNA UCA1 promotes proliferation and cisplatin resistance of oral squamous cell carcinoma by sunppressing miR-184 expression.Cancer Med. 2017 Dec;6(12):2897-2908. doi: 10.1002/cam4.1253. Epub 2017 Nov 10. Cancer Med. 2017. PMID: 29125238 Free PMC article.
-
Silencing JARID1B suppresses oncogenicity, stemness and increases radiation sensitivity in human oral carcinoma.Cancer Lett. 2015 Nov 1;368(1):36-45. doi: 10.1016/j.canlet.2015.07.003. Epub 2015 Jul 13. Cancer Lett. 2015. PMID: 26184998
-
The Proteomic Landscape of Growth Factor Signaling Networks Associated with FAT1 Mutations in Head and Neck Cancers.Cancer Res. 2021 Sep 1;81(17):4402-4416. doi: 10.1158/0008-5472.CAN-20-3659. Epub 2021 Jun 24. Cancer Res. 2021. PMID: 34167951 Free PMC article.
-
Translational genomics and recent advances in oral squamous cell carcinoma.Semin Cancer Biol. 2020 Apr;61:71-83. doi: 10.1016/j.semcancer.2019.09.011. Epub 2019 Sep 19. Semin Cancer Biol. 2020. PMID: 31542510 Review.
-
Role of epigenetics in OSCC: an understanding above genetics.Med Oncol. 2023 Mar 20;40(4):122. doi: 10.1007/s12032-023-01992-0. Med Oncol. 2023. PMID: 36941511 Review.
Cited by
-
[Expression of FAT1 in Lung Adenocarcinoma and Its Relationship with Immune Cell Infiltration].Zhongguo Fei Ai Za Zhi. 2024 Feb 20;27(2):109-117. doi: 10.3779/j.issn.1009-3419.2024.102.01. Zhongguo Fei Ai Za Zhi. 2024. PMID: 38453442 Free PMC article. Chinese.
-
Higher overall survival rates of oral squamous cell carcinoma treated with metronomic neoadjuvant chemotherapy.Am J Cancer Res. 2024 Mar 15;14(3):1033-1051. doi: 10.62347/EYNT8387. eCollection 2024. Am J Cancer Res. 2024. PMID: 38590400 Free PMC article.
-
Whole-Exome Sequencing Analysis of Oral Squamous Cell Carcinoma Delineated by Tobacco Usage Habits.Front Oncol. 2021 May 31;11:660696. doi: 10.3389/fonc.2021.660696. eCollection 2021. Front Oncol. 2021. PMID: 34136393 Free PMC article.
-
Tumour Genetic Heterogeneity in Relation to Oral Squamous Cell Carcinoma and Anti-Cancer Treatment.Int J Environ Res Public Health. 2023 Jan 29;20(3):2392. doi: 10.3390/ijerph20032392. Int J Environ Res Public Health. 2023. PMID: 36767758 Free PMC article. Review.
-
The FAT1 Cadherin Drives Vascular Smooth Muscle Cell Migration.Cells. 2023 Jun 14;12(12):1621. doi: 10.3390/cells12121621. Cells. 2023. PMID: 37371091 Free PMC article. Review.
References
-
- Ferlay J., Shin H.-R., Bray F., Forman D., Mathers C., Parkin D.M. Estimates of worldwide burden of cancer in 2008: GLOBOCAN 2008. Int. J. Cancer. 2010;127:2893–2917. - PubMed
-
- Leemans C.R., Braakhuis B.J., Brakenhoff R.H. The molecular biology of head and neck cancer. Nat. Rev. Cancer. 2011;11:9–22. - PubMed
MeSH terms
Substances
Grants and funding
LinkOut - more resources
Full Text Sources
Other Literature Sources
Medical
Research Materials
Miscellaneous
