. 2016 Oct 10;39(1):13-27.
doi: 10.1016/j.devcel.2016.08.003. Epub 2016 Sep 29.

TRIMs and Galectins Globally Cooperate and TRIM16 and Galectin-3 Co-direct Autophagy in Endomembrane Damage Homeostasis

Affiliations

TRIMs and Galectins Globally Cooperate and TRIM16 and Galectin-3 Co-direct Autophagy in Endomembrane Damage Homeostasis

Santosh Chauhan et al. Dev Cell. .

Abstract

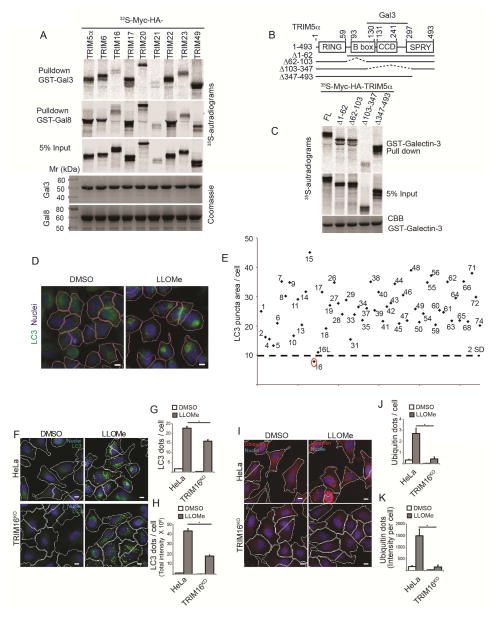
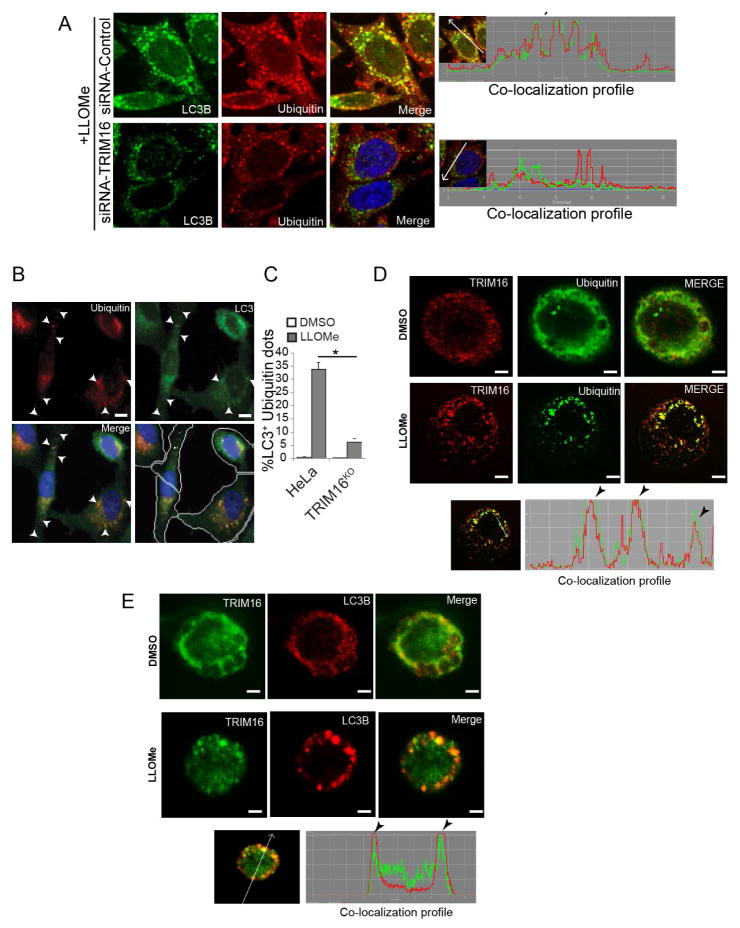
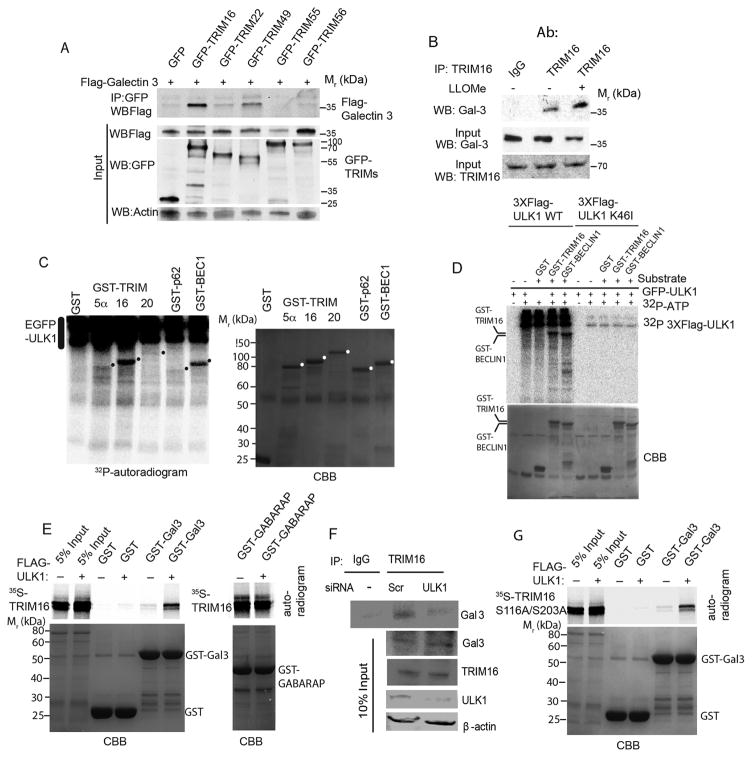
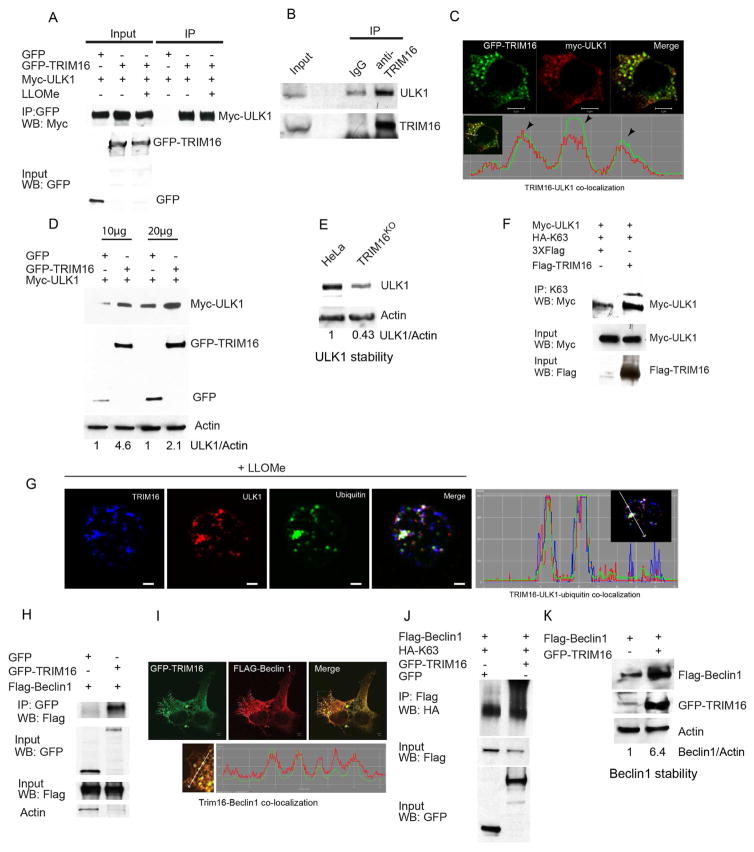
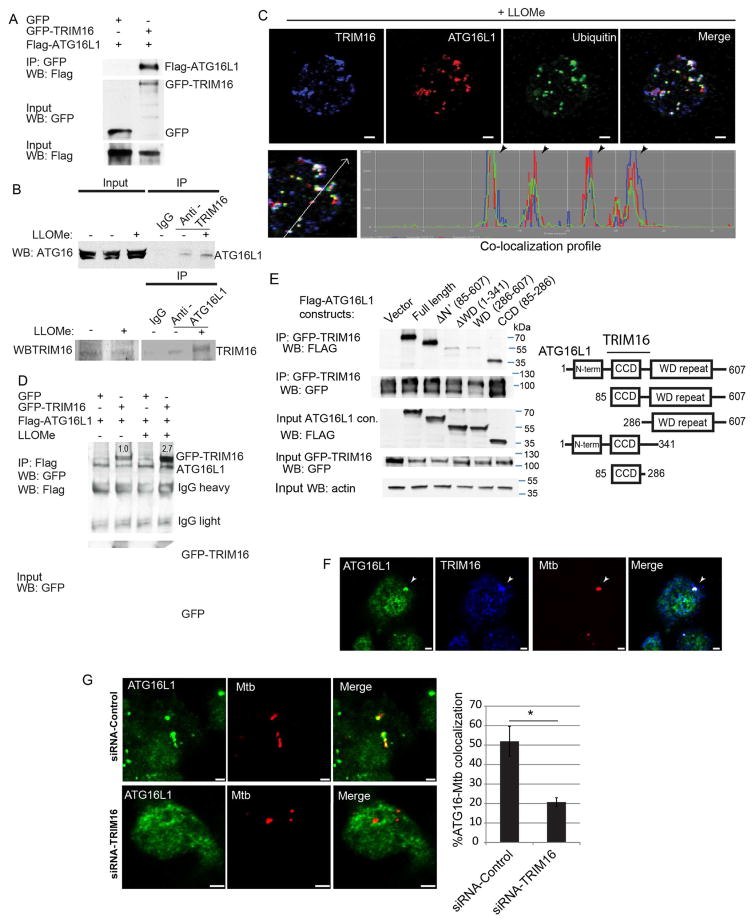
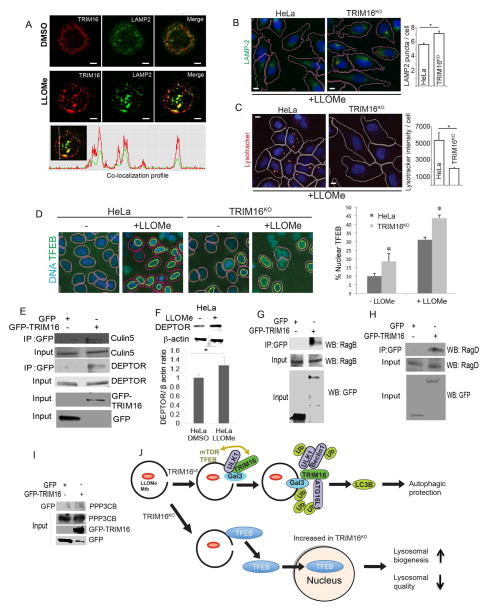
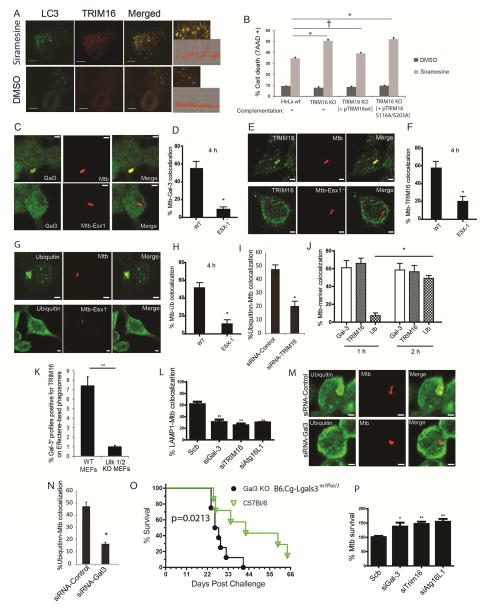
Selective autophagy performs an array of tasks to maintain intracellular homeostasis, sterility, and organellar and cellular functionality. The fidelity of these processes depends on precise target recognition and limited activation of the autophagy apparatus in a localized fashion. Here we describe cooperation in such processes between the TRIM family and Galectin family of proteins. TRIMs, which are E3 ubiquitin ligases, displayed propensity to associate with Galectins. One specific TRIM, TRIM16, interacted with Galectin-3 in a ULK1-dependent manner. TRIM16, through integration of Galectin- and ubiquitin-based processes, coordinated recognition of membrane damage with mobilization of the core autophagy regulators ATG16L1, ULK1, and Beclin 1 in response to damaged endomembranes. TRIM16 affected mTOR, interacted with TFEB, and influenced TFEB's nuclear translocation. The cooperation between TRIM16 and Galectin-3 in targeting and activation of selective autophagy protects cells from lysosomal damage and Mycobacterium tuberculosis invasion.


Figures

Figure 1
Figure 1. TRIMs and Galectins interact
(A) GST pulldowns of in vitro translated and radiolabeled 35S-Myc-HA-TRIMs (as indicted) with GST-Galectin-3 and GST-Galectin-8. (B) Mapping of Galectin-3 interaction domain within TRIM5α. Deletion constructs of TRIM5a used in C. (C) TRIM5α constructs depicted in B were radiolabeled as in A and subjected to GST-pulldowns. with GST-Galectin-3. (D–E) siRNA screen of human TRIMs (identified by TRIM numbers) for effects on LLOMe-induced autophagosome formation by high content microscopy and automated image acquisition and quantification (HC). Panels in D, program-assigned masks superimposed on epifluorescent images of HeLa cells treated with LLOMe or DMSO vehicle. Pink mask, automatically defined cell boundaries (primary objects). Blue, nuclei stained with Hoechst 3342 (10 μg/ml). Red mask, machine identified endogenous LC3 puncta (target objects). Scale bar, 10 μm. Graph in E, Autophagosome abundance (total area of endogenous LC3 puncta/cell; staining with 1:500 antibody against LC3B; PM036 from MBL) in cells subjected to TRIM knockdowns in 96 well plates and treated with 0.5 mM LLOMe for 2 h (E). Dashed line, 2 SD below the mean (cumulative, LC3 puncta area/cell) for all TRIMs tested. N≥500 cells imaged per well. (F–H) Autophagic response (HC, LC3 puncta) to LLOMe (0.5 mM, 2 h) in HeLa cells and their CRISPR TRIM16KO mutant derivative A9. (I–K) Ubiqutination response, revealed with FK2 mouse monoclonal antibody (1:500 dilution; MBL D058-3) and quantified by HC (ubiquitin puncta, yellow mask) in HeLa vs. TRIM16KO HeLa mutant A9. Same conditions as in F–H. Data: means (n>3); t-test *, p < 0.05.
Figure 2
Figure 2. Colocalization between TRIM16, ubiquitin and LC3B
(A) Confocal microscopy analysis of endogenous LC3B puncta and endogenous ubiquitin profiles localization in cells knocked down for TRIM16. Right, line tracers showing fluorescence peaks. (B–C) HC analysis of LC3B and ubiquitin profiles colocalization (%) in HeLa cells and CRISPR TRIM16KO mutant (A9) exposed to 0.5 mM LLOMe for 2 h. Yellow mask, ubiquitin puncta. Scale bar, 10 μm. (D,E) Confocal image analysis of THP1 cells untreated or treated with 0.5 mM LLOMe and immunostained for endogenous TRIM16, ubiquitin or LC3B. Bottom panels, line tracings representing fluorescence peaks. Scale bar, 10 μm.
Figure 3
Figure 3. TRIM16 is phosphorylated by ULK1 and interacts with Galectin-3 in the presence of ULK1 as a platform
(A) Co-immunoprecipitation (Co-IP) analysis of interaction between Galectin-3 and a panel of TRIMs in HEK293T cell lysates expressing GFP or GFP-TRIM fusions and Flag-Galectin-3. (B) Co-IP analysis of endogenous TRIM16 and endogenous Galectin-3 in the absence and presence of LLOMe. (C) Indicated GST-fusion proteins were incubated in a phosphorylation reaction (with γ32P ATP) with EGFP-ULK1 enriched from HEK293T cells and products separated by PAGE. Left, autoradiogram; right, coommassie brilliant blue (CBB). Dots, position of GST-fusion protein bands on the CBB gel. (D) Flag-ULK1 wt or K46I catalytic ULK1 mutant were incubated with GST fusion protein substrates and processed as in C. (E) In vitro translated and radiolabeled [35S] myc-HA-TRIM16 wild type incubated with potential interactors in the presence (+) or absence (−) of Flag-ULK1 and cold ATP, GST pulldowns performed and amount of [35S] radiolabeled Myc-HA-TRIM16 determined by PAGE and autoradiography. Amounts of GST fusion proteins are shown in coommassie brilliant blue (CBB)-stained gels (F) Co-IP analysis of interactions between endogenous TRIM16 and Gal3 proteins in HeLa cells knocked down for ULK1 by siRNA. (G) GST pulldown analysis as in E, using [35S] myc-HA-TRIM16-S116A/S203A mutant instead of wild type TRIM16. Note that both wt (in E) and the ULK1-non-phosphorylatable TRIM16-S116A/S203A (in G) mutant promote association between TRIM16 and Galectin-3.
Figure 4
Figure 4. TRIM16 interacts, co-localizes with, and stabilizes ULK1 and Beclin 1
(A) Co-IP analysis of TRIM16 and ULK1 interactions in HEK293T lysates from cells expressing GFP or GFP-TRIM16 and Myc-ULK1. (B) Co-IP analysis of interactions between endogenous TRIM16 and endogenous ULK1 (HeLa lysates). (C) Confocal microscopy images of HEK293T cells transiently expressing GFP-TRIM16 and Myc-ULK1, and co-localization trace profiles. (D) HEK293T cell lysates co-expressing Myc-ULK1 and either GFP or GFP-TRIM16 were subjected to immunoblotting analysis. (E) Western blot analysis of relative abundance of endogenous ULK1 in wild type HeLa and CRISPR TRIM16KO HeLa derivative A9. (F) Analysis of ULK1 ubiquitination in cells co-expressing Myc-ULK1 and HA-tagged ubiquitin C mutated for all lysines except Lysine 63 (HA-K63) in the absence and presence of Flag-TRIM16. Immunoprecipitation was performed with K63 antibody followed by the Western blotting (WB) with indicated antibodies. (G) Confocal images of THP1 cells (treated with LLOMe); immunofluorescence with TRIM16, ULK1 and ubiquitin antibodies. Right, co-localization tracer profile along the line indicated in the inset. (H) Co-IP analysis of interactions between TRIM16 and Beclin1 in HEK293T lysates of cells expressing GFP or GFP-TRIM16 and Flag-Beclin1. (I) Confocal images of HEK293T cells transiently expressing GFP-TRIM16 and Flag-Beclin 1. Co-localization profile tracer along line indicated in the enlarged region. (J) Analysis of Beclin 1 ubiquitination in cells co-expressing Flag-Beclin 1 and HA-tagged Ubiquitin C (HA-K63) and either GFP or GFP-TRIM16. IP, immunoprecipitation performed with Flag antibody, followed by WB (Western blotting) with indicated antibodies. (K) HEK293T cell lysates expressing Flag-Beclin 1 in absence and presence GFP-TRIM16 were subjected to immunoblotting with antibodies as indicated.
Figure 5
Figure 5. TRIM16 interacts with and recruits ATG16L1 in response to endomembrane damage
(A) Co-IP analysis of interaction between TRIM16 and ATG16L1 in HEK293T lysates from cells co-expressing GFP or GFP-TRIM16 with Flag-ATG16L1. (B) Co-IP and reverse Co-IP analyses of interaction between endogenous TRIM16 and endogenous ATG16L1 in resting and LLOMe-treated HeLa cells. (C) Confocal images of THP1 cells treated with LLOMe and processed for immunofluorescence microscopy analysis with TRIM16, ATG16L1 and ubiquitin antibodies. Bottom, co-localization profile measurement along straight line using LSM510 software. (D) Co-IP analysis of interactions between TRIM16 and ATG16L1 from LLOMe treated and untreated HEK293T cell lysates co-expressing GFP or GFP-TRIM16 with Flag-ATG16L1. (E) Mapping of ATG16L1 regions interacting with TRIM16. Lysates of HEK293T cells co-expressing GFP-TRIM16 and Flag-ATG16L1 variants (see scheme, right panel) were subjected to immunoprecipitation with anti-GFP and blots were probed as indicated. (F) Confocal images of RAW264.7 macrophage cell line infected with Alexa-568-labeled M. tuberculosis Erdman and immunostained for ATG16L1 and TRIM16. (G) RAW264.7 cells were transfected with siRNAs against TRIM16 or control siRNAs for 48 h. Cells were then infected with Alexa-568-labeled M. tuberculosis Erdman for 4 h followed by immunofluorescence staining for ATG16L1. Data, means ± SEM; n=3 (at least 100 phagosomes per condition); *, p<0.05 (t-test). Bar, 2 μm.
Figure 6
Figure 6. TRIM16 is required for lysosomal quality control and function
(A) Confocal immunofluorescence microscopy images of THP1 cells untreated or treated with 0.5 mM LLOMe and stained for endogenous TRIM16 and LAMP2. (B) HC analysis of lysosome abundance (green, anti-LAMP2 staining; blue, Hoeschst 3342 nuclear stain) in HeLa cells or their CRISPR TRIM16KO derivative A9 following 1 mM LLOMe treatment for 2 h. (C) HC analysis of lysosomal acidification (Lysotracker Red) in HeLa cells or their CRISPR TRIM16KO derivative A9 following 1 mM LLOMe treatment for 2 h. (D) HC analysis of nuclear partition of TFEB in resting HeLa cells vs. their CRISPR TRIM16KO derivative cells (A9), and translocation of TFEB to the nucleus upon LLOMe treatment. HC masks: pink, nuclei (blue, Hoechst stain), yellow, nuclear TFEB (green fluorescence, Alexa-488). Data: means (n>3); t-test *, p < 0.05. All HC experiments were carried out in 96 well plates, with >12 wells/condition with >500 valid objects/well. (E) Co-IP analysis of interaction between GFP-TRIM16 and endogenous DEPTOR and Cullin-5 in HEK293T lysates from cells expressing GFP or GFP-TRIM16. (F) Levels of DEPTOR in extracts of HeLa cells subjected to LLOMe-induced lysosomal damage (1 mM LLOMe, 2_h) (G,H) Co-IP analysis of interactions between GFP-TRIM16 and endogenous RagB (G) or RagD (H) in HEK293T lysates from cells expressing GFP or GFP-TRIM16. (I) Co-IP analysis of interactions between GFP-TRIM16 and endogenous calcineurin catalytic subunit isoform β (PPP3CB) as in E, G and H. (J) Model of TRM16 action and consequences of its absence. Top, pictorial summary of relationships in wild type TRIM16 cells. Bottom, a depiction of what happens in the absence of TRIM16-dependent homeostatic repair of lysosomal membranes.
Figure 7
Figure 7. TRIM16-Galectin-3 system protects against endomembrane damage associated with lysosomal dysfunction and pathogen-mediated phagosomal perforation
(A) Confocal images of HeLa cells treated with DMSO or siramesine; immunofluorescence, endogenous LC3B and TRIM16 revealed with corresponding antibodies. Graphs on the right, line tracing colocalization analyses. (B) HeLa, CRISPR TRIM16KO HeLa cells A9, or TRIM16KO HeLa cells A9 transfected with expression plasmids for wt TRIM16 or TRIM16S116A/S203A mutant were incubated with siramesine and cell death was measured using 7AAD nuclear staining. Data, means; n>3; †, p ≥ 0.05 *, p < 0.05 (ANOVA). (C,D) RAW264.7 macrophages were infected with Alexa-568-labeled wild-type M. tuberculosis Erdman or its ESX-1 mutant at MOI=10 for 4 h and then processed for confocal microscopy analysis of M. tuberculosis (Mtb) colocalization with Galectin-3. Data, means ± SEM (n>3; at least 100 Mtb phagosomes per condition were quantified); *, p<0.05 (t-test). Bar 2 μm. (E,F) RAW264.7 macrophages were infected with Alexa-568-labeled wild-type Mtb Erdman (WT) or its ESX-1 mutant at MOI=10 for 4 h and then processed for confocal microscopy analysis for the colocalization of Mtb with TRIM16. Data and statistics as in E. (G,H) RAW264.7 cells were infected with Alexa-568-labeled Mtb wild-type Erdman or its ESX-1 mutant for 4 h and then processed for immunofluorescence staining with anti-ubiquitin. Data and statistics as in D. (I) RAW264.7 macrophages were transfected with siRNAs against TRIM16 or control siRNAs for 48 h. Cells were then infected with Alexa-568-labeled wild-type Mtb Erdman for 4 h and processed for confocal microscopy analysis for the colocalization of Mtb with ubiquitin. Data and statistics as in D. (J) Time course of marker appearance on Mtb phagosomes; RAW264.7 macrophages were infected with Alexa-568-labeled wild-type M. tuberculosis Erdman at MOI=10 for 1 and 2 h and processed and data analyzed as in panels C–H. (K) Effectene-coated beads were phagocytosed by MEFs in 96 well plates, incubated for up to 24 h (> 3h), stained with antibodies, and processed for HC microscopy (see images in Figure S7D). Data: means (n>3); t-test *, p < 0.05. Ninety six-well plates, with >12 wells/condition with >500 valid objects/well. (L) RAW264.7 cells were transfected with siRNAs against TRIM16, Galectin-3, or ATG16L1 or control siRNAs for 48 h. Cells were then infected with Alexa-568-labeled wild-type Mtb Erdman for 4 h followed by immunofluorescence staining for LAMP1 and % colocalization of Mtb phagosomes with LAMP1 determined (for representative images see Figure S7G). Data, means ± SEM (n=3; at least 100 Mtb phagosomes per condition were quantified). (M,N) RAW264.7 cells were transfected with siRNAs against Galectin-3 or control siRNAs for 48 h. Cells were then infected with Alexa-568-labeled wild-type Mtb Erdman for 4 h followed by immunofluorescence staining for ubiquitin. Data and statistics as in L. (O) Survival of wt C57BL and Galectin-3 C57BL knockout mice in a short-term acute infection model (high dose; 1-3xe3 CFU) with M. tuberculosis Erdman aerosols. For data from a chronic model of infection with lower doses of M. tuberculosis, see Figure S7J,K). (P) RAW264.7 cells were transfected with siRNAs against TRIM16, Galectin-3, or ATG16L1 or control siRNAs for 48 h. Cells were then infected with wild-type Mtb Erdman for 1 h (t=0) at MOI=10. Cells were then washed three times with complete medium to remove uninternalized mycobacteria and then continued to grow in complete medium for another 24 h (t=24). Cells were then harvested for CFU analysis of Mtb intracellular survival. Data, means ± SEM of CFU at t=24 normalized to CFU at t=0 (n>3 independent experiments). *p < 0.05 and **p < 0.01, t-test relative to the scrambled (control) siRNA set at 100%.

Comment in

Similar articles

Cited by

References

    1. Aits S, Kricker J, Liu B, Ellegaard AM, Hamalisto S, Tvingsholm S, Corcelle-Termeau E, Hogh S, Farkas T, Holm Jonassen A, et al. Sensitive detection of lysosomal membrane permeabilization by lysosomal galectin puncta assay. Autophagy. 2015;11:1408–1424. - PMC - PubMed
    1. Antonioli M, Albiero F, Nazio F, Vescovo T, Perdomo AB, Corazzari M, Marsella C, Piselli P, Gretzmeier C, Dengjel J, et al. AMBRA1 interplay with cullin E3 ubiquitin ligases regulates autophagy dynamics. Dev Cell. 2014;31:734–746. - PubMed
    1. Arthur CM, Baruffi MD, Cummings RD, Stowell SR. Evolving mechanistic insights into galectin functions. Methods Mol Biol. 2015;1207:1–35. - PMC - PubMed
    1. Bar-Peled L, Sabatini DM. Regulation of mTORC1 by amino acids. Trends Cell Biol. 2014;24:400–406. - PMC - PubMed
    1. Beatty WL, Rhoades ER, Hsu DK, Liu FT, Russell DG. Association of a macrophage galactoside-binding protein with Mycobacterium-containing phagosomes. Cell Microbiol. 2002;4:167–176. - PubMed

MeSH terms

Substances