Review
. 2016 Nov-Dec;36(7):1987-2006.
doi: 10.1148/rg.2016160042. Epub 2016 Sep 30.

Elastography in Chronic Liver Disease: Modalities, Techniques, Limitations, and Future Directions

Affiliations
Review

Elastography in Chronic Liver Disease: Modalities, Techniques, Limitations, and Future Directions

Aparna Srinivasa Babu et al. Radiographics. 2016 Nov-Dec.

Abstract

Chronic liver disease has multiple causes, many of which are increasing in prevalence. The final common pathway of chronic liver disease is tissue destruction and attempted regeneration, a pathway that triggers fibrosis and eventual cirrhosis. Assessment of fibrosis is important not only for diagnosis but also for management, prognostic evaluation, and follow-up of patients with chronic liver disease. Although liver biopsy has traditionally been considered the reference standard for assessment of liver fibrosis, noninvasive techniques are the emerging focus in this field. Ultrasound-based elastography and magnetic resonance (MR) elastography are gaining popularity as the modalities of choice for quantifying hepatic fibrosis. These techniques have been proven superior to conventional cross-sectional imaging for evaluation of fibrosis, especially in the precirrhotic stages. Moreover, elastography has added utility in the follow-up of previously diagnosed fibrosis, the assessment of treatment response, evaluation for the presence of portal hypertension (spleen elastography), and evaluation of patients with unexplained portal hypertension. In this article, a brief overview is provided of chronic liver disease and the tools used for its diagnosis. Ultrasound-based elastography and MR elastography are explored in depth, including a brief glimpse into the evolution of elastography. Elastography is based on the principle of measuring tissue response to a known mechanical stimulus. Specific elastographic techniques used to exploit this principle include MR elastography and ultrasonography-based static or quasistatic strain imaging, one-dimensional transient elastography, point shear-wave elastography, and supersonic shear-wave elastography. The advantages, limitations, and pitfalls of each modality are emphasized. ©RSNA, 2016.


Figures

Figure 1a.
Figure 1a.
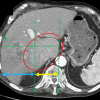
Anatomic imaging of cirrhosis in four patients. (a) Axial contrast material–enhanced CT image of a 63-year-old man with cirrhosis shows the nodular contour of the liver surface, a finding that indicates cirrhosis. (b) Axial contrast-enhanced CT image of a 53-year-old man with cirrhosis shows caudate lobe hypertrophy (red oval). Green line 1 is a vertical line drawn through the lateral border of the main portal vein, green line 2 is a vertical line drawn through the left lateral border of the caudate lobe, and green line 3 is a horizontal line midway between the hepatic vein and the main portal vein, drawn perpendicular to lines 1 and 2. Caudate lobe and right lobe widths are indicated by the yellow and blue double-headed arrows, respectively. A ratio of the caudate lobe width to the right lobe width that is more than 0.65 is considered 100% specific for cirrhosis. (c) Coronal gadolinium-enhanced T1-weighted MR image of a 60-year-old man with cirrhosis and portal hypertension shows a dilated portal vein measuring 1.51 cm in diameter (black line) and ascites, findings that are indicative of portal hypertension, an indirect sign of cirrhosis. (d) Axial contrast-enhanced CT image of a 74-year-old woman with cirrhosis and portal hypertension shows paraesophageal varices (circle), a finding that indicates portal hypertension resulting in collateralization. This finding is another indirect sign of cirrhosis.
Figure 1b.
Figure 1b.
Anatomic imaging of cirrhosis in four patients. (a) Axial contrast material–enhanced CT image of a 63-year-old man with cirrhosis shows the nodular contour of the liver surface, a finding that indicates cirrhosis. (b) Axial contrast-enhanced CT image of a 53-year-old man with cirrhosis shows caudate lobe hypertrophy (red oval). Green line 1 is a vertical line drawn through the lateral border of the main portal vein, green line 2 is a vertical line drawn through the left lateral border of the caudate lobe, and green line 3 is a horizontal line midway between the hepatic vein and the main portal vein, drawn perpendicular to lines 1 and 2. Caudate lobe and right lobe widths are indicated by the yellow and blue double-headed arrows, respectively. A ratio of the caudate lobe width to the right lobe width that is more than 0.65 is considered 100% specific for cirrhosis. (c) Coronal gadolinium-enhanced T1-weighted MR image of a 60-year-old man with cirrhosis and portal hypertension shows a dilated portal vein measuring 1.51 cm in diameter (black line) and ascites, findings that are indicative of portal hypertension, an indirect sign of cirrhosis. (d) Axial contrast-enhanced CT image of a 74-year-old woman with cirrhosis and portal hypertension shows paraesophageal varices (circle), a finding that indicates portal hypertension resulting in collateralization. This finding is another indirect sign of cirrhosis.
Figure 1c.
Figure 1c.
Anatomic imaging of cirrhosis in four patients. (a) Axial contrast material–enhanced CT image of a 63-year-old man with cirrhosis shows the nodular contour of the liver surface, a finding that indicates cirrhosis. (b) Axial contrast-enhanced CT image of a 53-year-old man with cirrhosis shows caudate lobe hypertrophy (red oval). Green line 1 is a vertical line drawn through the lateral border of the main portal vein, green line 2 is a vertical line drawn through the left lateral border of the caudate lobe, and green line 3 is a horizontal line midway between the hepatic vein and the main portal vein, drawn perpendicular to lines 1 and 2. Caudate lobe and right lobe widths are indicated by the yellow and blue double-headed arrows, respectively. A ratio of the caudate lobe width to the right lobe width that is more than 0.65 is considered 100% specific for cirrhosis. (c) Coronal gadolinium-enhanced T1-weighted MR image of a 60-year-old man with cirrhosis and portal hypertension shows a dilated portal vein measuring 1.51 cm in diameter (black line) and ascites, findings that are indicative of portal hypertension, an indirect sign of cirrhosis. (d) Axial contrast-enhanced CT image of a 74-year-old woman with cirrhosis and portal hypertension shows paraesophageal varices (circle), a finding that indicates portal hypertension resulting in collateralization. This finding is another indirect sign of cirrhosis.
Figure 1d.
Figure 1d.
Anatomic imaging of cirrhosis in four patients. (a) Axial contrast material–enhanced CT image of a 63-year-old man with cirrhosis shows the nodular contour of the liver surface, a finding that indicates cirrhosis. (b) Axial contrast-enhanced CT image of a 53-year-old man with cirrhosis shows caudate lobe hypertrophy (red oval). Green line 1 is a vertical line drawn through the lateral border of the main portal vein, green line 2 is a vertical line drawn through the left lateral border of the caudate lobe, and green line 3 is a horizontal line midway between the hepatic vein and the main portal vein, drawn perpendicular to lines 1 and 2. Caudate lobe and right lobe widths are indicated by the yellow and blue double-headed arrows, respectively. A ratio of the caudate lobe width to the right lobe width that is more than 0.65 is considered 100% specific for cirrhosis. (c) Coronal gadolinium-enhanced T1-weighted MR image of a 60-year-old man with cirrhosis and portal hypertension shows a dilated portal vein measuring 1.51 cm in diameter (black line) and ascites, findings that are indicative of portal hypertension, an indirect sign of cirrhosis. (d) Axial contrast-enhanced CT image of a 74-year-old woman with cirrhosis and portal hypertension shows paraesophageal varices (circle), a finding that indicates portal hypertension resulting in collateralization. This finding is another indirect sign of cirrhosis.
Figure 2.
Figure 2.
Diagram shows the various elastographic techniques. 1D = one-dimensional.
Figure 3.
Figure 3.
Strain elastography. Gray-scale US image (left) of an 81-year-old woman with invasive papillary carcinoma shows a 1.47-cm complex cystic and solid mass. Strain elastographic image (right) of the same patient shows that the lesion has mixed stiffness, with hard elasticity (red areas indicated by white arrows) correlating to the solid component, and with the cystic component (blue areas indicated by black arrows) appearing soft. (Courtesy of Katie N. Hunt, MD, Breast Imaging Department, Mayo Clinic, Rochester, Minn.)
Figure 4.
Figure 4.
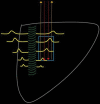
Diagram shows the five basic steps of point shear-wave elastography: (1) An ROI (blue rectangle) is placed at the desired location. (2) A standard transducer is used to apply a US push pulse (green curved lines) that runs alongside the ROI. (3) The resultant tissue compression causes propagation of shear waves (yellow lines) perpendicular to the push pulse. Some of these shear waves traverse the ROI. (4) Multiple detection pulses (red arrows) are sent through the ROI. (5) These detection pulses can be used to calculate the speed of the shear waves by analyzing the returned echoes (yellow arrows). The speed of the shear waves correlates with the tissue stiffness.
Figure 5a.
Figure 5a.
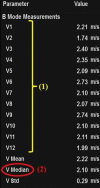
Sample determination of velocity measurement with the use of point shear-wave elastography of a 64-year-old woman with advanced fibrosis secondary to hepatitis C. (a) Tabulation shows velocity measurements. To determine the velocity measurement, step 1 (1) is to obtain 10–12 individual velocity measurements (V1–V12). Step 2 (2) is that the median velocity (V Median) is used for fibrosis assessment. (b) Point shear-wave elastographic image shows one of the individual velocity measurements: velocity measurement 7 (V7) of 2.10 m/sec.
Figure 5b.
Figure 5b.
Sample determination of velocity measurement with the use of point shear-wave elastography of a 64-year-old woman with advanced fibrosis secondary to hepatitis C. (a) Tabulation shows velocity measurements. To determine the velocity measurement, step 1 (1) is to obtain 10–12 individual velocity measurements (V1–V12). Step 2 (2) is that the median velocity (V Median) is used for fibrosis assessment. (b) Point shear-wave elastographic image shows one of the individual velocity measurements: velocity measurement 7 (V7) of 2.10 m/sec.
Figure 6a.
Figure 6a.
US elastography of a 62-year-old woman with hepatitis C and cirrhosis. (a) Tabulation of 12 velocity measurements (V1–V12) shows an increased median velocity (V Median) of 1.92 m/sec (>1.77 m/sec), a finding that classifies the patient into the high-risk category according to a recent consensus conference statement by the Society of Radiologists in Ultrasound (48). This patient will require prioritization for therapy and further follow-up. (b) US elastographic image shows a mixture of colors that is due to the tissue stiffness variation within the ROI. In this and the subsequent US elastographic images, the yellow box (yellow arrows) is the field of view of the shear-wave sample area, and the dashed circle (white arrows) is the location where the actual velocity measurements are obtained and recorded (1 = ROI 1). (c) Conventional transverse US image of the liver surface shows surface nodularity, a finding that indicates cirrhosis.
Figure 6b.
Figure 6b.
US elastography of a 62-year-old woman with hepatitis C and cirrhosis. (a) Tabulation of 12 velocity measurements (V1–V12) shows an increased median velocity (V Median) of 1.92 m/sec (>1.77 m/sec), a finding that classifies the patient into the high-risk category according to a recent consensus conference statement by the Society of Radiologists in Ultrasound (48). This patient will require prioritization for therapy and further follow-up. (b) US elastographic image shows a mixture of colors that is due to the tissue stiffness variation within the ROI. In this and the subsequent US elastographic images, the yellow box (yellow arrows) is the field of view of the shear-wave sample area, and the dashed circle (white arrows) is the location where the actual velocity measurements are obtained and recorded (1 = ROI 1). (c) Conventional transverse US image of the liver surface shows surface nodularity, a finding that indicates cirrhosis.
Figure 6c.
Figure 6c.
US elastography of a 62-year-old woman with hepatitis C and cirrhosis. (a) Tabulation of 12 velocity measurements (V1–V12) shows an increased median velocity (V Median) of 1.92 m/sec (>1.77 m/sec), a finding that classifies the patient into the high-risk category according to a recent consensus conference statement by the Society of Radiologists in Ultrasound (48). This patient will require prioritization for therapy and further follow-up. (b) US elastographic image shows a mixture of colors that is due to the tissue stiffness variation within the ROI. In this and the subsequent US elastographic images, the yellow box (yellow arrows) is the field of view of the shear-wave sample area, and the dashed circle (white arrows) is the location where the actual velocity measurements are obtained and recorded (1 = ROI 1). (c) Conventional transverse US image of the liver surface shows surface nodularity, a finding that indicates cirrhosis.
Figure 7a.
Figure 7a.
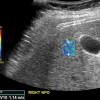
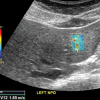
Comparison of right lobe velocity measurement to left lobe velocity measurement obtained by using the point shear-wave elastographic technique in a healthy 37-year-old female volunteer. The higher velocity measurement from the left lobe is likely secondary to compression by the probe, heart, or stomach. (a) Point shear-wave elastographic image of right lobe sample area (circle) shows a velocity of 1.14 m/sec. (b) Point shear-wave elastographic image of left lobe sample area (circle) shows a higher velocity of 1.85 m/sec. NPO = nil per os.
Figure 7b.
Figure 7b.
Comparison of right lobe velocity measurement to left lobe velocity measurement obtained by using the point shear-wave elastographic technique in a healthy 37-year-old female volunteer. The higher velocity measurement from the left lobe is likely secondary to compression by the probe, heart, or stomach. (a) Point shear-wave elastographic image of right lobe sample area (circle) shows a velocity of 1.14 m/sec. (b) Point shear-wave elastographic image of left lobe sample area (circle) shows a higher velocity of 1.85 m/sec. NPO = nil per os.
Figure 8.
Figure 8.
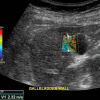
Spuriously elevated velocity measurement in the same healthy 37-year-old female volunteer as in Figure 7. Point shear-wave elastographic image shows sample area (circle) with a velocity measurement of 2.32 m/sec. This high velocity measurement is due to the inclusion of gallbladder wall in the ROI. The gallbladder wall is stiffer, which results in a falsely elevated velocity measurement.
Figure 9a.
Figure 9a.
Effect of depth on velocity measurements obtained with the point shear-wave elastographic technique in a healthy 37-year-old female volunteer. Ideally, velocity measurements should be obtained in the superficial portion of the liver (between 2 cm and 7 cm from the capsule). (a) Point shear-wave elastographic image shows that an appropriately placed ROI has a sample velocity of 1.21 m/sec. (b) Point shear-wave elastographic image shows that an ROI placed at a depth of more than 7 cm from the capsule has a sample velocity of 1.01 m/sec. Measuring at this depth results in artifactually low velocities because of inadequate penetration of the ultrasound wave at depth.
Figure 9b.
Figure 9b.
Effect of depth on velocity measurements obtained with the point shear-wave elastographic technique in a healthy 37-year-old female volunteer. Ideally, velocity measurements should be obtained in the superficial portion of the liver (between 2 cm and 7 cm from the capsule). (a) Point shear-wave elastographic image shows that an appropriately placed ROI has a sample velocity of 1.21 m/sec. (b) Point shear-wave elastographic image shows that an ROI placed at a depth of more than 7 cm from the capsule has a sample velocity of 1.01 m/sec. Measuring at this depth results in artifactually low velocities because of inadequate penetration of the ultrasound wave at depth.
Figure 10a.
Figure 10a.
Effect of respiration on velocity measurements obtained with the point shear-wave elastographic technique in a healthy 37-year-old female volunteer. Ideally, velocities should be measured during a breath hold in end expiration to minimize liver motion. (a) Point shear-wave elastographic image shows that a velocity of 1.16 m/sec was measured for a sample obtained during end expiration, which is the appropriate technique. (b) Point shear-wave elastographic image shows that a velocity of 1.71 m/sec was measured for a sample obtained during deep inspiration; this higher velocity measurement is due to the increased stiffness of the liver during inspiration because of compression by the diaphragm.
Figure 10b.
Figure 10b.
Effect of respiration on velocity measurements obtained with the point shear-wave elastographic technique in a healthy 37-year-old female volunteer. Ideally, velocities should be measured during a breath hold in end expiration to minimize liver motion. (a) Point shear-wave elastographic image shows that a velocity of 1.16 m/sec was measured for a sample obtained during end expiration, which is the appropriate technique. (b) Point shear-wave elastographic image shows that a velocity of 1.71 m/sec was measured for a sample obtained during deep inspiration; this higher velocity measurement is due to the increased stiffness of the liver during inspiration because of compression by the diaphragm.
Figure 11.
Figure 11.
Diagram of the hardware setup for MR elastography. An acoustic wave generator is placed outside the MR imaging room. A flexible plastic tube (∼25 ft [7.5 m] long) transmits pressure waves to a passive driver inside the MR imaging room. The passive driver (curved arrow) is placed on the patient’s abdomen and secured with an elastic strap. Standard torso coils (not shown) are subsequently placed over the passive driver.
Figure 12.
Figure 12.
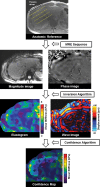
Schematic overview of production of MR elastographic images. Shear waves coursing through the patient’s liver create displacement, which is detected and measured by the MR elastography (MRE) sequence to generate the magnitude and phase images. These images are subsequently analyzed with an inversion algorithm to produce an elastogram that is color coded to represent stiffness in kilopascals and a set of wave images to show propagation of shear waves through the liver. A confidence algorithm is used to place a checkerboard pattern over all but the highest regions of statistical confidence, to form the confidence map.
Figure 13a.
Figure 13a.
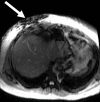
Assessment of adequate wave propagation at MR elastography illustrated with images from four different patients. (a, b) Normal wave propagation. A magnitude image (a) depicts a focal region of artifact (arrow on a) directly beneath the passive driver, which is a reliable indicator that the generator is turned on and that the driver is transmitting pressure waves. The wave image (b) in this case shows wide waves that are due to the stiff parenchyma (arrows on b). (c, d) No wave propagation: images obtained with the driver tubing disconnected. A magnitude image (c) shows the absence of subcutaneous artifact within the subcutaneous fat. The wave image (d) in this case shows variable signal intensity in the liver (arrowheads on d) caused by noise, with a lack of propagating waves. (e, f) Poor wave propagation because of interposed colon. A magnitude image (e) shows a normal artifact (arrow on e) under the passive driver, but the wave image (f) shows a lack of propagating waves in the liver. The cause was interposed colon, which can be recognized by identifying the susceptibility artifact (arrowhead on e) from the luminal gas. (g, h) Successful wave propagation with the driver placed over the left lobe. MR elastography with the driver over the right lobe had failed to produce waves because of interposed colon secondary to right hepatic atrophy. The magnitude image (g) obtained after the driver was moved to a midline position shows a normal susceptibility artifact (arrow on g) over the left hepatic lobe. The wave image (h) shows that this adjustment in the driver position resulted in good-quality wave propagation (arrowheads on h) in the left hepatic lobe.
Figure 13b.
Figure 13b.
Assessment of adequate wave propagation at MR elastography illustrated with images from four different patients. (a, b) Normal wave propagation. A magnitude image (a) depicts a focal region of artifact (arrow on a) directly beneath the passive driver, which is a reliable indicator that the generator is turned on and that the driver is transmitting pressure waves. The wave image (b) in this case shows wide waves that are due to the stiff parenchyma (arrows on b). (c, d) No wave propagation: images obtained with the driver tubing disconnected. A magnitude image (c) shows the absence of subcutaneous artifact within the subcutaneous fat. The wave image (d) in this case shows variable signal intensity in the liver (arrowheads on d) caused by noise, with a lack of propagating waves. (e, f) Poor wave propagation because of interposed colon. A magnitude image (e) shows a normal artifact (arrow on e) under the passive driver, but the wave image (f) shows a lack of propagating waves in the liver. The cause was interposed colon, which can be recognized by identifying the susceptibility artifact (arrowhead on e) from the luminal gas. (g, h) Successful wave propagation with the driver placed over the left lobe. MR elastography with the driver over the right lobe had failed to produce waves because of interposed colon secondary to right hepatic atrophy. The magnitude image (g) obtained after the driver was moved to a midline position shows a normal susceptibility artifact (arrow on g) over the left hepatic lobe. The wave image (h) shows that this adjustment in the driver position resulted in good-quality wave propagation (arrowheads on h) in the left hepatic lobe.
Figure 13c.
Figure 13c.
Assessment of adequate wave propagation at MR elastography illustrated with images from four different patients. (a, b) Normal wave propagation. A magnitude image (a) depicts a focal region of artifact (arrow on a) directly beneath the passive driver, which is a reliable indicator that the generator is turned on and that the driver is transmitting pressure waves. The wave image (b) in this case shows wide waves that are due to the stiff parenchyma (arrows on b). (c, d) No wave propagation: images obtained with the driver tubing disconnected. A magnitude image (c) shows the absence of subcutaneous artifact within the subcutaneous fat. The wave image (d) in this case shows variable signal intensity in the liver (arrowheads on d) caused by noise, with a lack of propagating waves. (e, f) Poor wave propagation because of interposed colon. A magnitude image (e) shows a normal artifact (arrow on e) under the passive driver, but the wave image (f) shows a lack of propagating waves in the liver. The cause was interposed colon, which can be recognized by identifying the susceptibility artifact (arrowhead on e) from the luminal gas. (g, h) Successful wave propagation with the driver placed over the left lobe. MR elastography with the driver over the right lobe had failed to produce waves because of interposed colon secondary to right hepatic atrophy. The magnitude image (g) obtained after the driver was moved to a midline position shows a normal susceptibility artifact (arrow on g) over the left hepatic lobe. The wave image (h) shows that this adjustment in the driver position resulted in good-quality wave propagation (arrowheads on h) in the left hepatic lobe.
Figure 13d.
Figure 13d.
Assessment of adequate wave propagation at MR elastography illustrated with images from four different patients. (a, b) Normal wave propagation. A magnitude image (a) depicts a focal region of artifact (arrow on a) directly beneath the passive driver, which is a reliable indicator that the generator is turned on and that the driver is transmitting pressure waves. The wave image (b) in this case shows wide waves that are due to the stiff parenchyma (arrows on b). (c, d) No wave propagation: images obtained with the driver tubing disconnected. A magnitude image (c) shows the absence of subcutaneous artifact within the subcutaneous fat. The wave image (d) in this case shows variable signal intensity in the liver (arrowheads on d) caused by noise, with a lack of propagating waves. (e, f) Poor wave propagation because of interposed colon. A magnitude image (e) shows a normal artifact (arrow on e) under the passive driver, but the wave image (f) shows a lack of propagating waves in the liver. The cause was interposed colon, which can be recognized by identifying the susceptibility artifact (arrowhead on e) from the luminal gas. (g, h) Successful wave propagation with the driver placed over the left lobe. MR elastography with the driver over the right lobe had failed to produce waves because of interposed colon secondary to right hepatic atrophy. The magnitude image (g) obtained after the driver was moved to a midline position shows a normal susceptibility artifact (arrow on g) over the left hepatic lobe. The wave image (h) shows that this adjustment in the driver position resulted in good-quality wave propagation (arrowheads on h) in the left hepatic lobe.
Figure 13e.
Figure 13e.
Assessment of adequate wave propagation at MR elastography illustrated with images from four different patients. (a, b) Normal wave propagation. A magnitude image (a) depicts a focal region of artifact (arrow on a) directly beneath the passive driver, which is a reliable indicator that the generator is turned on and that the driver is transmitting pressure waves. The wave image (b) in this case shows wide waves that are due to the stiff parenchyma (arrows on b). (c, d) No wave propagation: images obtained with the driver tubing disconnected. A magnitude image (c) shows the absence of subcutaneous artifact within the subcutaneous fat. The wave image (d) in this case shows variable signal intensity in the liver (arrowheads on d) caused by noise, with a lack of propagating waves. (e, f) Poor wave propagation because of interposed colon. A magnitude image (e) shows a normal artifact (arrow on e) under the passive driver, but the wave image (f) shows a lack of propagating waves in the liver. The cause was interposed colon, which can be recognized by identifying the susceptibility artifact (arrowhead on e) from the luminal gas. (g, h) Successful wave propagation with the driver placed over the left lobe. MR elastography with the driver over the right lobe had failed to produce waves because of interposed colon secondary to right hepatic atrophy. The magnitude image (g) obtained after the driver was moved to a midline position shows a normal susceptibility artifact (arrow on g) over the left hepatic lobe. The wave image (h) shows that this adjustment in the driver position resulted in good-quality wave propagation (arrowheads on h) in the left hepatic lobe.
Figure 13f.
Figure 13f.
Assessment of adequate wave propagation at MR elastography illustrated with images from four different patients. (a, b) Normal wave propagation. A magnitude image (a) depicts a focal region of artifact (arrow on a) directly beneath the passive driver, which is a reliable indicator that the generator is turned on and that the driver is transmitting pressure waves. The wave image (b) in this case shows wide waves that are due to the stiff parenchyma (arrows on b). (c, d) No wave propagation: images obtained with the driver tubing disconnected. A magnitude image (c) shows the absence of subcutaneous artifact within the subcutaneous fat. The wave image (d) in this case shows variable signal intensity in the liver (arrowheads on d) caused by noise, with a lack of propagating waves. (e, f) Poor wave propagation because of interposed colon. A magnitude image (e) shows a normal artifact (arrow on e) under the passive driver, but the wave image (f) shows a lack of propagating waves in the liver. The cause was interposed colon, which can be recognized by identifying the susceptibility artifact (arrowhead on e) from the luminal gas. (g, h) Successful wave propagation with the driver placed over the left lobe. MR elastography with the driver over the right lobe had failed to produce waves because of interposed colon secondary to right hepatic atrophy. The magnitude image (g) obtained after the driver was moved to a midline position shows a normal susceptibility artifact (arrow on g) over the left hepatic lobe. The wave image (h) shows that this adjustment in the driver position resulted in good-quality wave propagation (arrowheads on h) in the left hepatic lobe.
Figure 13g.
Figure 13g.
Assessment of adequate wave propagation at MR elastography illustrated with images from four different patients. (a, b) Normal wave propagation. A magnitude image (a) depicts a focal region of artifact (arrow on a) directly beneath the passive driver, which is a reliable indicator that the generator is turned on and that the driver is transmitting pressure waves. The wave image (b) in this case shows wide waves that are due to the stiff parenchyma (arrows on b). (c, d) No wave propagation: images obtained with the driver tubing disconnected. A magnitude image (c) shows the absence of subcutaneous artifact within the subcutaneous fat. The wave image (d) in this case shows variable signal intensity in the liver (arrowheads on d) caused by noise, with a lack of propagating waves. (e, f) Poor wave propagation because of interposed colon. A magnitude image (e) shows a normal artifact (arrow on e) under the passive driver, but the wave image (f) shows a lack of propagating waves in the liver. The cause was interposed colon, which can be recognized by identifying the susceptibility artifact (arrowhead on e) from the luminal gas. (g, h) Successful wave propagation with the driver placed over the left lobe. MR elastography with the driver over the right lobe had failed to produce waves because of interposed colon secondary to right hepatic atrophy. The magnitude image (g) obtained after the driver was moved to a midline position shows a normal susceptibility artifact (arrow on g) over the left hepatic lobe. The wave image (h) shows that this adjustment in the driver position resulted in good-quality wave propagation (arrowheads on h) in the left hepatic lobe.
Figure 13h.
Figure 13h.
Assessment of adequate wave propagation at MR elastography illustrated with images from four different patients. (a, b) Normal wave propagation. A magnitude image (a) depicts a focal region of artifact (arrow on a) directly beneath the passive driver, which is a reliable indicator that the generator is turned on and that the driver is transmitting pressure waves. The wave image (b) in this case shows wide waves that are due to the stiff parenchyma (arrows on b). (c, d) No wave propagation: images obtained with the driver tubing disconnected. A magnitude image (c) shows the absence of subcutaneous artifact within the subcutaneous fat. The wave image (d) in this case shows variable signal intensity in the liver (arrowheads on d) caused by noise, with a lack of propagating waves. (e, f) Poor wave propagation because of interposed colon. A magnitude image (e) shows a normal artifact (arrow on e) under the passive driver, but the wave image (f) shows a lack of propagating waves in the liver. The cause was interposed colon, which can be recognized by identifying the susceptibility artifact (arrowhead on e) from the luminal gas. (g, h) Successful wave propagation with the driver placed over the left lobe. MR elastography with the driver over the right lobe had failed to produce waves because of interposed colon secondary to right hepatic atrophy. The magnitude image (g) obtained after the driver was moved to a midline position shows a normal susceptibility artifact (arrow on g) over the left hepatic lobe. The wave image (h) shows that this adjustment in the driver position resulted in good-quality wave propagation (arrowheads on h) in the left hepatic lobe.
Figure 14a.
Figure 14a.
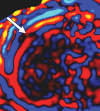
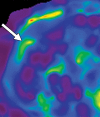
Artifacts that should be excluded from MR elastographic measurements of stiffness. (a) MR elastogram: For ROI placement, typically about 1 cm, or one-half of a wavelength, is excluded around the edge of the liver, including fissures and fossa, to account for partial volume effects (arrows), which may result in an artificially high stiffness calculation. (b) MR elastogram shows an artifactual “hot spot” (arrow) that is often found directly under the passive driver. (c, d) Axial diffusion-weighted MR image (c) and MR elastogram (d) show that large (>3-mm) vessels (arrows) do not reflect parenchymal stiffness. (e, f) A wave image (e) and MR elastogram (f) show that regions of wave interference (arrow) can be constructive or destructive, resulting in variable effects on the liver stiffness.
Figure 14b.
Figure 14b.
Artifacts that should be excluded from MR elastographic measurements of stiffness. (a) MR elastogram: For ROI placement, typically about 1 cm, or one-half of a wavelength, is excluded around the edge of the liver, including fissures and fossa, to account for partial volume effects (arrows), which may result in an artificially high stiffness calculation. (b) MR elastogram shows an artifactual “hot spot” (arrow) that is often found directly under the passive driver. (c, d) Axial diffusion-weighted MR image (c) and MR elastogram (d) show that large (>3-mm) vessels (arrows) do not reflect parenchymal stiffness. (e, f) A wave image (e) and MR elastogram (f) show that regions of wave interference (arrow) can be constructive or destructive, resulting in variable effects on the liver stiffness.
Figure 14c.
Figure 14c.
Artifacts that should be excluded from MR elastographic measurements of stiffness. (a) MR elastogram: For ROI placement, typically about 1 cm, or one-half of a wavelength, is excluded around the edge of the liver, including fissures and fossa, to account for partial volume effects (arrows), which may result in an artificially high stiffness calculation. (b) MR elastogram shows an artifactual “hot spot” (arrow) that is often found directly under the passive driver. (c, d) Axial diffusion-weighted MR image (c) and MR elastogram (d) show that large (>3-mm) vessels (arrows) do not reflect parenchymal stiffness. (e, f) A wave image (e) and MR elastogram (f) show that regions of wave interference (arrow) can be constructive or destructive, resulting in variable effects on the liver stiffness.
Figure 14d.
Figure 14d.
Artifacts that should be excluded from MR elastographic measurements of stiffness. (a) MR elastogram: For ROI placement, typically about 1 cm, or one-half of a wavelength, is excluded around the edge of the liver, including fissures and fossa, to account for partial volume effects (arrows), which may result in an artificially high stiffness calculation. (b) MR elastogram shows an artifactual “hot spot” (arrow) that is often found directly under the passive driver. (c, d) Axial diffusion-weighted MR image (c) and MR elastogram (d) show that large (>3-mm) vessels (arrows) do not reflect parenchymal stiffness. (e, f) A wave image (e) and MR elastogram (f) show that regions of wave interference (arrow) can be constructive or destructive, resulting in variable effects on the liver stiffness.
Figure 14e.
Figure 14e.
Artifacts that should be excluded from MR elastographic measurements of stiffness. (a) MR elastogram: For ROI placement, typically about 1 cm, or one-half of a wavelength, is excluded around the edge of the liver, including fissures and fossa, to account for partial volume effects (arrows), which may result in an artificially high stiffness calculation. (b) MR elastogram shows an artifactual “hot spot” (arrow) that is often found directly under the passive driver. (c, d) Axial diffusion-weighted MR image (c) and MR elastogram (d) show that large (>3-mm) vessels (arrows) do not reflect parenchymal stiffness. (e, f) A wave image (e) and MR elastogram (f) show that regions of wave interference (arrow) can be constructive or destructive, resulting in variable effects on the liver stiffness.
Figure 14f.
Figure 14f.
Artifacts that should be excluded from MR elastographic measurements of stiffness. (a) MR elastogram: For ROI placement, typically about 1 cm, or one-half of a wavelength, is excluded around the edge of the liver, including fissures and fossa, to account for partial volume effects (arrows), which may result in an artificially high stiffness calculation. (b) MR elastogram shows an artifactual “hot spot” (arrow) that is often found directly under the passive driver. (c, d) Axial diffusion-weighted MR image (c) and MR elastogram (d) show that large (>3-mm) vessels (arrows) do not reflect parenchymal stiffness. (e, f) A wave image (e) and MR elastogram (f) show that regions of wave interference (arrow) can be constructive or destructive, resulting in variable effects on the liver stiffness.
Figure 15a.
Figure 15a.
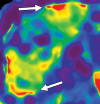
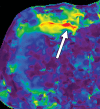
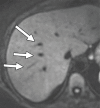
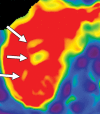
Examples of stiffness patterns at MR elastography that can be correlated to findings at anatomic imaging in three different patients. (a, b) Constrictive pericarditis in a 65-year-old man. MR elastogram (a) shows peripheral increased stiffness (arrows on a), which is often seen with passive hepatic congestion and is not necessarily reflective of underlying hepatic fibrosis. The corresponding anatomic axial contrast-enhanced CT image (b) shows findings of congestive hepatopathy, including altered perfusion of the peripheral liver (arrowheads on b), a finding that corresponds to the region of increased stiffness. (c, d) Primary sclerosing cholangitis in a 55-year-old woman. MR elastogram (c) shows focal increased stiffness (arrow on c), and the anatomic axial T2-weighted MR image (d) shows that this finding corresponds to a dilated bile duct (arrowhead on d). (e, f) Autoimmune hepatitis in a 64-year-old woman. MR elastogram (e) shows diffusely abnormal liver stiffness, with focally increased stiffness in the right hepatic lobe (arrow on e); and the corresponding axial T2-weighted MR anatomic image shows that the focal stiffness corresponds to a region of confluent fibrosis (arrowheads on f).
Figure 15b.
Figure 15b.
Examples of stiffness patterns at MR elastography that can be correlated to findings at anatomic imaging in three different patients. (a, b) Constrictive pericarditis in a 65-year-old man. MR elastogram (a) shows peripheral increased stiffness (arrows on a), which is often seen with passive hepatic congestion and is not necessarily reflective of underlying hepatic fibrosis. The corresponding anatomic axial contrast-enhanced CT image (b) shows findings of congestive hepatopathy, including altered perfusion of the peripheral liver (arrowheads on b), a finding that corresponds to the region of increased stiffness. (c, d) Primary sclerosing cholangitis in a 55-year-old woman. MR elastogram (c) shows focal increased stiffness (arrow on c), and the anatomic axial T2-weighted MR image (d) shows that this finding corresponds to a dilated bile duct (arrowhead on d). (e, f) Autoimmune hepatitis in a 64-year-old woman. MR elastogram (e) shows diffusely abnormal liver stiffness, with focally increased stiffness in the right hepatic lobe (arrow on e); and the corresponding axial T2-weighted MR anatomic image shows that the focal stiffness corresponds to a region of confluent fibrosis (arrowheads on f).
Figure 15c.
Figure 15c.
Examples of stiffness patterns at MR elastography that can be correlated to findings at anatomic imaging in three different patients. (a, b) Constrictive pericarditis in a 65-year-old man. MR elastogram (a) shows peripheral increased stiffness (arrows on a), which is often seen with passive hepatic congestion and is not necessarily reflective of underlying hepatic fibrosis. The corresponding anatomic axial contrast-enhanced CT image (b) shows findings of congestive hepatopathy, including altered perfusion of the peripheral liver (arrowheads on b), a finding that corresponds to the region of increased stiffness. (c, d) Primary sclerosing cholangitis in a 55-year-old woman. MR elastogram (c) shows focal increased stiffness (arrow on c), and the anatomic axial T2-weighted MR image (d) shows that this finding corresponds to a dilated bile duct (arrowhead on d). (e, f) Autoimmune hepatitis in a 64-year-old woman. MR elastogram (e) shows diffusely abnormal liver stiffness, with focally increased stiffness in the right hepatic lobe (arrow on e); and the corresponding axial T2-weighted MR anatomic image shows that the focal stiffness corresponds to a region of confluent fibrosis (arrowheads on f).
Figure 15d.
Figure 15d.
Examples of stiffness patterns at MR elastography that can be correlated to findings at anatomic imaging in three different patients. (a, b) Constrictive pericarditis in a 65-year-old man. MR elastogram (a) shows peripheral increased stiffness (arrows on a), which is often seen with passive hepatic congestion and is not necessarily reflective of underlying hepatic fibrosis. The corresponding anatomic axial contrast-enhanced CT image (b) shows findings of congestive hepatopathy, including altered perfusion of the peripheral liver (arrowheads on b), a finding that corresponds to the region of increased stiffness. (c, d) Primary sclerosing cholangitis in a 55-year-old woman. MR elastogram (c) shows focal increased stiffness (arrow on c), and the anatomic axial T2-weighted MR image (d) shows that this finding corresponds to a dilated bile duct (arrowhead on d). (e, f) Autoimmune hepatitis in a 64-year-old woman. MR elastogram (e) shows diffusely abnormal liver stiffness, with focally increased stiffness in the right hepatic lobe (arrow on e); and the corresponding axial T2-weighted MR anatomic image shows that the focal stiffness corresponds to a region of confluent fibrosis (arrowheads on f).
Figure 15e.
Figure 15e.
Examples of stiffness patterns at MR elastography that can be correlated to findings at anatomic imaging in three different patients. (a, b) Constrictive pericarditis in a 65-year-old man. MR elastogram (a) shows peripheral increased stiffness (arrows on a), which is often seen with passive hepatic congestion and is not necessarily reflective of underlying hepatic fibrosis. The corresponding anatomic axial contrast-enhanced CT image (b) shows findings of congestive hepatopathy, including altered perfusion of the peripheral liver (arrowheads on b), a finding that corresponds to the region of increased stiffness. (c, d) Primary sclerosing cholangitis in a 55-year-old woman. MR elastogram (c) shows focal increased stiffness (arrow on c), and the anatomic axial T2-weighted MR image (d) shows that this finding corresponds to a dilated bile duct (arrowhead on d). (e, f) Autoimmune hepatitis in a 64-year-old woman. MR elastogram (e) shows diffusely abnormal liver stiffness, with focally increased stiffness in the right hepatic lobe (arrow on e); and the corresponding axial T2-weighted MR anatomic image shows that the focal stiffness corresponds to a region of confluent fibrosis (arrowheads on f).
Figure 15f.
Figure 15f.
Examples of stiffness patterns at MR elastography that can be correlated to findings at anatomic imaging in three different patients. (a, b) Constrictive pericarditis in a 65-year-old man. MR elastogram (a) shows peripheral increased stiffness (arrows on a), which is often seen with passive hepatic congestion and is not necessarily reflective of underlying hepatic fibrosis. The corresponding anatomic axial contrast-enhanced CT image (b) shows findings of congestive hepatopathy, including altered perfusion of the peripheral liver (arrowheads on b), a finding that corresponds to the region of increased stiffness. (c, d) Primary sclerosing cholangitis in a 55-year-old woman. MR elastogram (c) shows focal increased stiffness (arrow on c), and the anatomic axial T2-weighted MR image (d) shows that this finding corresponds to a dilated bile duct (arrowhead on d). (e, f) Autoimmune hepatitis in a 64-year-old woman. MR elastogram (e) shows diffusely abnormal liver stiffness, with focally increased stiffness in the right hepatic lobe (arrow on e); and the corresponding axial T2-weighted MR anatomic image shows that the focal stiffness corresponds to a region of confluent fibrosis (arrowheads on f).

Comment in

Similar articles

Cited by

References

    1. Sebastiani G, Castera L, Halfon P, et al. . The impact of liver disease aetiology and the stages of hepatic fibrosis on the performance of non-invasive fibrosis biomarkers: an international study of 2411 cases. Aliment Pharmacol Ther 2011;34(10):1202–1216. - PubMed
    1. Centers for Disease Control and Prevention . Viral hepatitis. Centers for Disease Control and Prevention website. http://www.cdc.gov/hepatitis/index.htm. Updated September 18, 2014. Accessed March 1, 2016.
    1. Friedman SL. Liver fibrosis: from bench to bedside. J Hepatol 2003;38(suppl 1):S38–S53. - PubMed
    1. Nagaoki Y, Aikata H, Nakano N, et al. . Development of hepatocellular carcinoma in patients with hepatitis C virus infection who achieved sustained virological response following interferon therapy: a large-scale, long-term cohort study. J Gastroenterol Hepatol 2016;31(5):1009–1015. - PubMed
    1. Ko CJ, Lin PY, Lin KH, Lin CC, Chen YL. Presence of fibrosis is predictive of postoperative survival in patients with small hepatocellular carcinoma. Hepatogastroenterology 2014;61(136):2295–2300. - PubMed

MeSH terms

LinkOut - more resources