. 2016 Sep 15;30(18):2119-2132.
doi: 10.1101/gad.285775.116. Epub 2016 Sep 29.

Functional interplay between Mediator and TFIIB in preinitiation complex assembly in relation to promoter architecture

Affiliations

Functional interplay between Mediator and TFIIB in preinitiation complex assembly in relation to promoter architecture

Thomas Eychenne et al. Genes Dev. .

Abstract

Mediator is a large coregulator complex conserved from yeast to humans and involved in many human diseases, including cancers. Together with general transcription factors, it stimulates preinitiation complex (PIC) formation and activates RNA polymerase II (Pol II) transcription. In this study, we analyzed how Mediator acts in PIC assembly using in vivo, in vitro, and in silico approaches. We revealed an essential function of the Mediator middle module exerted through its Med10 subunit, implicating a key interaction between Mediator and TFIIB. We showed that this Mediator-TFIIB link has a global role on PIC assembly genome-wide. Moreover, the amplitude of Mediator's effect on PIC formation is gene-dependent and is related to the promoter architecture in terms of TATA elements, nucleosome occupancy, and dynamics. This study thus provides mechanistic insights into the coordinated function of Mediator and TFIIB in PIC assembly in different chromatin contexts.

Keywords: Mediator; RNA polymerase II transcription; Saccharomyces cerevisiae; TFIIB; preinitiation complex; promoter architecture.


Figures

Figure 1.
Figure 1.
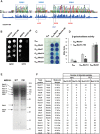
Phenotypes of the med10-196 mutant. (A) Location of the mutations in med10-196. The Med10 conserved domains 1, 2, and 3 (signature-specific motif [SSM]) from Saccharomyces cerevisiae (Sc) and Homo sapiens (Hs) with the consensus generated by WebLogo were adapted from Bourbon (2008). The mutated residues corresponding to identical (for L53S, E82D, and N108I) or functionally close (I79T) amino acids in the human Med10 protein are indicated in red and blue, respectively. (B) Thermosensitive growth phenotype of the med10 mutant. Cultures of wild-type and mutant med10 yeast strains were serially diluted, spotted on YPD agar plates, and incubated for 3 d at permissive (30°C) or nonpermissive (37°C) temperatures. (C) Two-hybrid interactions of the Med10-196 protein with its partners. Wild-type or mutant Med10 was fused to the Gal4 DNA-binding domain (GDB-Med10), and Med4, Med7, Med14, Med21, and Med31 were fused to the Gal4 activation domain (GAD-Med4, GAD-Med7, GAD-Med14, GAD-Med21, and GAD-Med31). (D) Quantitative analysis of two-hybrid interactions between Med10 and Med14. Wild-type or mutant Med10 was fused to the Gal4 DNA-binding domain (GDB-Med10), and Med14 or Med21 was fused to the Gal4 activation domain (GAD-Med14 and GAD-Med21). β-Galactosidase was assayed according to the Miller method, as described in the Supplemental Material. The mean values and standard deviation (indicated by error bars) of three independent experiments are shown. Asterisk represents a significant difference between the wild type and the mutant at P-value <0.002 in a Student's t-test. (E) Silver stain SDS-PAGE analysis of purified Mediator complex from wild-type and med10 mutant strains. Cells were grown at 30°C, and core Mediator complex was purified as described in the Supplemental Material. Mediator subunits with low molecular weight were not detectable by silver staining after SDS-PAGE. (F) Mass spectrometry analysis of Mediator integrity in the mutant grown at 30°C or transferred to 37°C. Core Mediator complex containing head, middle, and tail modules was purified from the med10-196 mutant and a wild-type strain. For each Mediator subunit identified by mass spectrometry analysis in wild-type and the med10 mutant, the number of identified peptides is indicated.
Figure 2.
Figure 2.
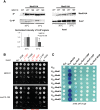
Functional interaction between Mediator and TFIIB. (A) Co-IP between Mediator and TFIIB in the med10-196 mutant compared with the wild-type strain. Wild-type and med10 mutant strains carrying a Med5-HA tag were grown to exponential phase at 30°C or transferred for 90 min to 37°C. Mediator was immunoprecipitated (IP) through Med5-HA from crude extracts (Input) of wild-type and mutant strains using magnetic beads coupled to anti-HA antibodies. MED10 strain carrying a nontagged Mediator subunit was used as a negative control. Coimmunoprecipitated TFIIB was detected by Western blotting using anti-TFIIB antibodies. The intensity of immune staining for coimmunoprecipitated TFIIB signals relative to the wild type was normalized against immunoprecipitation signals and is displayed in the bottom panel. The mean values and standard deviation (indicated by error bars) of three independent experiments are shown. The asterisk represents a significant difference between the wild type and the mutant at P-value <0.05 in a Student's t-test. (B) Specific sua7 mutants have synthetic phenotypes in combination with med10-196. The strain deleted for med10 and complemented by a TRP1 plasmid carrying MED10 or med10-196 and also deleted for sua7 and complemented by a URA3 plasmid carrying SUA7 was transformed by the HIS3 plasmids carrying either a wild-type or mutated version of SUA7. Transformants were serially diluted, spotted on 5-FOA-containing agar plates to counterselect the wild-type SUA7-bearing plasmid (see the Supplemental Material), and incubated for 3 d at 30°C. The sua7 mutants [sua7-11 (L136P), sua7-34 (L52P), and sua7-36 (S53P)] showing synthetic phenotypes with med10-196 are indicated in red. (C) A two-hybrid interaction between Mediator and Sua7 is decreased with Sua7 mutants. Wild-type or mutant Sua7 was fused to the Gal4 DNA-binding domain (GDB-Sua7), and Med1, Med4, Med7, Med9, Med10, Med14, Med21, and Med31 were fused to the Gal4 activation domain (GAD-Med1, GAD-Med4, GAD-Med7, GAD-Med9, GAD-Med10, GAD-Med14, GAD-Med21, and GAD-Med31). Med10 two-hybrid interactions with Mediator subunits are shown as positive controls.
Figure 3.
Figure 3.
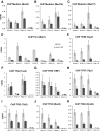
ChIP analysis of PIC components in med10-196. Cells were grown to exponential phase at 30°C on YPD medium and then transferred for 90 min to 37°C. The immunoprecipitated protein is indicated together with the complex to which it belongs: Mediator tail (Med5) (A), Mediator tail (Med15) (B), Mediator head (Med17) (C), Pol II (Rpb1) (D), TFIIB (Sua7) (E), TFIIA (Toa2) (F), TFIID (TBP) (G), TFIIF (Tfg1) (H), TFIIE (Tfa2) (I), TFIIH core module (Rad3) (J), and TFIIH kinase module (Kin28) (K). All proteins, except Rpb1, were tagged with HA or TAP (see the Supplemental Material). Immunoprecipitated DNA was amplified with primers corresponding to ADH1, PMA1 and PYK1 ORF (O) or promoters (P). P1 primers listed in Supplemental Table S3 located close to upstream regulatory regions were used for Mediator ChIP experiments, and P2 primers located close to core promoters were used for Pol II and GTF ChIP experiments. GAL1 ORF was used as a negative control, since it is repressed in glucose-supplemented rich medium. The mean values and standard deviation (indicated by error bars) of three independent experiments are shown.
Figure 4.
Figure 4.
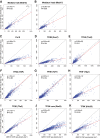
Genome-wide effects of the med10-196 mutation on PIC component distribution. Cells were grown at 30°C in YPD medium and then transferred for 90 min to 37°C. The ChIP-seq densities of sequence tags in Mediator tail (Med15) (A), Mediator head (Med17) (B), TFIIB (Sua7) (D), TFIIA (Toa2) (E), TFIID (TBP) (F), TFIID (Taf1) (G), TFIIF (Tfg1) (H), TFIIE (Tfa2) (I), TFIIH core (Rad3) (J), and TFIIK (Kin28) (K) were calculated for promoter regions of Pol II transcribed genes. (C) The densities of sequence tags in the Pol II ChIP-seq experiments were calculated for the Pol II transcribed genes. Tag densities were normalized relative to qPCR data on a set of selected genes. Each point on the plot corresponds to one promoter region or one ORF. Promoter regions correspond to intergenic regions in tandem or in divergent orientation, excluding intergenic regions encompassing Pol III transcribed genes. In all, 2694 intergenic regions corresponding to 3303 Pol II-enriched genes were used for these analyses. A linear regression (red line) for ChIP-seq density in the mutant versus ChIP-seq density in wild type and an R2 correlation coefficient are indicated.
Figure 5.
Figure 5.
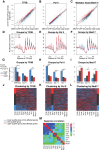
Clustering analysis of genome-wide PIC occupancy ratios between med10-196 and the wild type. (AC) ChIP-seq tag densities in the mutant versus the wild type were plotted as in Figure 4 but with log2 scales. To aggregate data at the gene level, divergent genes with double peaks for GTFs were excluded from the analysis as well as intergenic regions encompassing Pol III transcribed genes and centromeric regions. The genes with the lowest Pol II occupancy (lowest 25%) were also excluded from the analysis. For each PIC component, three groups of genes were defined according to the occupancy ratios between the med10-196 mutant and the wild type: the lowest 25% (lower quartile group in blue), the highest 25% (upper quartile group in red), and the ratios between 25% and 75% (interquartile group in gray). The red line corresponds to the median trend, and black lines correspond to the first and third quartiles of the data. Blue points correspond to the lowest 25% of mutant/wild-type values, and gray points correspond to values between 25% and 75% of the mutant/wild type. The red points correspond to the 25% of the genes that have the highest mutant/wild-type ratio. Tag densities were calculated as described in the legend for Figure 4 and were analyzed for the TFIIB (A,D,G,J), Pol II (B,E,H,K), and Mediator (Med17) groups (C,F,I,L). (D,E,F) The groups determined by TFIIB (A), Pol II (B), and the Mediator Med17 subunit (C) were analyzed for nucleosome occupancy in a 1600-base-pair (bp) window centered on the TSS. P-values determined by Wilcox test for the differences between the gene groups for the maximum values of nucleosome occupancy on the region between 0 and 100 bp relative to the TSS were as follows: For TFIIB groups, lower quartile versus interquartile was 3 × 10⁻⁶, interquartile versus upper quartile was <10 × 10−12, and lower quartile versus upper quartile was <10 × 10−12; for Pol II groups, lower quartile versus interquartile was 6 × 10⁻⁴, interquartile versus upper quartile was 6 × 10⁻³, and lower quartile versus upper quartile was 7 × 10⁻⁶; and for Med17 groups, interquartile versus upper quartile was 0.002, and lower quartile versus upper quartile was 6 × 10⁻⁵. (GI) The groups determined by TFIIB (A), Pol II (B), and the Mediator Med17 subunit (C) were analyzed for the presence of the TATA box for dynamic (hot) nucleosomes −1 and +1. P-values determined by Fisher test are indicated by asterisks with a value key in the left panel. (JL) The heat maps clustered by the TFIIB groups (J), Pol II groups (K), and Med17 groups (L) summarize the group distribution according to the occupancy ratios between the mutant and the wild type for each GTF, Mediator subunit, and Pol II. For each PIC component, lower quartile group genes are colored in blue, interquartile group genes are gray, and upper quartile group genes are red. The genes are ordered in the heat maps inside each group by interquartile range (IQR) score. (M) Pair-wise Spearman correlations between mutant and wild-type ratios for each PIC component were calculated. The correlated PIC components (>0.48) were TFIIB, TFIIH, TFIIK, and Pol II.
Figure 6.
Figure 6.
In vitro PIC formation in the med10-196 mutant. (Lanes 1,2) Nuclear extracts were prepared from the wild-type and med10-196 mutant strains and analyzed by Western blotting (Input). Histone H3 was used as a loading control. PIC assembly assay was performed by incubating the indicated nuclear extracts with the HIS4 immobilized template for 40 min in the absence (lanes 3,7) or presence (lanes 46,810) of Gal4-Gcn4 activator as described in the Supplemental Material. Increasing amounts of purified core Mediator were added as indicated (lanes 5,6 for Med10 wild-type extract; lanes 9,10 for Med10-196 extract). Western blotting for Med8-HA was used as a control for the purified Mediator addition.

Similar articles

Cited by

References

    1. Baek HJ, Kang YK, Roeder RG. 2006. Human Mediator enhances basal transcription by facilitating recruitment of transcription factor IIB during preinitiation complex assembly. J Biol Chem 281: 15172–15181. - PubMed
    1. Bourbon HM. 2008. Comparative genomics supports a deep evolutionary origin for the large, four-module transcriptional mediator complex. Nucleic Acids Res 36: 3993–4008. - PMC - PubMed
    1. Buratowski S, Hahn S, Guarente L, Sharp PA. 1989. Five intermediate complexes in transcription initiation by RNA polymerase II. Cell 56: 549–561. - PubMed
    1. Cevher MA, Shi Y, Li D, Chait BT, Malik S, Roeder RG. 2014. Reconstitution of active human core Mediator complex reveals a critical role of the MED14 subunit. Nat Struct Mol Biol 21: 1028–1034. - PMC - PubMed
    1. Dion MF, Kaplan T, Kim M, Buratowski S, Friedman N, Rando OJ. 2007. Dynamics of replication-independent histone turnover in budding yeast. Science 315: 1405–1408. - PubMed

MeSH terms

LinkOut - more resources