. 2016 Dec;112(3):689-701.
doi: 10.1093/cvr/cvw210. Epub 2016 Sep 26.

Endothelial repair in stented arteries is accelerated by inhibition of Rho-associated protein kinase

Affiliations

Endothelial repair in stented arteries is accelerated by inhibition of Rho-associated protein kinase

Sarah T Hsiao et al. Cardiovasc Res. 2016 Dec.

Erratum in

  • Corrigendum.
    [No authors listed] [No authors listed] Cardiovasc Res. 2017 Jan;113(1):80. doi: 10.1093/cvr/cvw230. Epub 2016 Nov 17. Cardiovasc Res. 2017. PMID: 27856612 Free PMC article. No abstract available.

Abstract

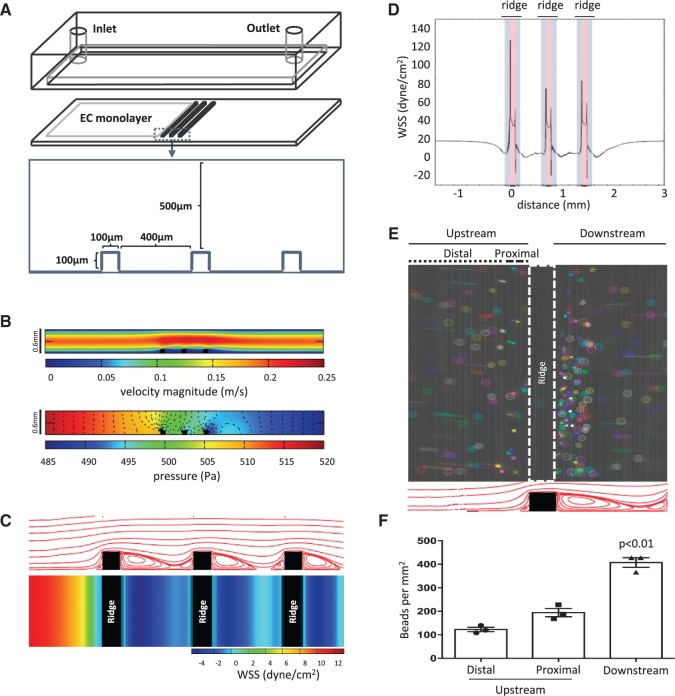
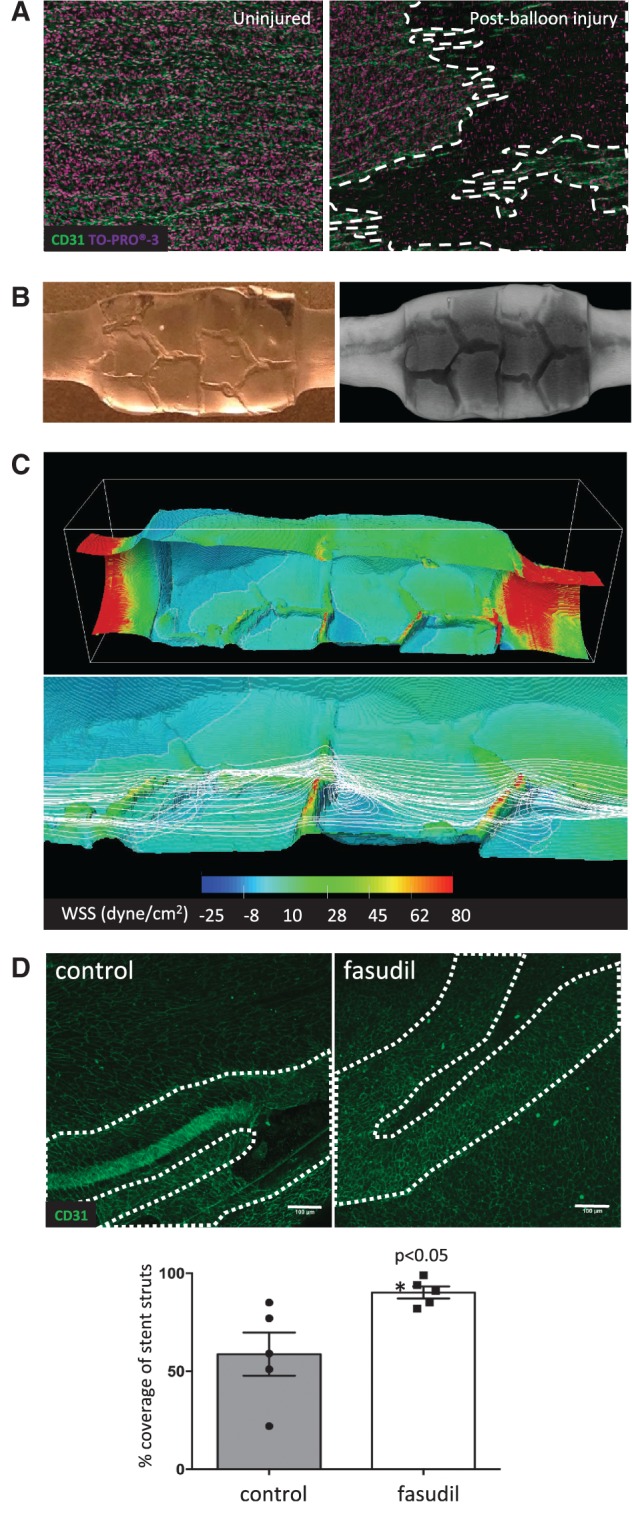
Aims: Stent deployment causes endothelial cells (EC) denudation, which promotes in-stent restenosis and thrombosis. Thus endothelial regrowth in stented arteries is an important therapeutic goal. Stent struts modify local hemodynamics, however the effects of flow perturbation on EC injury and repair are incompletely understood. By studying the effects of stent struts on flow and EC migration, we identified an intervention that promotes endothelial repair in stented arteries.

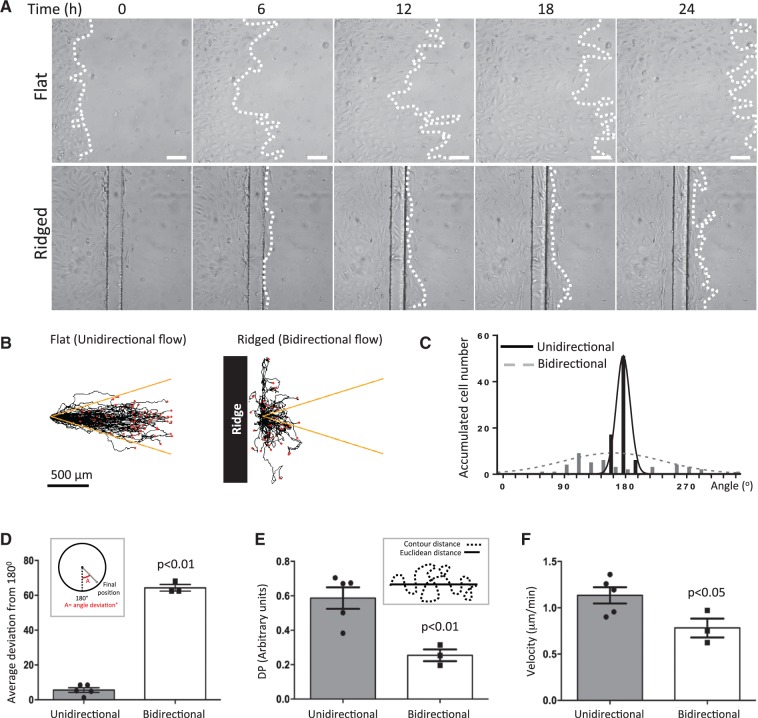
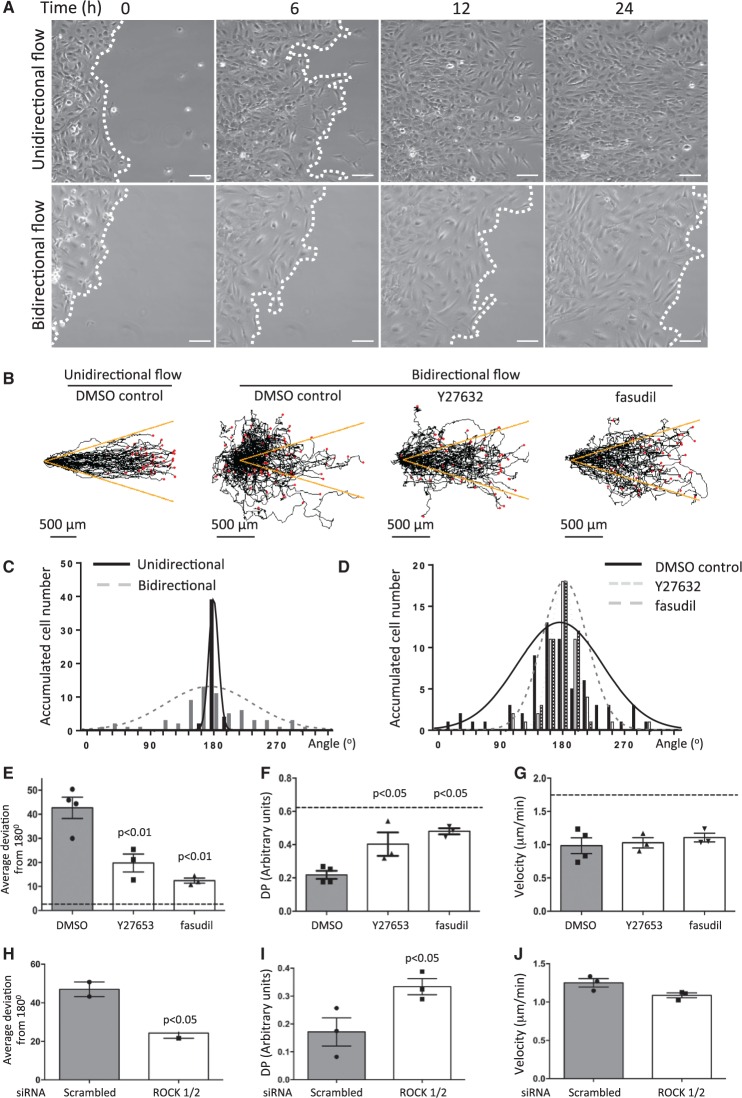
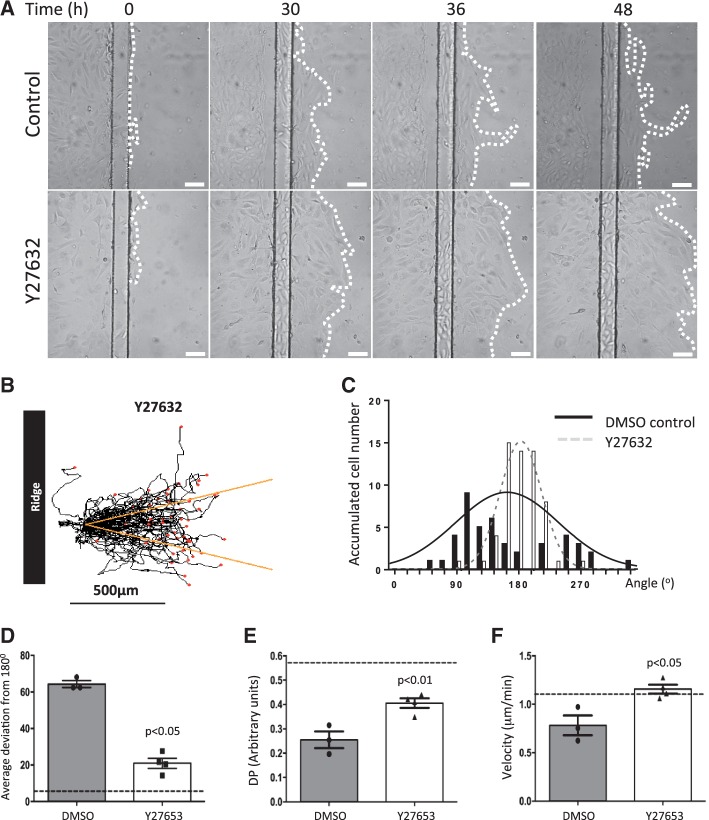
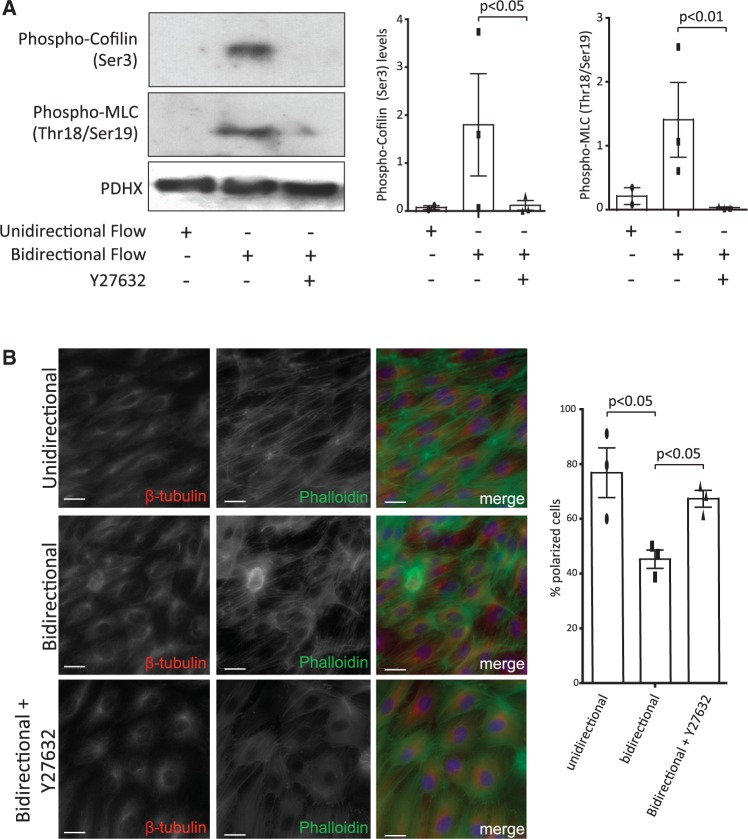
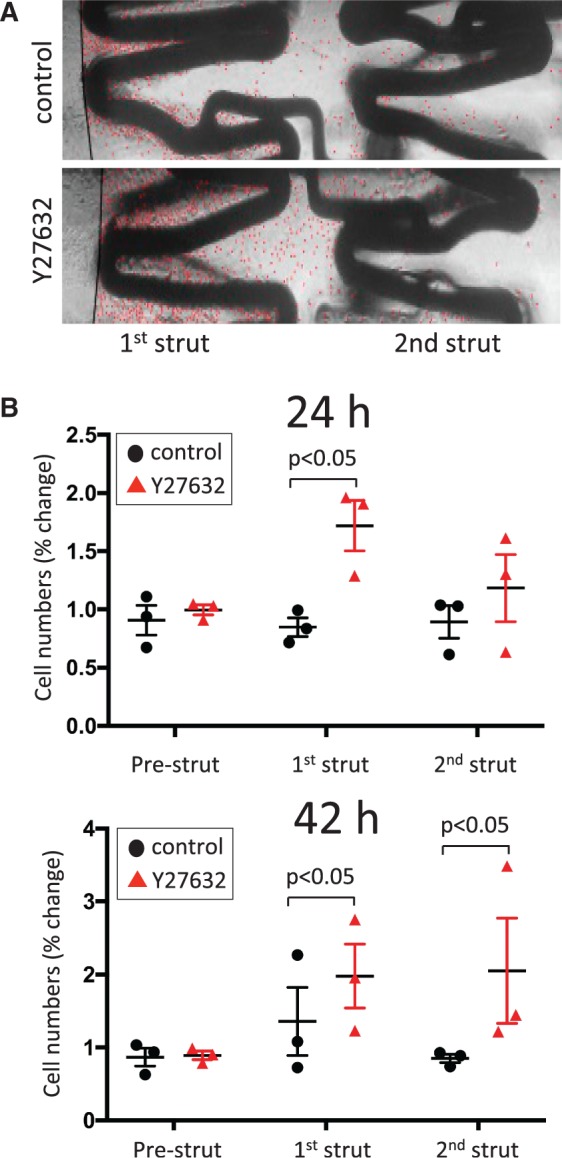
Methods and results: In vitro and in vivo models were developed to monitor endothelialization under flow and the influence of stent struts. A 2D parallel-plate flow chamber with 100 μm ridges arranged perpendicular to the flow was used. Live cell imaging coupled to computational fluid dynamic simulations revealed that EC migrate in the direction of flow upstream from the ridges but subsequently accumulate downstream from ridges at sites of bidirectional flow. The mechanism of EC trapping by bidirectional flow involved reduced migratory polarity associated with altered actin dynamics. Inhibition of Rho-associated protein kinase (ROCK) enhanced endothelialization of ridged surfaces by promoting migratory polarity under bidirectional flow (P < 0.01). To more closely mimic the in vivo situation, we cultured EC on the inner surface of polydimethylsiloxane tubing containing Coroflex Blue stents (65 μm struts) and monitored migration. ROCK inhibition significantly enhanced EC accumulation downstream from struts under flow (P < 0.05). We investigated the effects of ROCK inhibition on re-endothelialization in vivo using a porcine model of EC denudation and stent placement. En face staining and confocal microscopy revealed that inhibition of ROCK using fasudil (30 mg/day via osmotic minipump) significantly increased re-endothelialization of stented carotid arteries (P < 0.05).

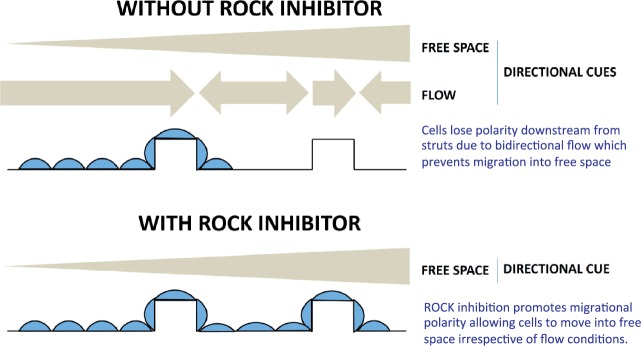
Conclusions: Stent struts delay endothelial repair by generating localized bidirectional flow which traps migrating EC. ROCK inhibitors accelerate endothelial repair of stented arteries by enhancing EC polarity and migration through regions of bidirectional flow.

Keywords: Endothelial cells; Fasudil; ROCK; Shear stress; Stent.


Figures

Figure 1
Figure 1
Fluid flow in the ridged chamber slide. (A) Configuration of the ridged flow chamber. (B–D) CFD were carried out to simulate flow patterns and WSS magnitude assuming an inlet flow rate of 21.6 ml/min. Flow is from left to right. (B) The average velocity (upper) and pressure gradient (lower) along the chamber slide are shown. (C) The flow path (upper, cross-sectional) and time-averaged WSS map (lower, upper surface view) are shown. (D) The unfolded WSS map along the surface of the ridges. Grey-shaded area represents the vertical planes of the ridge and the red-shaded area represents the horizontal plane of the ridge. (E and F) The ridged slide was exposed to flowing water and particle imaging velocimetry was performed. (E) Collated time-lapse images of fluorescently labelled microspheres are shown. A total of seven images were merged and each image was represented with a different colour (upper panel, upper surface view). Flow patterns predicted from CFD are shown for reference (lower panel, cross-sectional). (F) Microspheres accumulating at the upstream distal, upstream proximal, and downstream regions were quantified. Data were pooled from three independent experiments and mean values +/− SEM are shown alongside individual data points. Differences between means were compared using a one-way ANOVA.
Figure 2
Figure 2
The migration pattern of EC was disrupted under bidirectional flow. HUVEC were seeded on flat or ridged slides (upstream from the first ridge) and their migration under flow was monitored by time-lapse imaging for 72 h. (A) Representative images. Flow at inlet is from left to right. White dotted lines represent leading edge of monolayers. White bar = 100 μm. (B–D) Single cell tracking analysis of cells exposed to unidirectional or bidirectional (downstream from ridge) flow. (B) Migration paths are shown. Flow at inlet is from left to right. Each red dot represents a cell. Yellow lines indicate a 15% deviation from the inlet flow direction. (C and D) For each cell, the angle between its final position and the inlet flow direction (180°) was calculated (angle deviation). (C) Angle deviations were divided into 20 × 18° groups and the number of cells in each group is shown. (D) Angle deviations, (E) directional persistence and (F) average velocities were calculated. Data were pooled from five independent experiments and mean values +/− SEM are shown alongside individual data points. Differences between means were compared using an unpaired t-test.
Figure 3
Figure 3
ROCK inhibition enhanced EC migration into cell-free space under bidirectional flow. (A) HUVEC were seeded onto Ibidi slides, exposed to unidirectional or bidirectional flow and migration was monitored. Representative images are shown. Flow at inlet is from left to right. White dotted lines represent leading edge of monolayers. White bar = 100 μm. (B–G) HUVEC were seeded onto Ibidi slides and exposed to unidirectional or bidirectional flow in the presence of a ROCK inhibitor (2 μM Y27632 or 2 μM fasudil) or DMSO vehicle and migration was monitored. (B) Migration paths. Each red dot represents a cell. Yellow lines indicate a 15% deviation from the inlet flow direction. (C–E) For each cell, the angle between its final position and the inlet flow direction (180°) was calculated (angle deviation). (C and D) Angle deviations were divided into 20 × 18° groups and the number of cells in each group is shown. (E) Angle deviations, (F) directional persistence (DP; contour distance/Euclidean distance) (G) and migration velocities were calculated. Data were pooled from four independent experiments and mean values +/− SEM are shown alongside individual data points. (H–J) EC were treated with siRNA against ROCK1 and ROCK2 (siROCK1/2) or with non-targeting scrambled sequences, exposed to unidirectional or bidirectional flow and migration was monitored. (H) Angle deviations, (I) directional persistence (DP), and (J) average velocities were calculated. Data were pooled from three independent experiments and mean values +/− SEM are shown alongside individual data points. Differences between means were compared using a one-way ANOVA (E–G) or unpaired t-test (H–J).
Figure 4
Figure 4
ROCK inhibition promoted EC migration on a ridged surface exposed to bidirectional flow. (A) HUVEC were seeded onto ridged slides upstream from the first ridge, exposed to flow in the presence of a ROCK inhibitor (2 μM Y27632) or DMSO control and migration was monitored. (A) Representative images are shown. Flow at inlet is from left to right. White dotted lines represent leading edge of monolayers. White bar = 100 μm. (B) Migration paths. Each red dot represents a cell. Yellow lines indicate a 15% deviation from the inlet flow direction. (C and D) For each cell, the angle between its final position and the inlet flow direction (180°) was calculated (angle deviation). (C) Angle deviations were divided into 20 × 18° groups and the number of cells in each group is shown. (D) Angle deviations, (E) directional persistence (DP; contour distance/Euclidean distance), and (F) migration velocities were calculated. Data were pooled from four independent experiments and mean values +/− SEM are shown alongside individual data points. Differences between means were compared using an unpaired t-test.
Figure 5
Figure 5
ROCK inhibition enhanced endothelial polarity under bidirectional flow by modifying actin dynamics. (A) HCAEC were seeded onto Ibidi slides and exposed to unidirectional or bidirectional flow in the presence or absence of a ROCK inhibitor (2 μM Y27632) for 12 h. Total cell lysates were tested by Western blotting using antibodies that detect phosphorylated forms of cofilin (Ser 3) and MLC (Thr18/Ser19) or by using anti-PDHX antibodies to assess total protein levels. Representative blots are shown. The levels of Phospho-Cofilin and Phospho-MLC were quantified by densitometric analysis. Data were pooled from three independent experiments and mean values +/− SEM are shown alongside individual data points. Differences between means were compared using a one-way ANOVA. (B) HUVEC were seeded onto Ibidi slides and exposed to unidirectional or bidirectional flow in the presence or absence of a ROCK inhibitor (2 μM Y27632) for 4 h. Cell polarity was assessed by immunofluorescent staining of β-tubulin (red), co-staining of actin using Phalloidin-488 (green) and co-staining of nuclei (DAPI; blue). Scale bar, 200 μm. The proportion of polarized cells (elongated morphology with the MTOC positioned upstream from the nucleus) was calculated. Data were pooled from three independent experiments and mean values +/− SEM are shown alongside individual data points. Differences between means were compared using a one-way ANOVA.
Figure 6
Figure 6
ROCK inhibition enhanced the endothelialization of a 3D in vitro stent model. An in vitro model of EC migration over stents was established by deploying Coroflex Blue stents in PDMS tubing (1.5 mm diameter). HUVEC were seeded into PDMS tubes immediately upstream from the stent. After 24 h, flow was applied (27.35 ml/min) in the presence or absence of a ROCK inhibitor (2 μM Y27632). EC coverage was assessed by brightfield microscopy at 24 h and 42 h. (A) Representative images are shown following 24 h exposure to flow. Individual EC are marked with a red dot to facilitate visualization. Note that EC accumulation downstream from the first strut is greater in Y27632-treated cultures compared to controls. (B) EC were counted at the regions located downstream from the first or second struts (and at the pre-strut region as a control). Data were pooled from three independent experiments. Mean values +/− SEM are shown alongside individual data points. Differences between means were analysed by two-way ANOVA with Sidak’s post-tests.
Figure 7
Figure 7
ROCK inhibition promoted re-endothelialization of stented arteries. (A–C) Endothelial injury in the left carotid artery was induced via repeated balloon angioplasty. A Coroflex™ stent was then deployed at the injured site. (A) En face staining of CD31 (green) and nuclei (To-Pro; purple) revealed an intact endothelial monolayer (left) in healthy arteries and loss of endothelium (dotted white lines) after balloon angioplasty (right). Data shown are representative of those obtained from n=5 animals in three independent experiments. (B and C) The influence on fluid dynamics was assessed. (B) A PDMS-based cast of the lumen of a stented carotid artery (left) and μCT (right) was performed to obtain a detailed geometry. (C) CFD predictions. Flow is from left to right. Upper panel shows WSS in the entire stented segment. Lower panel shows streamlines (white lines) for stent struts in relation to WSS in detail. Note high WSS at struts and low WSS corresponding to sites of recirculation downstream from struts. (D) The influence of fasudil on EC repair in stented arteries was determined using male Yorkshire White pigs. A portion of the carotid artery was denuded by balloon angioplasty prior to implantation of a Coroflex™ stent. Animals were treated using an osmotic pump containing either saline (vehicle group; n = 5 group size) or fasudil (n = 5 group size; 30 mg/day) for 3 days. EC coverage of the stented segment was determined by en face staining for CD31 followed by confocal microscopy. Representative images are shown with stent struts depicted with a broken white line (upper panels; scale bar=100μm). The percentage of EC coverage over stent struts was calculated for n = 5 animals per group. Data were pooled and mean values +/− SEM are presented with individual data points (lower panel). Differences between means were analysed using an unpaired t-test.
Figure 8
Figure 8
Schematic summary: ROCK inhibition promotes stent endothelialization by enhancing polarization and migration. A model is proposed. EC migrate from adjacent sites to denuded portions of stented vessels. In the absence of ROCK inhibitor, EC polarization and migration at the region upstream of stent struts are reinforced by flow which exerts a forward directional cue, whereas EC migration downstream from struts is reduced by bidirectional flow which reduces polarization. Thus EC become ‘trapped’ at the downstream bidirectional flow site. Inhibition of ROCK promotes EC polarization and therefore promotes their migration through sites of disturbed flow in stented arteries.

Similar articles

Cited by

References

    1. Habib A, Finn AV. Endothelialization of drug eluting stents and its impact on dual anti-platelet therapy duration. Pharmacol Res 2015;93:22–27. - PMC - PubMed
    1. Lüscher TF, Steffel J, Eberli FR, Joner M, Nakazawa G, Tanner FC, Virmani R. Drug-eluting stent and coronary thrombosis: biological mechanisms and clinical implications. Circulation 2007;115:1051–1058. - PubMed
    1. Chiastra C, Morlacchi S, Gallo D, Morbiducci U, Cárdenes R, Larrabide I, Migliavacca F. Computational fluid dynamic simulations of image-based stented coronary bifurcation models. J R Soc Interface 2013;10:20130193. - PMC - PubMed
    1. LaDisa JF, Jr, Olson LE, Molthen RC, Hettrick DA, Pratt PF, Hardel MD, Kersten JR, Warltier DC, Pagel PS. Alterations in wall shear stress predict sites of neointimal hyperplasia after stent implantation in rabbit iliac arteries. Am J Physiol Heart Circ Physiol 2005;288:H2465–H2475. - PubMed
    1. Van der Heiden K, Gijsen FJ, Narracott A, Hsiao S, Halliday I, Gunn J, Wentzel JJ, Evans PC. The effects of stenting on shear stress: relevance to endothelial injury and repair. Cardiovasc Res 2013;99:269–275. - PubMed

Publication types

MeSH terms