. 2016 Sep 20:6:33650.
doi: 10.1038/srep33650.

Sequence analysis of the Hsp70 family in moss and evaluation of their functions in abiotic stress responses

Affiliations

Sequence analysis of the Hsp70 family in moss and evaluation of their functions in abiotic stress responses

Ting Tang et al. Sci Rep. .

Abstract

The 70-kD heat shock proteins (Hsp70s) are highly conserved molecular chaperones that play essential roles in cellular processes including abiotic stress responses. Physcomitrella patens serves as a representative of the first terrestrial plants and can recover from serious dehydration. To assess the possible relationship between P. patens Hsp70s and dehydration tolerance, we analyzed the P. patens genome and found at least 21 genes encoding Hsp70s. Gene structure and motif composition were relatively conserved in each subfamily. The intron-exon structure of PpcpHsp70-2 was different from that of other PpcpHsp70s; this gene exhibits several forms of intron retention, indicating that introns may play important roles in regulating gene expression. We observed expansion of Hsp70s in P. patens, which may reflect adaptations related to development and dehydration tolerance, and results mainly from tandem and segmental duplications. Expression profiles of rice, Arabidopsis and P. patens Hsp70 genes revealed that more than half of the Hsp70 genes were responsive to ABA, salt and drought. The presence of overrepresented cis-elements (DOFCOREZM and GCCCORE) among stress-responsive Hsp70s suggests that they share a common regulatory pathway. Moss plants overexpressing PpcpHsp70-2 showed salt and dehydration tolerance, further supporting a role in adaptation to land. This work highlights directions for future functional analyses of Hsp70s.


Figures

Figure 1
Figure 1. Phylogenetic tree of Hsp70 superfamily in eight species.
The tree was constructed using the Neighbor-Joining (NJ) method based on the amino acid sequences of Hsp70 members from Escherichia coli (Ec), Saccharomyces cerevisiae (Sc), Chlamydomonas reinhardtii (Cr), Physcomitrella patens (Pp), Selaginella moellendorffii (Sm), Oryza sativa (Os), Arabidopsis thaliana (At), and Populus trichocarpa (Pt). The Hsp70s were classified into six groups, Group A localized in the cytoplasm, Group B localized in the ER (endoplasmic reticulum), Group C localized in the mitochondrion, Group D localized in the chloroplast according to the phylogenetic analyses, Group E comprised truncated genes, and Group F was a Hsp110/SSE subfamily. The 21 Hsp70 proteins of the P. patens were marked with black dots, and were classified into 4 groups. Numbers at each branch indicate the percentage support for the node among 1,000 bootstrap replicates.
Figure 2
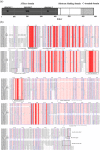
Figure 2. Analysis of conserved domains in Hsp70 superfamily proteins from P. patens.
(a) PpmtHsp70-1 was shown as representative example of the domain structure of Hsp70 proteins, including the ATPase domain (1–400 aa, dark gray box, containing three typical signature motifs), the substrate-binding domain (437–579 aa, white box) and the C-terminal domain (580–680 aa, light gray box). (b) Multiple sequence alignment of Hsp70 proteins. The amino acid sequences of PpHsp70s are numbered on the left. In the ATPase domain, the three typical Hsp70 signature motifs are highlighted and boxed. In the C-terminal domain, the C-terminus specific signature motifs are boxed. The sequence from 220 aa to 330 aa is instead marked by dots to indicate conservation.
Figure 3
Figure 3. Phylogenetic relationships, gene structures, and motif compositions of Hsp70 superfamily members in P. patens.
(a) Multiple sequence alignment of Hsp70s from P. patens was performed using MEGA 6.06 by the NJ method with 1,000 bootstrap replicates (left panel). In the right panel, intron-exon structures of the Hsp70 genes are shown. Yellow boxes represent exons, black lines represent introns, and blue boxes represent UTR (Untranslated Regions). (b) A schematic representation of conserved motifs were presented in Hsp70 superfamily proteins. Motifs were identified by MEME software using complete amino acid sequences of Hsp70 proteins. Different motifs are represented by different colored boxes. Details of the individual motifs are in Supplementary Table S3. The protein sequences are arranged in the order shown in the NJ tree.
Figure 4
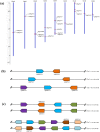
Figure 4. Chromosomal locations and gene duplications of P. patens Hsp70s.
(a) The 21 Hsp70 genes were mapped to 9 chromosomes. Schematic diagram of P. patens Hsp70s based on the sequence map was provided by the Phytozome website. Gene names are listed to the left of the chromosomes, and map markers are listed to the right. (b) Evidence for tandem duplication of P. patens Hsp70s. Diagram shows chromosomal locations of Hsp70 genes and linked homologous genes in P. patens identified in PTGBase (http://ocri-genomics.org/PTGBase/). Pentagons point in the 5′→3′ direction. (c) Evidence for segmental duplication of P. patens Hsp70s. Paralogous gene pairs generated by gene duplication within the Hsp70 family of P. patens were analyzed using the Plant Genome Duplication Database (http://chibba.agtec.uga.edu/duplication/). The black line represents syntenic blocks in P. patens chromosomes, and the different colors of pentagons represent different genes. The Hsp70 gene names are marked above or below the pentagons. Synonymous (Ks) and nonsynonymous substitution (Ka) rates are presented for each pair. Gene pairs were generated by tandem duplication (T) and whole-genome duplication (W).
Figure 5
Figure 5. Hsp70 expression profiles for P. patens, O. sativa, and Arabidopsis are shown.
The Arabidopsis microarray gene expression data were obtained from AtGenExpress. The public expression data in rice were obtained from the Michigan State University (MSU) Rice Genome Annotation (http://rice.plantbiology.msu.edu) databases. The P. patens transcriptome data were obtained from Phytozome 10.3 (http://phytozome.jgi.doe.gov/pz/portal.html). (a) The heat map shows expression of Hsp70 genes in different developmental stages (spore, protonema, juvenile stage, adult stage and gametophore) according to available microarray-based data. The expression profile was generated with log-transformed average values (b) P. patens Hsp70 superfamily genes expression under ABA (0.5 h and 4 h), salt (0.5 h and 4 h) and dehydration treatment (0.5 h and 4 h). (c) Arabidopsis Hsp70 superfamily genes expression under, ABA (0.5 h, 1 h and 3 h), salt (0.5 h, 1h, 3 h, 6 h, 12 h and 24 h), drought treatment (0.25 h, 0.5 h, 1h, 3 h, 6 h, 12 h and 24 h). (d) Rice Hsp70 superfamily genes expression under ABA (1 h, 3 h and 6 h), salt (3 h), and drought (3 h) treatment. The expression profile of (bd) was generated with the fold changes using the average values for each treatment divided by the values of the control.
Figure 6
Figure 6. Relative normalized expression of P. patens Hsp70 superfamily genes during treatment with dehydration stress and rehydration.
The line-chart shows relative expression of Hsp70 genes at different points during treatment with dehydration stress and rehydration, as monitored by RT-qPCR (with Actin as control). Control, P. patens gametophores with no treatment; D 20%, P. patens gametophores air-dried to 20% water loss; D 40%, P. patens gametophores air-dried to 40% water loss; D 80%, P. patens gametophores air-dried to 80% water loss; R 4 h, D 80% P. patens gametophores re-watered for 4 h; R 8 h, D 80% P. patens gametophores re-watered for 8 h. There were five replicates for each treatment, and the experiment repeated at least three times. Values are mean ± S.D, n = 5. An asterisk indicates that the value of treatment is different from control (p < 0.05).
Figure 7
Figure 7. Cis-element analysis of promoter sequences of genes for Hsp70s localized to different cellular locations and induced under different abiotic stress treatments.
Over-representation of known cis-elements in promoters of Hsp70 superfamily genes was extracted according to the E-value. Logo representations of known cis-elements are on the vertical axis, and the different cellular locations and treatments are on the horizontal axis. Colored boxes represent log 10-transformed average E-value of cis-element and cellular locations and treatment with a significant statistical link.
Figure 8
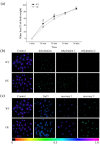
Figure 8. Overexpression PpcpHsp70-2 plants showed salt and dehydration tolerance.
(a) Time courses of water loss from gametophores of wild-type (WT) and over-expression PpcpHsp70-2 (OE) plants. Water loss was calculated as the percentage of initial fresh weight. (b) Chlorophyll florescence of wild-type and overexpression plants during the course of dehydration and rehydration. P. patens gametophores air-dried to 80% water loss (dehydration) and then re-watered for 1 d (rehydration 1) and 2 d (rehydration 2) at room temperature. (c) Chlorophyll florescence of wild-type and overexpression plants after NaCl treatment and recovery at normal growth conditions. P. patens gametophores were treated on plates with 500 mM NaCl for 3 d and then transferred to normal conditions for recovery periods of 1 d (recovery 1) and 2 d (recovery 2). There were five replicates for each treatment, and the experiment repeated at least three times. Values are mean ± S.D, n = 5. An asterisk indicates that the value of treatment is different from control (p < 0.05).

Similar articles

Cited by

References

    1. Feder M. E. & Hofmann G. E. Heat-shock proteins, molecular chaperones, and the stress response: Evolutionary and ecological physiology. Annu Rev Physiol 61, 243–282 (1999). - PubMed
    1. Georgopoulos C. & Welch W. J. Role of the major heat-shock proteins as molecular chaperones. Annu Rev Cell Biol 9, 601–634 (1993). - PubMed
    1. Craig E. A., Gambill B. D. & Nelson R. J. Heat-shock proteins - molecular chaperones of protein biogenesis. Microbiol Rev 57, 402–414 (1993). - PMC - PubMed
    1. Mayer M. P. & Bukau B. Hsp70 chaperones: Cellular functions and molecular mechanism. Cell Mol Life Sci 62, 670–684 (2005). - PMC - PubMed
    1. Saidi Y. et al. The heat shock response in moss plants is regulated by specific calcium-permeable channels in the plasma membrane. Plant Cell 21, 2829–2843 (2009). - PMC - PubMed

Publication types

MeSH terms

Substances