. 2016 Sep 19:5:e13214.
doi: 10.7554/eLife.13214.

Cell type-specific long-range connections of basal forebrain circuit

Affiliations

Cell type-specific long-range connections of basal forebrain circuit

Johnny Phong Do et al. Elife. .

Erratum in

Abstract

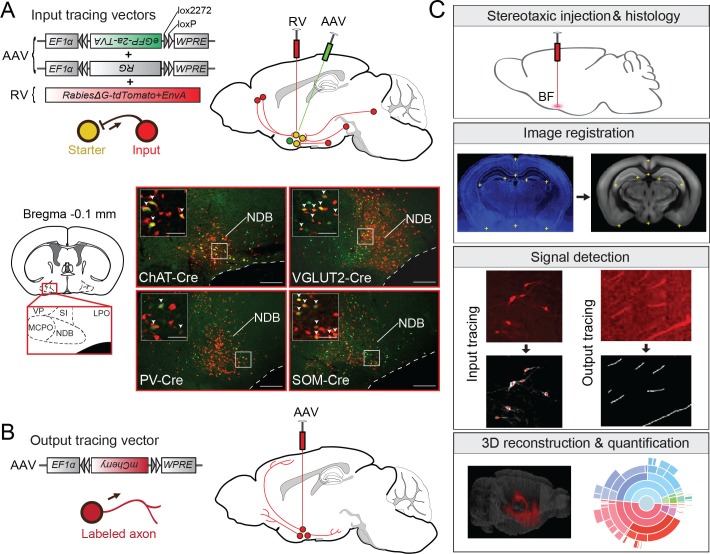
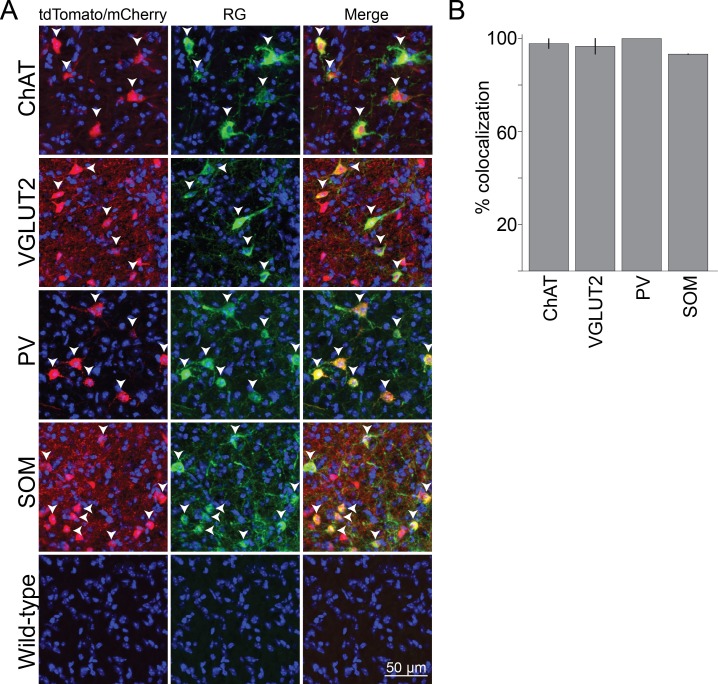
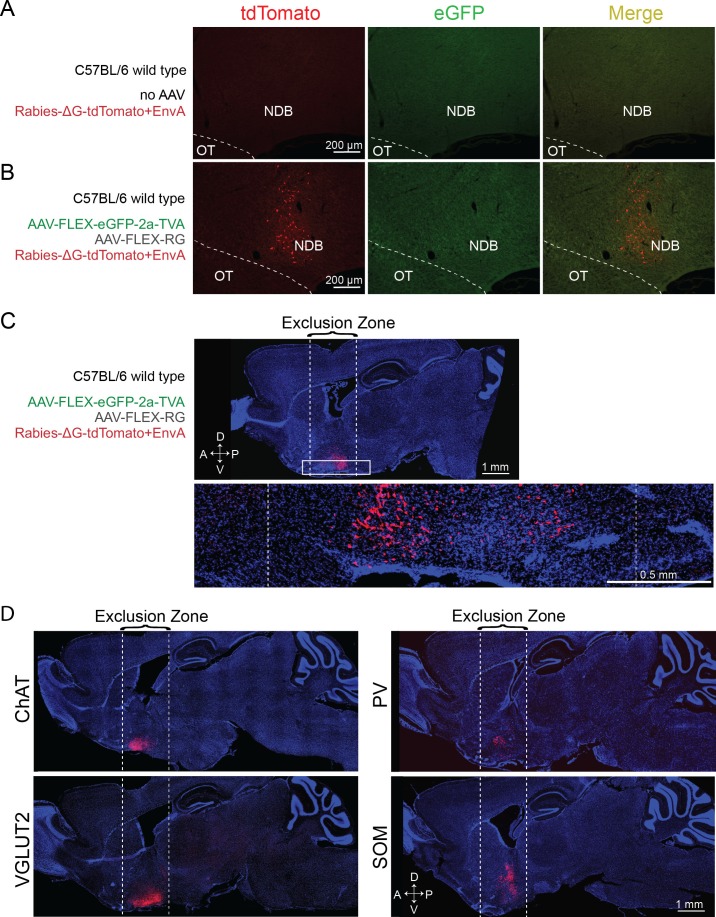
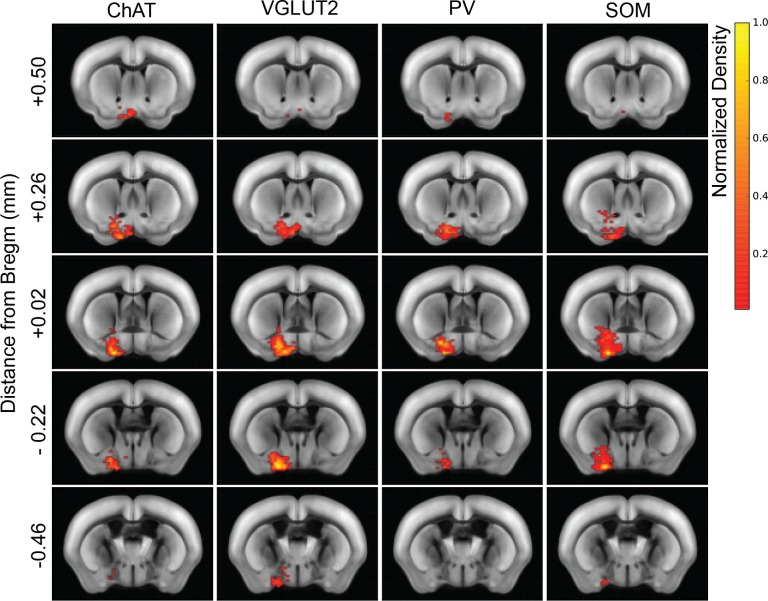
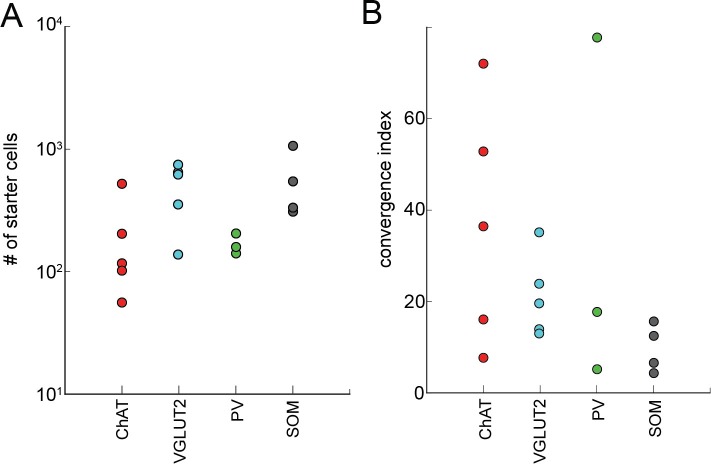
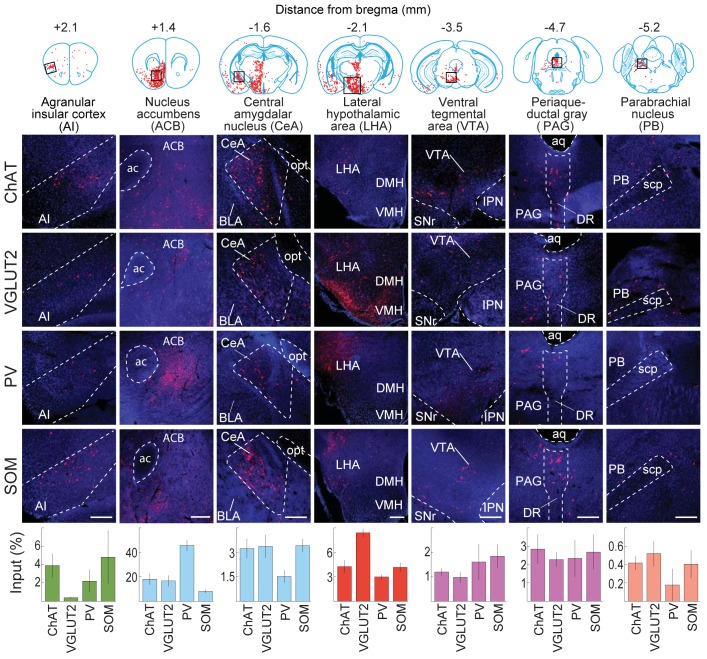
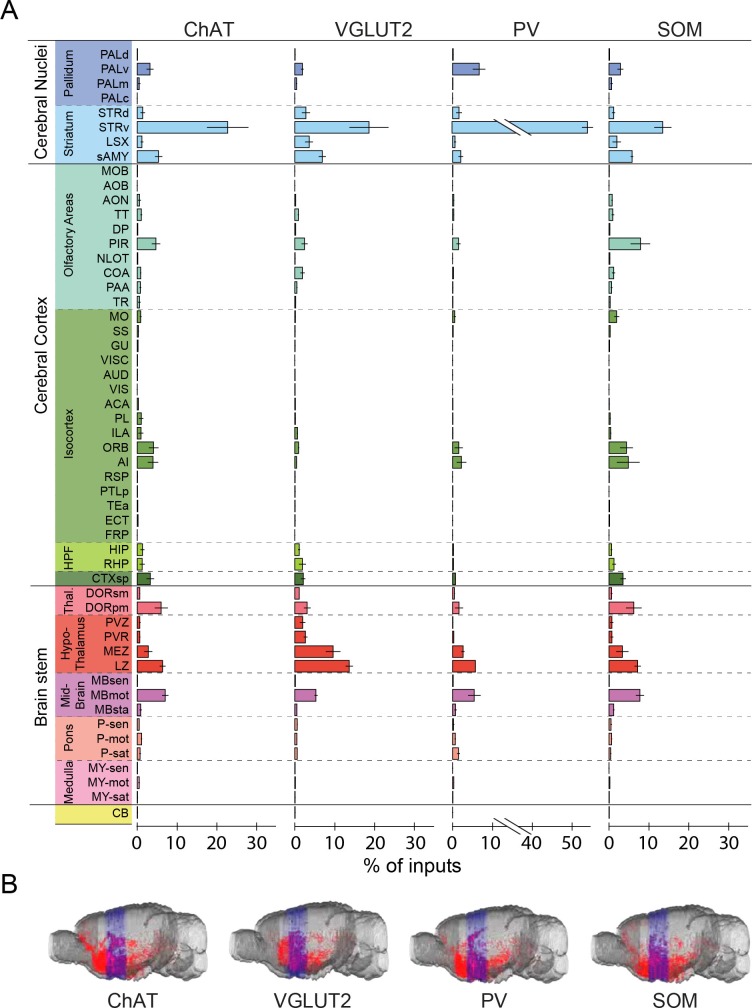
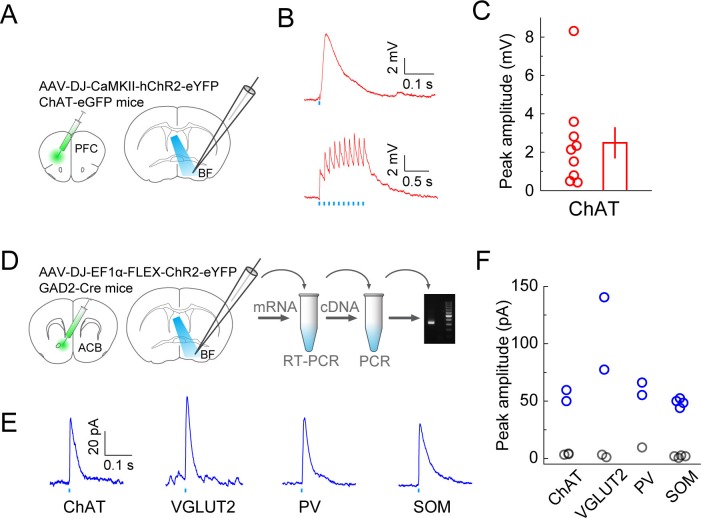
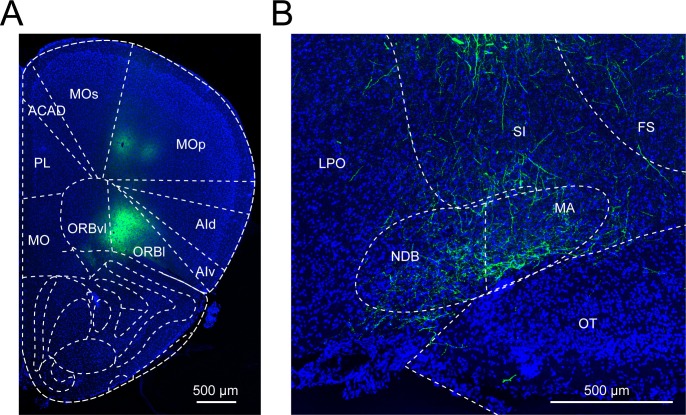
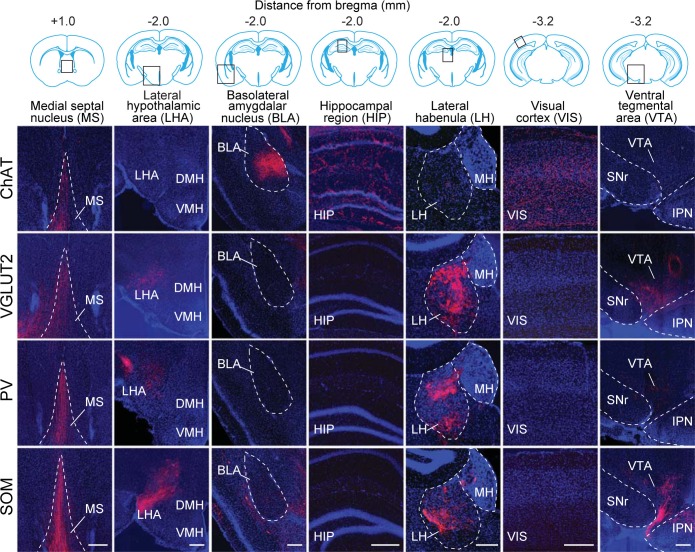
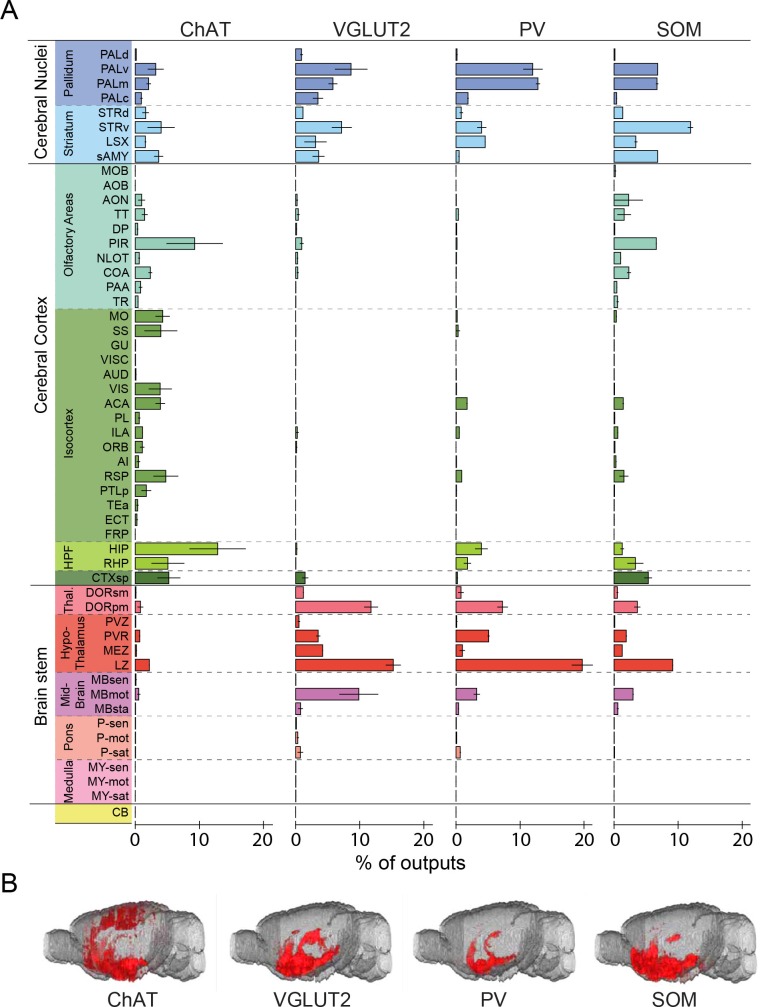
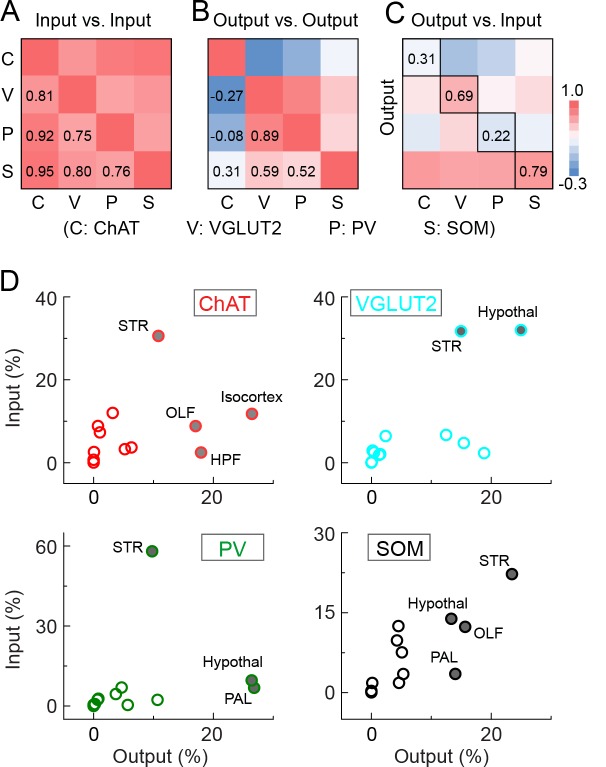
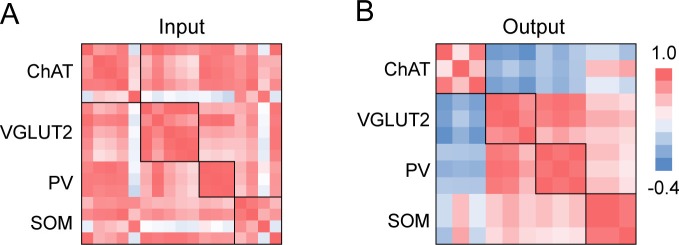
The basal forebrain (BF) plays key roles in multiple brain functions, including sleep-wake regulation, attention, and learning/memory, but the long-range connections mediating these functions remain poorly characterized. Here we performed whole-brain mapping of both inputs and outputs of four BF cell types - cholinergic, glutamatergic, and parvalbumin-positive (PV+) and somatostatin-positive (SOM+) GABAergic neurons - in the mouse brain. Using rabies virus -mediated monosynaptic retrograde tracing to label the inputs and adeno-associated virus to trace axonal projections, we identified numerous brain areas connected to the BF. The inputs to different cell types were qualitatively similar, but the output projections showed marked differences. The connections to glutamatergic and SOM+ neurons were strongly reciprocal, while those to cholinergic and PV+ neurons were more unidirectional. These results reveal the long-range wiring diagram of the BF circuit with highly convergent inputs and divergent outputs and point to both functional commonality and specialization of different BF cell types.

Keywords: anatomy; basal forebrain; cholinergic; mouse; neuroscience; parvalbumin; rabies virus; somatostatin.


Conflict of interest statement

LL: Reviewing editor, eLife. The other authors declare that no competing interests exist.

Figures

Figure 1.
Figure 1.. Experimental and analysis procedures for cell-type-specific circuit tracing.
(A) RV-mediated transsynaptic retrograde tracing of BF inputs. Upper panel, viral vectors and injection procedure. Lower panel, fluorescence images of BF in the region of the NDB (red box in coronal diagram) in ChAT-, VGLUT2-, PV-, and SOM-Cre mice. Scale bar, 200 µm. Inset, enlarged view of the region in white box showing starter cells (yellow, expressing both eGFP and tdTomato, indicated by white arrowheads). Scale bar, 50 µm. NDB, diagonal band nucleus; SIB, substantia innominata, basal part; MCPO, magnocellular preoptic nucleus; VP, ventral pallidum; LPO, lateral preoptic area. (B) Viral vector and injection procedure for tracing BF axonal projections. (C) Flow chart showing the main steps in data generation and processing. DOI: http://dx.doi.org/10.7554/eLife.13214.002
Figure 1—figure supplement 1.
Figure 1—figure supplement 1.. Cell-type specificity of Cre-dependent rabies glycoprotein expression.
(A) Colocalization of rabies glycoprotein immunostaining with Cre expression (indicated by tdTomato or mCherry reporters) in each of the four Cre lines. White arrowheads indicate cells with colocalization. No rabies glycoprotein expression was detected when injected into wild type mice. (B) Percentage of rabies glycoprotein expressing cells that are positive for tdTomato or mCherry, averaged across brain samples. Error bar, ± standard deviation (91 ChAT cells; 89 VGLUT2 cells; 70 PV cells; 100 SOM cells; n = 2 mice per line). DOI: http://dx.doi.org/10.7554/eLife.13214.003
Figure 1—figure supplement 2.
Figure 1—figure supplement 2.. Control experiments for RV tracing of inputs.
(A) Injection of RV without prior AAV injection resulted in no tdTomato-labeled neurons, indicating dependence of the RV infection on AAV-induced expression of TVA. (B) Injection of AAV2-EF1α-FLEX-eGFP-2a-TVA and AAV2-EF1α-FLEX-RG followed by RV injection in the BF of wild-type mice not expressing Cre led to no eGFP expression, indicating Cre-dependence of the AAV vector. However, tdTomato-labeled neurons were observed at the injection site (radius < 500 μm), most likely due to the leaky expression of a low level of TVA, as previously noted (Miyamichi et al., 2013; Wall et al., 2013). (C) Upper panel, Sagittal view of the experiment shown in B (but a different brain sample), with a tdTomato expression near the injection site but not outside of the exclusion zone. Lower panel, enlarged view of the region in the white rectangle. (D) Sagittal view of brain samples injected with AAV2-EF1α-FLEX-eGFP-2a-TVA followed by RV in the BF of different Cre lines (without AAV2- EF1α-FLEX-RG that enables transsynaptic spread of RV) to determine the spatial extent of the exclusion zone in the RV tracing experiments. After excluding the horizontal limb of the diagonal band of Broca (part of the BF region targeted), we found very few (<30 per brain) labeled cells beyond 850 μm. Subsequent analyses were thus performed only in coronal sections >850 μm from the injection site and outside of the horizontal limb of the diagonal band of Broca. DOI: http://dx.doi.org/10.7554/eLife.13214.004
Figure 1—figure supplement 3.
Figure 1—figure supplement 3.. Heat map distribution of starter cells.
Normalized starter cell density across all samples for each cell type. Each brain slice depicts the density accumulated from an anterior-posterior axis range of 0.24 mm. DOI: http://dx.doi.org/10.7554/eLife.13214.005
Figure 1—figure supplement 4.
Figure 1—figure supplement 4.. The relationship between the numbers of starter cells and input cells.
(A) The total number of starter cells for each brain sample. (B) The convergence index (input cell count/starter cell count) for each brain sample grouped by cell-type. DOI: http://dx.doi.org/10.7554/eLife.13214.006
Figure 2.
Figure 2.. Inputs to each BF cell type from selected brain regions.
Examples of RV-labeled input neurons to each of the four BF cell types in seven selected brain structures (black box in each coronal diagram). Scale bar, 200 µm. In each coronal diagram, RV-labeled neurons detected in all four brain samples are indicated by red dots. Bottom panel, mean percentage of input neurons in each brain structure for the four BF cell types. Error bar, ± s.e.m. Bar color indicates which of the 12 regions the given brain structure belongs to as depicted in Figure 3. ac, anterior commissure; aq, cerebral aqueduct; BLA, basolateral amygdalar nucleus; DMH, dorsomedial nucleus of the hypothalamus; DR, dorsal nucleus raphe; IPN, interpeduncular nucleus; opt, optic tract; scp, superior cerebellar peduncles; SNr, substantia nigra reticularis; VMH, ventromedial hypothalamic nucleus. DOI: http://dx.doi.org/10.7554/eLife.13214.007
Figure 3.
Figure 3.. Whole-brain distributions of inputs to the four BF cell types.
(A) Percentages of retrogradely labeled input neurons in 53 brain areas (ChAT, n = 5 mice; VGLUT2, n = 5; PV, n = 3; SOM, n = 4). Brain areas are grouped into 12 generalized, color-coded brain structures. HPF, hippocampal formation. Abbreviations of the 53 brain areas and their percentages of inputs are listed in Figure 3—source data 1. Error bar, ± s.e.m. Since labeled neurons in coronal sections near the injection site were excluded from analysis (see Figure 1—figure supplement 2), inputs from the pallidum are likely to be underestimated. (B) Whole-brain 3D reconstruction of the inputs to the four BF cell types. The blue-shaded area denotes the region excluded for analysis due to potential local contamination (see Figure 1—figure supplement 2). DOI: http://dx.doi.org/10.7554/eLife.13214.008
Figure 4.
Figure 4.. Optogenetic characterization of monosynaptic inputs to the BF from PFC and ACB.
(A) Schematic of experiment. ChR2 was expressed in excitatory neurons in the prefrontal cortex of ChAT-eGFP mice by injecting AAV-DJ-CaMKIIα-hChR2-eYFP. Coronal slices of the BF were used for recording experiments. (B) Excitatory postsynaptic potentials recorded from ChAT+ neurons (under whole-cell current clamp) evoked by blue-light activation of the prefrontal cortical axons. Upper, response to a single light pulse (5 ms) in an example ChAT+ neuron; lower, responses to 10 pulses at 10 Hz recorded from a different ChAT+ neuron. (C) Summary of the peak amplitude of the response to a single light pulse. Each circle represents data from one BF ChAT+ neuron (n = 9 neurons from 2 mice). Bar, mean ± s.e.m. (D) Diagram illustrates virus injection site in the ACB and recording site in the BF. AAV-DJ-EF1α-FLEX-ChR2-eYFP was injected into the ACB of GAD2-Cre mice and whole-cell voltage-clamp recordings (clamped at 0 volts) were made from BF neurons. Single-cell gene-expression analysis was performed after each recording session to identify the cell type of each recorded neuron. (E) Example traces of laser-evoked responses in the four BF cell types. (F) Summary of the peak current amplitude of each neuron’s response (ChAT+, n = 5 neurons from 5 mice; VGLUT2+, n = 4 neurons from 4 mice; PV+, n = 3 neurons from 3 mice; SOM+, n = 8 neurons from 4 mice). Gray indicates no significant response. DOI: http://dx.doi.org/10.7554/eLife.13214.011
Figure 4—figure supplement 1.
Figure 4—figure supplement 1.. Basal forebrain input from the prefrontal cortex.
(A) Example fluorescence image of a coronal section at the virus injection site in the prefrontal cortex (PFC). (B) Example fluorescence image of the PFC axon fibers in the basal forebrain from the same experiment as shown in panel A. DOI: http://dx.doi.org/10.7554/eLife.13214.012
Figure 5.
Figure 5.. Axon projections of each BF cell type to selected brain regions.
Examples of axon projections from each of the four BF cell types to seven selected brain structures (black box in each coronal diagram). Scale bar, 250 µm. DMH, dorsomedial nucleus of the hypothalamus; IPN, interpeduncular nucleus; MH, medial habenula; SNr, substantia nigra reticularis; VMH, ventromedial hypothalamic nucleus. DOI: http://dx.doi.org/10.7554/eLife.13214.013
Figure 6.
Figure 6.. Whole-brain distributions of axonal projections from the four BF cell types.
(A) Percentages of labeled axons in 53 brain areas (ChAT, n = 3 mice; VGLUT2, n = 3; PV, n = 3; SOM, n = 3). Error bar, ± s.e.m. Abbreviations of the 53 brain areas and their percentages of inputs are listed in Figure 6—source data 1. (B) Whole-brain 3D reconstruction of axon projections from each of the four BF cell types. Note that although VGLUT2+ and PV+ neuron projections showed the similar spatial distribution, there were fewer labeled axons from PV+ than VGLUT2+ neurons. DOI: http://dx.doi.org/10.7554/eLife.13214.014
Figure 7.
Figure 7.. Comparison of input and output distributions.
(A) Matrix of correlation coefficients (CCs) between input distributions of each pair of cell types. (B) Similar to A, for output distributions. (C) CCs between input and output distributions. All CCs were computed at the spatial scale of the 12 major brain subdivisions (Figure 7—source data 1). (D) Percentage of input vs. percentage of output in each region, for each of the four BF cell types. Filled circles, strongly connected brain regions contributing to the high CCs for glutamatergic and SOM+ neurons and low CCs for cholinergic and PV+ neurons in C. DOI: http://dx.doi.org/10.7554/eLife.13214.017
Figure 7—figure supplement 1.
Figure 7—figure supplement 1.. Correlation coefficients between individual brain samples for input and output distributions.
(A) Input. (B) Output. Note the higher CCs within the boxes along the diagonal (between samples of the same cell type) than those outside of the boxes (between samples of different cell types). The CCs exactly along the diagonal (each brain sample with itself, CC = 1) were excluded from analysis. DOI: http://dx.doi.org/10.7554/eLife.13214.019

Similar articles

Cited by

References

    1. Asanuma C. Axonal arborizations of a magnocellular basal nucleus input and their relation to the neurons in the thalamic reticular nucleus of rats. PNAS. 1989;86:4746–4750. doi: 10.1073/pnas.86.12.4746. - DOI - PMC - PubMed
    1. Avila I, Lin SC. Distinct neuronal populations in the basal forebrain encode motivational salience and movement. Frontiers in Behavioral Neuroscience. 2014;8:421. doi: 10.3389/fnbeh.2014.00421. - DOI - PMC - PubMed
    1. Bakin JS, Weinberger NM. Induction of a physiological memory in the cerebral cortex by stimulation of the nucleus basalis. PNAS. 1996;93:11219–11224. doi: 10.1073/pnas.93.20.11219. - DOI - PMC - PubMed
    1. Beier KT, Steinberg EE, DeLoach KE, Xie S, Miyamichi K, Schwarz L, Gao XJ, Kremer EJ, Malenka RC, Luo L. Circuit architecture of VTA dopamine neurons revealed by systematic input-output mapping. Cell. 2015;162:622–634. doi: 10.1016/j.cell.2015.07.015. - DOI - PMC - PubMed
    1. Brown RE, Basheer R, McKenna JT, Strecker RE, McCarley RW. Control of sleep and wakefulness. Physiological Reviews. 2012;92:1087–1187. doi: 10.1152/physrev.00032.2011. - DOI - PMC - PubMed

Grants and funding

No external funding was received for this work