

Evi1 regulates Notch activation to induce zebrafish hematopoietic stem cell emergence
- PMID: 27638855
- PMCID: PMC5090218
- DOI: 10.15252/embj.201593454
Evi1 regulates Notch activation to induce zebrafish hematopoietic stem cell emergence
Abstract
During development, hematopoietic stem cells (HSCs) emerge from aortic endothelial cells (ECs) through an intermediate stage called hemogenic endothelium by a process known as endothelial-to-hematopoietic transition (EHT). While Notch signaling, including its upstream regulator Vegf, is known to regulate this process, the precise molecular control and temporal specificity of Notch activity remain unclear. Here, we identify the zebrafish transcriptional regulator evi1 as critically required for Notch-mediated EHT In vivo live imaging studies indicate that evi1 suppression impairs EC progression to hematopoietic fate and therefore HSC emergence. evi1 is expressed in ECs and induces these effects cell autonomously by activating Notch via pAKT Global or endothelial-specific induction of notch, vegf, or pAKT can restore endothelial Notch and HSC formations in evi1 morphants. Significantly, evi1 overexpression induces Notch independently of Vegf and rescues HSC numbers in embryos treated with a Vegf inhibitor. In sum, our results unravel evi1-pAKT as a novel molecular pathway that, in conjunction with the shh-vegf axis, is essential for activation of Notch signaling in VDA endothelial cells and their subsequent conversion to HSCs.
Keywords: AKT; VEGF; EVI1; Notch; endothelial‐to‐hematopoietic transition; hematopoietic stem cells.
© 2016 The Authors.
Figures
- A
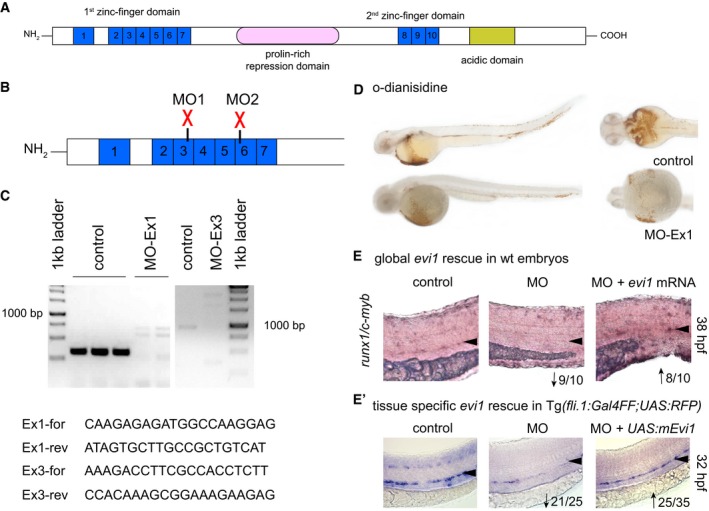
Schematic representation of protein domains of the transcription factor Evi1. Blue boxes represent zinc finger motifs in the Evi1 protein. Other functional domains are indicated.
- B
The evi1 splice donor MO, depicted by red crosses, target either the 3rd (MO1) or the 6th (MO2) zinc finger in the first zinc finger domain.
- C
RT–PCR of evi1 in embryos injected with evi1 MO1 or MO2 indicates splice modification. Corresponding primer pairs are shown. Expected wt bands for MO1 389 bp, in evi1 morphants 2,526 bp. For MO2: expected wt bands 1,100 bp, 5,695 bp for evi1 morphants.
- D
No pooling was observed by o‐dianisidine staining in evi1 morphants at 38 hpf.
- E, E′
Co‐injection of capped evi1 mRNA (E) or UAS:mEvi1 (in Tg(fli.1:Gal4FF;UAS:RFP) embryos, E') together with the evi1 MO rescues the HSC phenotype, shown by restored runx1/c‐myb expression in the VDA, marked with black arrowheads. Numbers indicate the amount of embryos with the respective phenotype/total number of embryos analyzed in each experiment. Arrows indicate up‐ or downregulation of runx1/c‐myb in each condition. Lateral views are shown, anterior to the left, dorsal up.
- A
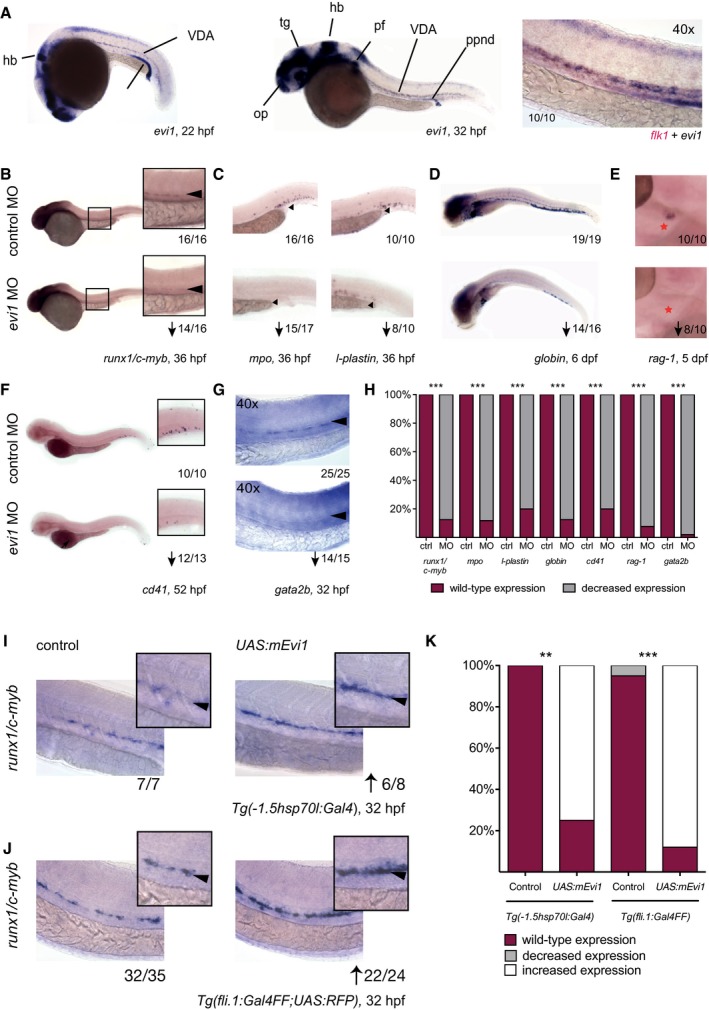
Whole‐mount in situ hybridization (WISH) of evi1 at 20 (left) and 32 (middle) hpf. evi1 expression is visible in various structures of the brain, neuronal structures, the posterior pronephric duct (ppnd), and the branchial arches (ba), as well as in the VDA (ventral dorsal aorta) region. Additionally, evi1 co‐localizes with the endothelial marker flk1 (right).
- B, C
WISH of runx1/c‐myb in HSPCs (B), mpo in neutrophils (left), and l‐plastin (right) in monocytes/macrophages (C) at 36 hpf in control (upper)‐ and evi1 MO (lower)‐injected embryos.
- D–G
WISH of globin in erythrocytes of 6 dpf embryos (D), of rag‐1 in the thymus of 5 dpf embryos (E; red asterisk), of cd41 at 52 hpf (F), and gata2b at 32 hpf (G) for both control (upper)‐ and evi1 morpholino (lower)‐injected embryos.
- H
Quantitation of results is shown for each gene, displaying the percentages of embryos with normal vs. changed expression in each condition. A Fisher's exact test was applied to calculate statistical significance. ***P < 0.001.
- I
WISH of runx1/c‐myb in HSPCs of uninjected control and UAS:mEvi1 plasmid DNA‐injected Tg(‐1.5hsp70l:Gal4) embryos with heat‐shock induction performed at 14 hpf.
- J
WISH of runx1/c‐myb in HSPCs of uninjected control and UAS:mEvi1 mRNA in Tg(fli.1:Gal4FF;UAS:RFP) embryos, leading to endothelial‐specific evi1 overexpression.
- K
Graph displays quantitation of results from (I) and (J), displaying the percentages of embryos with normal vs. changed expression in each condition. A Fisher's exact test was applied to calculate statistical significance. **P < 0.01, ***P < 0.001.
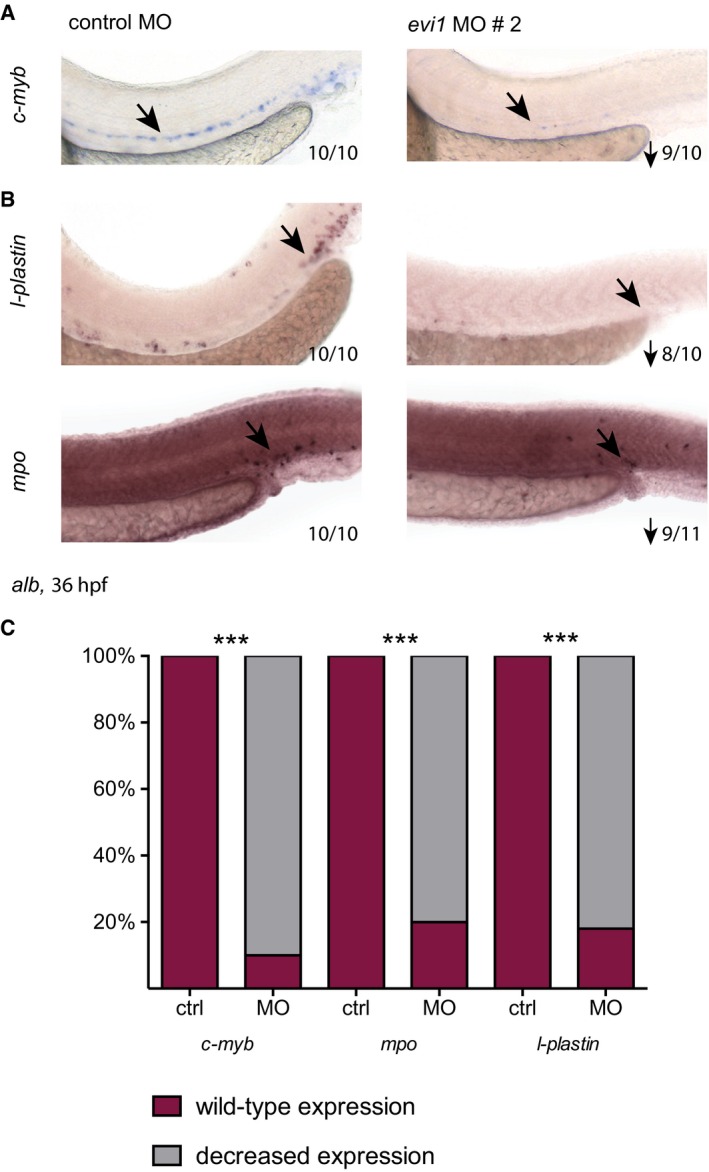
WISH of c‐myb in control‐ and evi1 MO2‐injected albino (alb) embryos.
WISH of l‐plastin (upper) and mpo (lower) in control‐ and evi1 MO2‐injected alb embryos.
For each analyzed gene, quantitation of results is shown, displaying the percentages of embryos with normal vs. decreased gene expression for each condition. A Fisher's exact test was applied to calculate statistical significance (***P < 0.001).
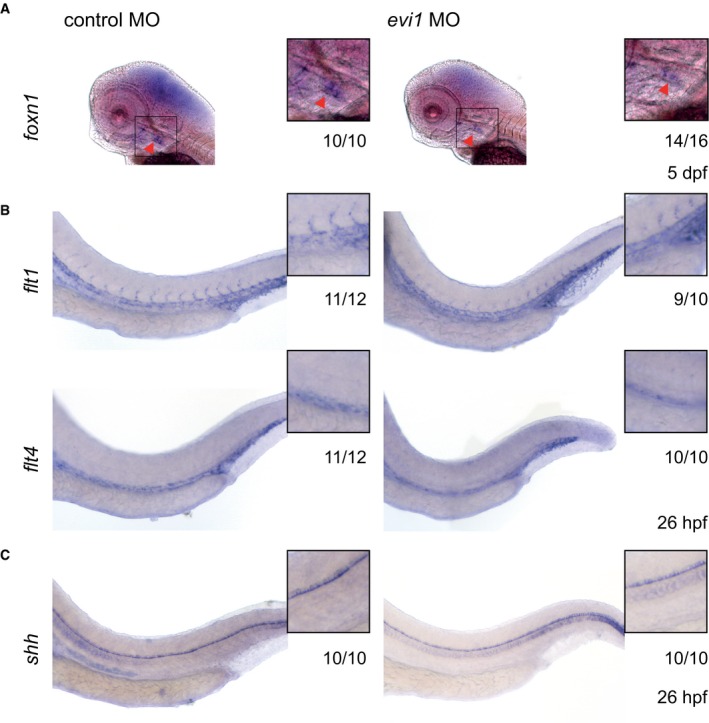
WISH of foxn1 in the thymus epithelium of both control (left)‐ and evi1 MO‐injected (right) 5 dpf embryos.
WISH of endothelial‐specific flt1 (upper) and flt4 (lower) in both control (left)‐ and evi1 MO‐injected (right) 26 hpf embryos.
WISH of shh in the notochord of both control‐ and evi1 MO‐injected embryos.
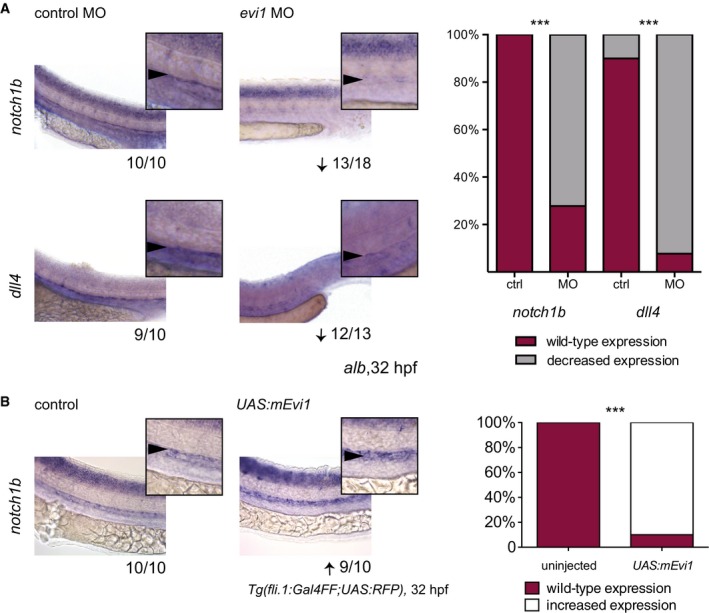
WISH of notch1b (upper) and dll4 (lower) in both control (left)‐ and evi1 MO‐injected embryos (right).
WISH of notch1b in uninjected (left) and UAS:mEvi1 plasmid DNA‐injected (right) Tg(fli.1:Gal4FF;UAS:RFP) embryos resulting in endothelial‐specific evi1 induction.
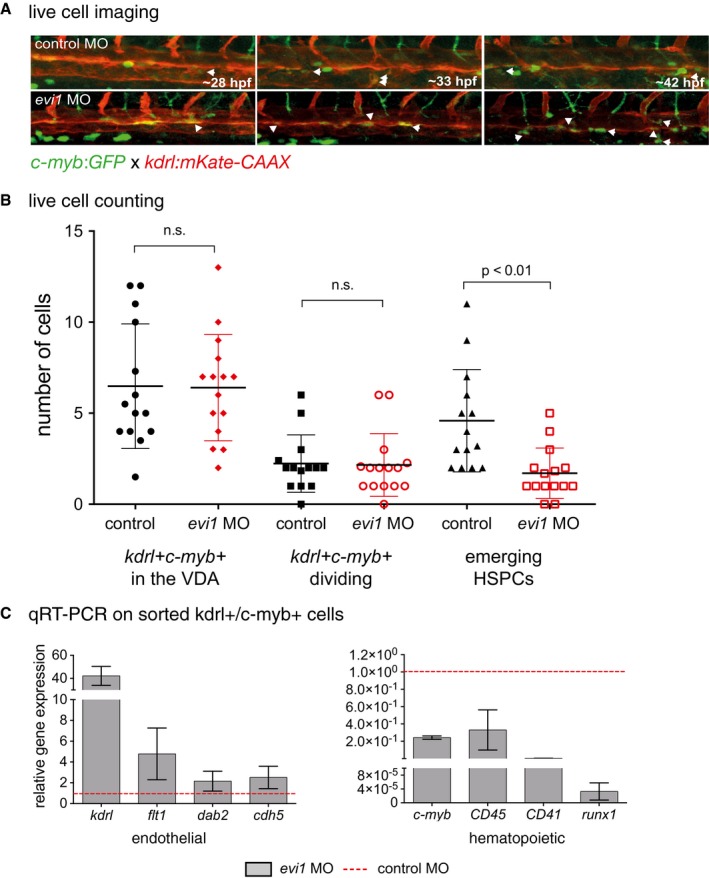
Confocal time‐lapse live imaging was performed in Tg(c‐myb:GFP; kdrl:mKate‐CAAX) embryos from 28 to 42 hpf (Movie EV1). Shown are three representative time points in which the transformation from hemogenic endothelial cells to the hematopoietic fate is visible, indicated by the white arrowheads. For each time point, merged images are shown. White arrowheads denote double‐positive cells.
Cell counts of total numbers of kdrl + cmyb1 + cells “in view”, dividing and, respectively, emerging HSPCs. n = 10 movies from n = 3 biological replicates were analyzed. A nonparametric Mann–Whitney U‐test was used to test for statistical significance, and error bars are shown as ± s.d.
Gene expression analysis of endothelial (kdrl, flt1, dab2, cdh5) and blood‐specific genes (c‐myb, CD45, CD41, runx1) in sorted kdrl + c‐myb + cells from 34 hpf Tg(c‐myb:GFP; kdrl:mKate‐CAAX) embryos. Cells were isolated from 15 to 25 pooled embryos per sample. Three biological experiments were performed with one representative shown. Error bars indicate s.d. of three technical replicates for each representative experiment.
- A–E
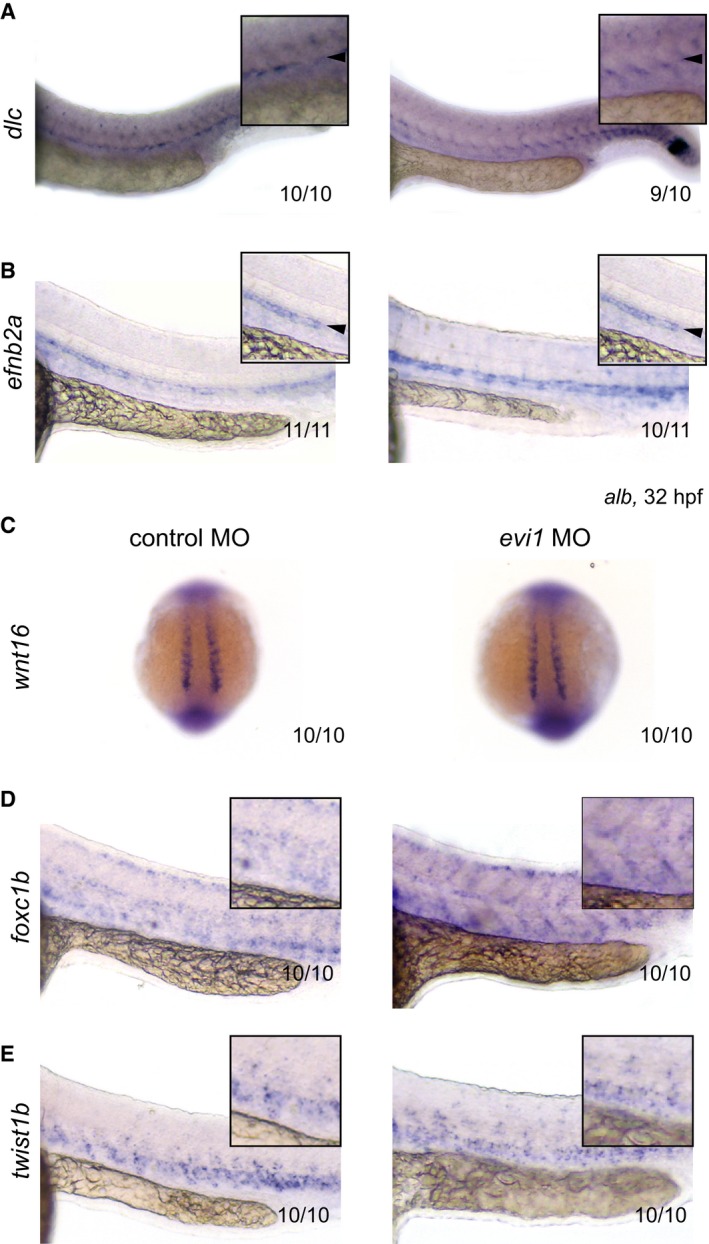
WISH of dlc (A), efnb2a (B), wnt16 (C), foxc1b (D), and twist1b (E) in control‐injected (left) or evi1 MO‐injected alb embryos (right).
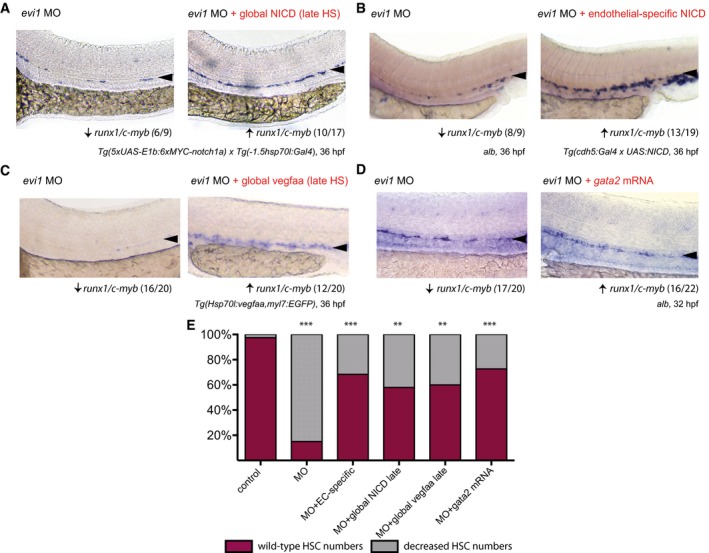
WISH for runx1/c‐myb in 36 hpf evi1 morphant (left) and evi1 morphant transgenic Tg(5xUAS‐E1b:6xMYC‐notch1a;‐1.5hsp70l:Gal4) embryos (right) with global heat‐shock (HS) induction at 20 hpf.
WISH for runx1/c‐myb in 36 hpf evi1 morphant (left) and evi1 morphant transgenic Tg(5xUAS‐E1b:6xMYC‐notch1a; cdh5:gal4ff) embryos with endothelial‐specific NICD induction (right).
WISH for runx1/c‐myb in 36 hpf evi1 morphant (left) and evi1 morphant transgenic Tg(Hsp70l:vegfaa; myl7:eGFP) embryos (right) with global heat‐shock induction at 20 hpf.
WISH for runx1/c‐myb in 32 hpf evi1 MO‐injected embryos (left) and embryos injected with both evi1 MO and capped gata2 mRNA (right).
Quantitation of all rescue experiments. Shown are the percentages of embryos displaying normal or changed runx1/c‐myb expression. A Fisher's exact test was applied to calculate statistical significance. n.s., not significant; ***P < 0.001; **P < 0.01.
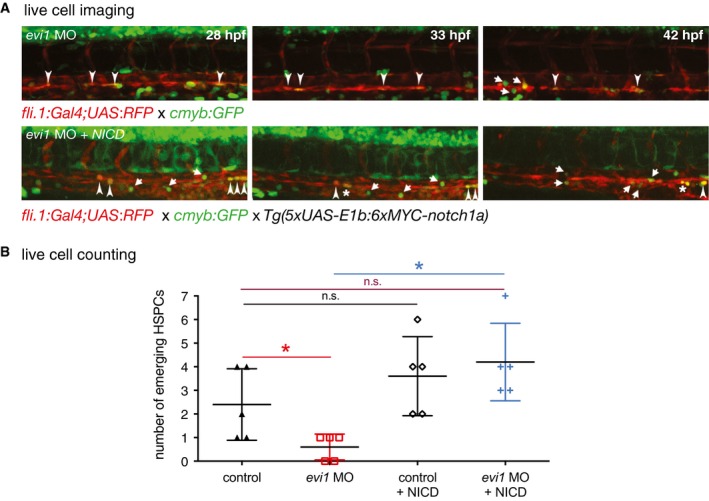
Confocal time‐lapse live imaging was performed in Tg(c‐myb:GFP; fli.1:UAS;Gal4:RFP) evi1 morphant embryos (top, Movie EV2) or in Tg(c‐myb:GFP; fli.1:UAS;Gal4:RFP) crossed to Tg(5xUAS‐E1b:6xMYC‐notch1a) embryos prior to MO injection (bottom, Movie EV3) from 28 to 42 hpf. Shown are three representative time points, in which the transformation from hemogenic endothelial cells to the hematopoietic fate is visible. For each time point, merged images are shown. NICD induction controlled by endothelial fli.1 (lower panel) can rescue the evi1 morphant phenotype and increases the number of HSPCs cells emerging from the VDA (arrows). Arrowheads indicate double‐positive cells. Dividing cells are marked by an asterisk.
Cell counts of emerging HSPCs in control and evi1 morphant fish with or without endothelial NICD induction. At least n = 5 movies from n = 3 biological replicates were analyzed. A nonparametric Mann–Whitney U‐test was used to test for statistical significance, and error bars are shown as ± s.d. n.s., not significant, *P < 0.05.
- A
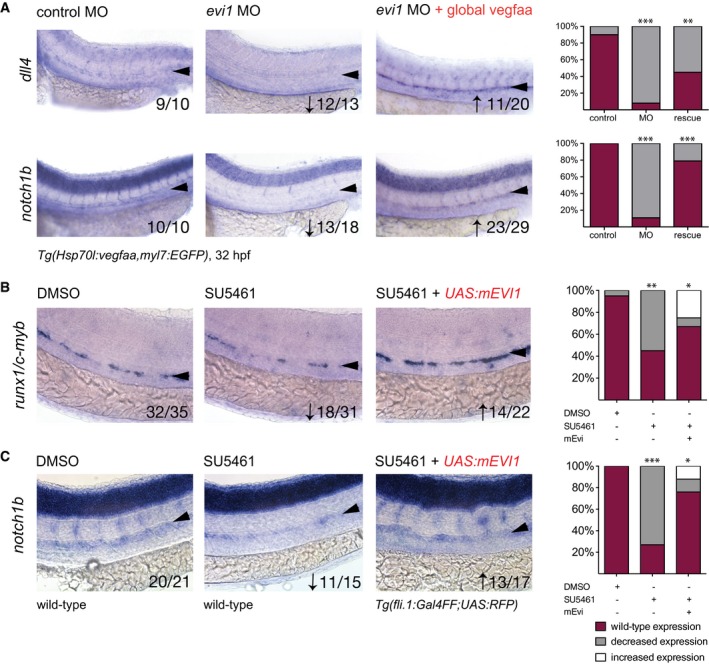
WISH of dll4 (upper) and notch1b (lower) in control‐injected embryos (left), evi1 morphants (middle), and evi1 morphant transgenic Tg(Hsp70l:vegfaa; myl7:eGFP) embryos at 32 hpf after heat‐shock induction at 20 hpf (right).
- B, C
WISH of runx1/c‐myb (B) or notch1b (C) after treatment with DMSO (left), the VEGF receptor inhibitor SU5461 (middle), and, respectively, SU5461 after injection of UAS:mEvi1 (inducing endothelial evi1 expression) in Tg(fli.1:Gal4FF;UAS:RFP) embryos (right).
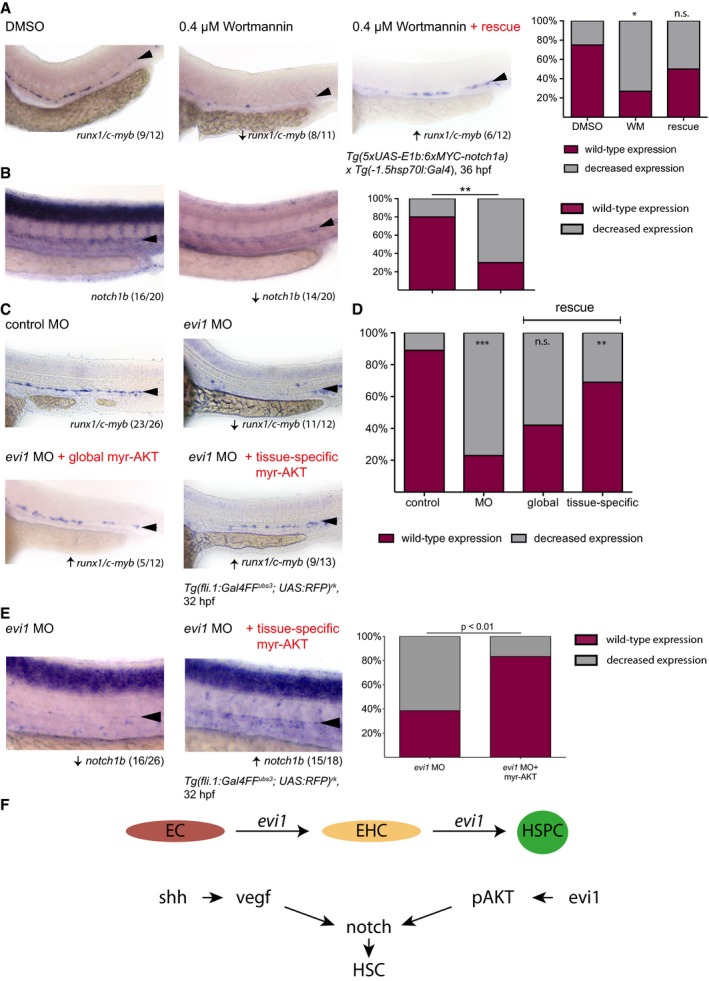
Expression of runx1/c‐myb in the VDA after treatment with DMSO vehicle control (left), the PI3K/AKT inhibitor wortmannin (WM, middle), and after joined treatment with WM and enforced NICD expression via HS at 14 hpf in Tg(5xUAS‐E1b:6xMYC‐notch1a;‐1.5hsp70l:Gal4) embryos (right). Graph displays quantitation of results. Shown are the percentages of embryos with normal or decreased runx1/c‐myb expression for each condition.
Expression of notch1b after treatment with DMSO vehicle control (left) or wortmannin (WM, middle). Graph displays quantitation of results. Shown are the percentages of embryos with normal or decreased notch1b expression for each condition.
WISH for runx1/c‐myb in control‐injected embryos (upper left), evi1 morphants (upper right), or, respectively, evi1 MO with myr‐AKT‐injected embryos with HS at 14 hpf (lower right) and evi1 MO with UAS:myr‐AKT‐injected transgenic Tg(fli.1:Gal4FF ubs3 ; UAS:RFP) rk embryos.
Quantitation of results from (C). Shown are the percentages of embryos with normal or decreased runx1/c‐myb expression for each condition.
WISH for notch1b in evi1 MO‐injected (left) and evi1 plus UAS:myr‐AKT‐injected transgenic Tg(fli.1:Gal4FF ubs3 ; UAS:RFP) rk embryos (right). Graph displays quantitation of results. Shown are the percentages of embryos with normal or decreased notch1b expression for each condition.
Schematic illustration of the role of Evi1 during HSPC emergence and the dual regulation of Notch by the shh–vegf and the evi1–pAKT axes.
Similar articles
-
Hif-1α and Hif-2α regulate hemogenic endothelium and hematopoietic stem cell formation in zebrafish.Blood. 2018 Mar 1;131(9):963-973. doi: 10.1182/blood-2017-07-797795. Epub 2018 Jan 16. Blood. 2018. PMID: 29339404
-
A genetic screen in zebrafish defines a hierarchical network of pathways required for hematopoietic stem cell emergence.Blood. 2009 Jun 4;113(23):5776-82. doi: 10.1182/blood-2008-12-193607. Epub 2009 Mar 30. Blood. 2009. PMID: 19332767 Free PMC article.
-
Hey2 acts upstream of Notch in hematopoietic stem cell specification in zebrafish embryos.Blood. 2010 Sep 23;116(12):2046-56. doi: 10.1182/blood-2009-11-252635. Epub 2010 May 28. Blood. 2010. PMID: 20511544
-
Evi1 forms a bridge between the epigenetic machinery and signaling pathways.Oncotarget. 2011 Jul;2(7):575-86. doi: 10.18632/oncotarget.304. Oncotarget. 2011. PMID: 21795762 Free PMC article. Review.
-
Notch signaling and the emergence of hematopoietic stem cells.Dev Dyn. 2020 Nov;249(11):1302-1317. doi: 10.1002/dvdy.230. Epub 2020 Aug 28. Dev Dyn. 2020. PMID: 32996661 Review.
Cited by
-
Aberrant ecotropic viral integration site-1 (EVI-1) and myocyte enhancer factor 2 C gene (MEF2C) in adult acute myeloid leukemia are associated with adverse t (9:22) & 11q23 rearrangements.Ann Hematol. 2024 Jul;103(7):2355-2364. doi: 10.1007/s00277-024-05779-9. Epub 2024 May 7. Ann Hematol. 2024. PMID: 38710877 Free PMC article.
-
Epigenetic landscape reveals MECOM as an endothelial lineage regulator.Nat Commun. 2023 Apr 25;14(1):2390. doi: 10.1038/s41467-023-38002-w. Nat Commun. 2023. PMID: 37185814 Free PMC article.
-
Twist1 regulates embryonic hematopoietic differentiation through binding to Myb and Gata2 promoter regions.Blood Adv. 2017 Aug 31;1(20):1672-1681. doi: 10.1182/bloodadvances.2017006056. eCollection 2017 Sep 12. Blood Adv. 2017. PMID: 29296814 Free PMC article.
-
Targeted Disruption of TCF12 Reveals HEB as Essential in Human Mesodermal Specification and Hematopoiesis.Stem Cell Reports. 2017 Sep 12;9(3):779-795. doi: 10.1016/j.stemcr.2017.07.011. Epub 2017 Aug 10. Stem Cell Reports. 2017. PMID: 28803914 Free PMC article.
-
Modeling hematopoietic disorders in zebrafish.Dis Model Mech. 2019 Sep 6;12(9):dmm040360. doi: 10.1242/dmm.040360. Dis Model Mech. 2019. PMID: 31519693 Free PMC article. Review.
References
-
- Ayllón V, Bueno C, Ramos‐Mejía V, Navarro‐Montero O, Prieto C, Real PJ, Romero T, García‐León MJ, Toribio ML, Bigas A, Menendez P (2015) The Notch ligand DLL4 specifically marks human hematoendothelial progenitors and regulates their hematopoietic fate. Leukemia 29: 1741–1753 - PubMed
-
- Bard‐Chapeau EA, Szumska D, Jacob B, Chua BQ, Chatterjee GC, Zhang Y, Ward JM, Urun F, Kinameri E, Vincent SD, Ahmed S, Bhattacharya S, Osato M, Perkins AS, Moore AW, Jenkins NA, Copeland NG (2014) Mice carrying a hypomorphic Evi1 allele are embryonic viable but exhibit severe congenital heart defects. PLoS One 9: e89397 - PMC - PubMed
Publication types
MeSH terms
Substances
Grants and funding
LinkOut - more resources
Full Text Sources
Other Literature Sources
Medical
Molecular Biology Databases
Research Materials
