. 2016 Nov 4;291(45):23464-23476.
doi: 10.1074/jbc.M116.729152. Epub 2016 Sep 15.

Familial Amyotrophic Lateral Sclerosis-linked Mutations in Profilin 1 Exacerbate TDP-43-induced Degeneration in the Retina of Drosophila melanogaster through an Increase in the Cytoplasmic Localization of TDP-43

Affiliations

Familial Amyotrophic Lateral Sclerosis-linked Mutations in Profilin 1 Exacerbate TDP-43-induced Degeneration in the Retina of Drosophila melanogaster through an Increase in the Cytoplasmic Localization of TDP-43

Koji Matsukawa et al. J Biol Chem. .

Abstract

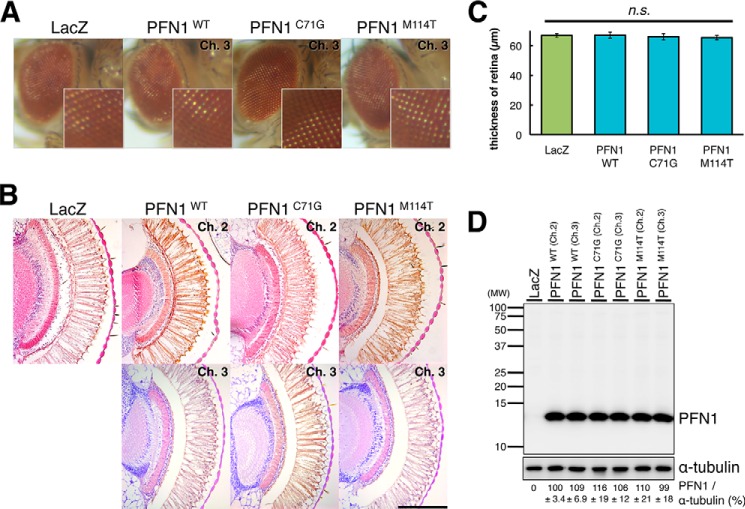
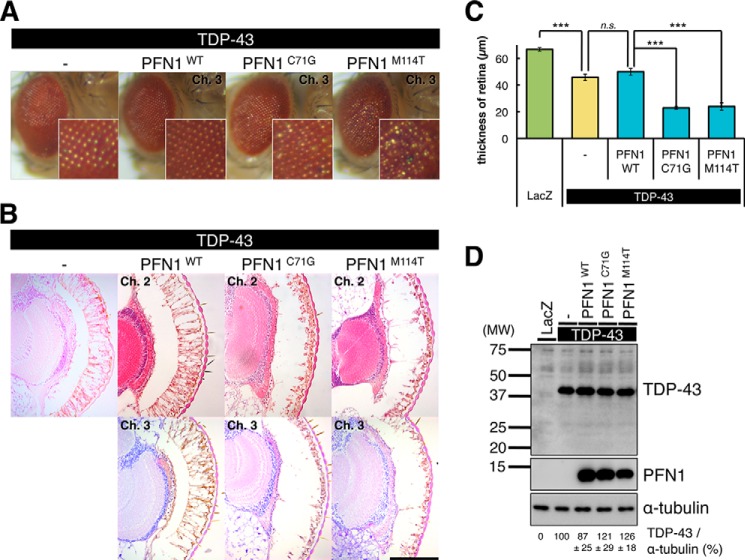
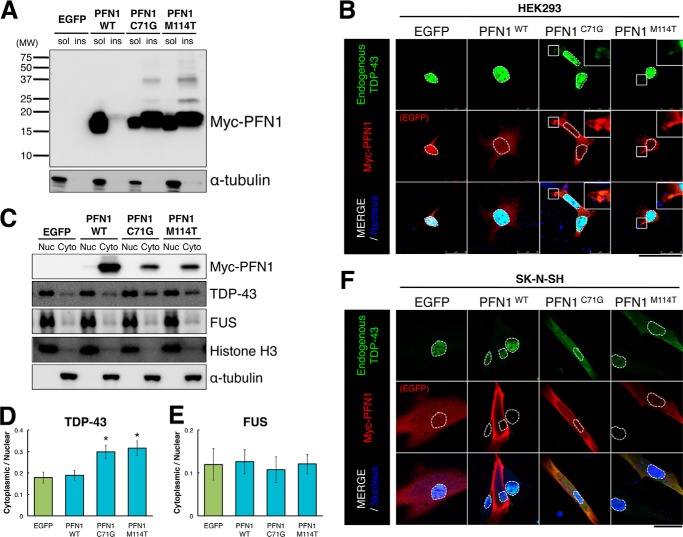
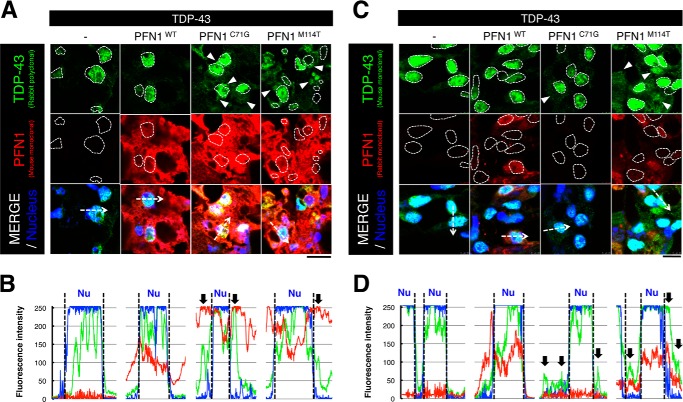
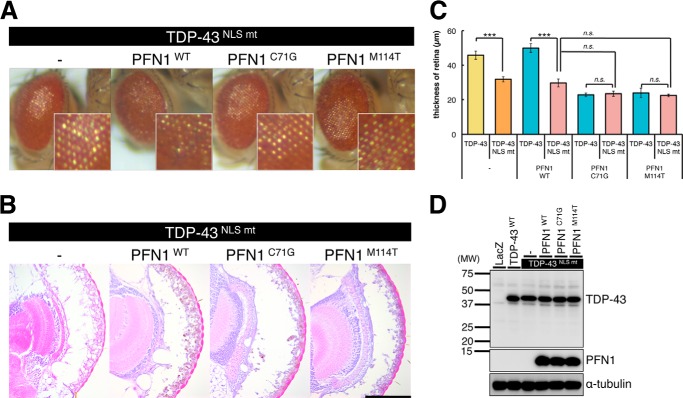
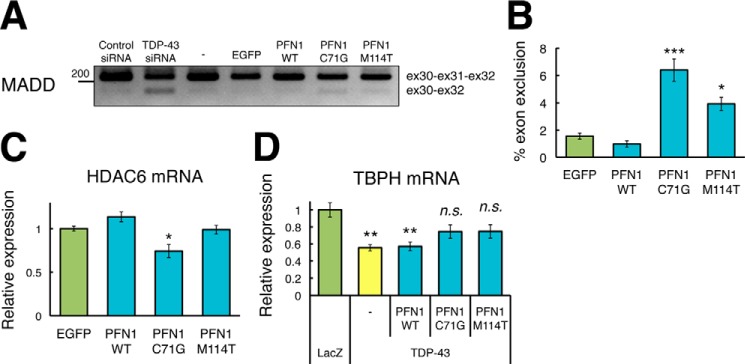
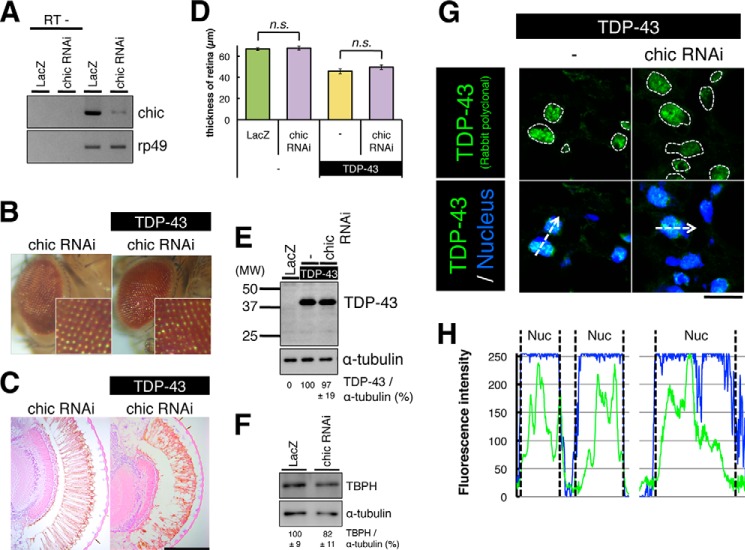
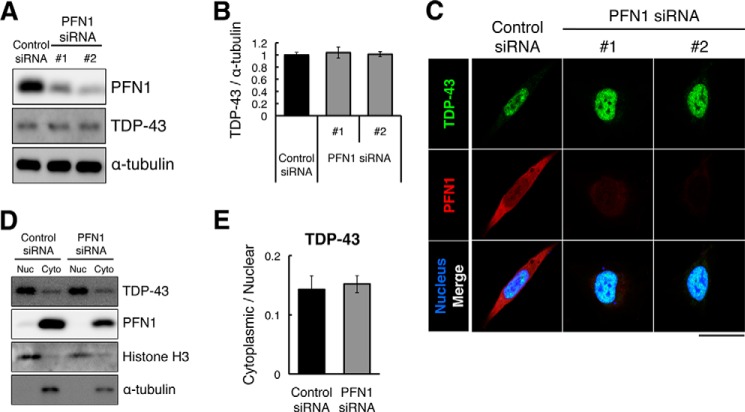
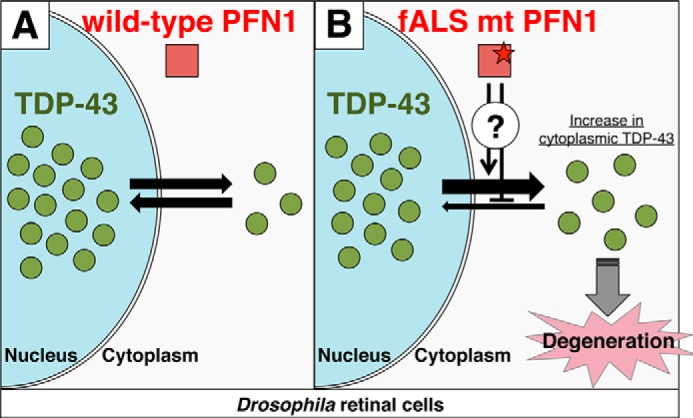
Amyotrophic lateral sclerosis (ALS) is a fatal neurodegenerative disease characterized by progressive and selective loss of motor neurons. Causative genes for familial ALS (fALS), e.g. TARDBP or FUS/TLS, have been found, among which mutations within the profilin 1 (PFN1) gene have recently been identified in ALS18. To elucidate the mechanism whereby PFN1 mutations lead to neuronal death, we generated transgenic Drosophila melanogaster overexpressing human PFN1 in the retinal photoreceptor neurons. Overexpression of wild-type or fALS mutant PFN1 caused no degenerative phenotypes in the retina. Double overexpression of fALS mutant PFN1 and human TDP-43 markedly exacerbated the TDP-43-induced retinal degeneration, i.e. vacuolation and thinning of the retina, whereas co-expression of wild-type PFN1 did not aggravate the degenerative phenotype. Notably, co-expression of TDP-43 with fALS mutant PFN1 increased the cytoplasmic localization of TDP-43, the latter remaining in nuclei upon co-expression with wild-type PFN1, whereas co-expression of TDP-43 lacking the nuclear localization signal with the fALS mutant PFN1 did not aggravate the retinal degeneration. Knockdown of endogenous Drosophila PFN1 did not alter the degenerative phenotypes of the retina in flies overexpressing wild-type TDP-43 These data suggest that ALS-linked PFN1 mutations exacerbate TDP-43-induced neurodegeneration in a gain-of-function manner, possibly by shifting the localization of TDP-43 from nuclei to cytoplasm.

Keywords: Drosophila; TAR DNA-binding protein 43 (TDP-43) (TARDBP); amyotrophic lateral sclerosis (ALS) (Lou Gehrig disease); fused in sarcoma (FUS); neurodegeneration; neurodegenerative disease; profilin.


Figures

FIGURE 1.
FIGURE 1.
Overexpression of human PFN1 in the retina of Drosophila. A, external surface pictures of eyes of 5-day-old TG flies overexpressing gmr-driven LacZ, wt, C71G or M114T mutant PFN1. The enlarged view of each eye is shown in lower right corner. B, H&E-stained sections of eyes of 5-day-old TG flies overexpressing gmr-driven LacZ, wt, C71G or M114T mutant PFN1. Scale bar, 100 μm. C, retinal thickness measured in flies expressing LacZ, wt, C71G or M114T mutant PFN1. n = 10, mean ± S.E. D, immunoblot analyses of the heads of 5-day-old gmr-driven flies expressing LacZ, wt, C71G or M114T mutant PFN1 (upper panel). α-Tubulin levels are shown as a loading control (lower panel). Relative expression levels of PFN1 are indicated under the panels. n = 3, mean ± S.E.
FIGURE 2.
FIGURE 2.
Overexpression of fALS mutant PFN1-exacerbated TDP-43-induced retinal degeneration. A, external surface pictures of eyes of 5-day-old gmr-driven TG flies overexpressing singly human TDP-43, or doubly TDP-43 and wt, C71G or M114T mutant PFN1. The enlarged view of each eye is shown in lower right corner. B, H&E-stained sections of eyes of 5-day-old gmr-driven TG flies overexpressing singly human TDP-43, or doubly TDP-43 and wt, C71G or M114T mutant PFN1. Scale bar, 100 μm. C, retinal thickness measured in TG flies overexpressing singly LacZ or TDP-43, or doubly TDP-43 and wt, C71G or M114T mutant PFN1. n = 10, mean ± S.E., ***, p < 0.001. D, comparison of the expression levels of TDP-43 (upper panel) and PFN1 (middle panel). Immunoblot analyses of the heads of 5-day-old gmr-driven TG flies expressing singly LacZ or TDP-43, or doubly TDP-43 and wt, C71G or M114T mutant PFN1. α-Tubulin levels are shown as a loading control (bottom panel). Relative expression levels of TDP-43 are indicated under the panels. n = 4, mean ± S.E.
FIGURE 3.
FIGURE 3.
Expression of fALS mutant PFN1 increased the cytoplasmic localization of endogenous TDP-43 in HEK293 cells and SK-N-SH cells. A, immunoblot analysis of Nonidet P-40 soluble (sol) and insoluble (ins) fractions of HEK293 cells transfected with EGFP or myc-tagged wt, C71G, or M114T mutant PFN1 using anti-myc antibody (upper panel) or anti-α-tubulin antibody (lower panel). B and F, immunofluorescence labeling of HEK293 cells transfected with EGFP or myc-tagged wt, C71G, or M114T mutant PFN1 using anti-TDP-43 antibody (green, upper panels), anti-myc antibody (red, middle panels), or DRAQ5 as a marker for cell nucleus (blue, surrounded by dashed lines). Scale bar, 50 μm. The enlarged view of a portion of cytoplasm surrounded by the white square is shown in the upper right corner. C, immunoblot analysis of nuclear (Nuc) and cytoplasmic (Cyto) protein fractions of HEK293 cells transfected with EGFP or myc-tagged wt, C71G, or M114T mutant PFN1 using anti-myc, anti-TDP-43, anti-FUS, and anti-histone H3 as a marker for nuclear protein, or anti-α-tubulin. D and E, quantitative cytoplasmic/nuclear ratio of endogenous TDP-43 protein (D) or endogenous FUS protein (E). n = 8 for TDP-43 (D) and n = 5 for FUS (E), mean ± S.E. *, p < 0.05. F, immunofluorescence labeling of SK-N-SH cells transfected with EGFP or myc-tagged wt, C71G, or M114T mutant PFN1 using anti-TDP-43 antibody (green, upper panels), anti-myc antibody (red, middle panels), or DRAQ5 as a marker for cell nucleus (blue, surrounded by dashed lines). Scale bar, 50 μm.
FIGURE 4.
FIGURE 4.
Overexpression of fALS mutant PFN1 increased the cytoplasmic localization of TDP-43. A and C, immunofluorescence histochemistry of the retina of 5-day-old gmr-driven TG flies overexpressing singly human TDP-43, or doubly TDP-43 and wt, C71G or M114T mutant PFN1 labeled by anti-TDP-43 (rabbit polyclonal (A) or mouse monoclonal (C)) and DRAQ-5 as a marker for nucleus (blue, surrounded by dashed lines). Note that co-expression of fALS mutant PFN1 (C71G, M114T) with TDP-43 increased cytoplasmic TDP-43 staining (white arrowheads). Scale bar, 10 μm. B and D, immunofluorescence intensity profiles of TDP-43 (green, rabbit polyclonal anti-TDP-43 antibody (B), mouse monoclonal anti-TDP-43 (D)) and nuclear (blue) measured at the dashed arrows in the bottom panels of A and C using ImageJ software. Black arrows indicate the cytoplasmic localization of TDP-43.
FIGURE 5.
FIGURE 5.
Overexpression of fALS mutant PFN1 did not alter NLS mutant TDP-43-induced retinal degeneration. A, external surface pictures of eyes of 5-day-old gmr-driven TG flies overexpressing singly human NLS mutant TDP-43, or doubly NLS mutant TDP-43 and wt, C71G or M114T mutant PFN1. The enlarged view of each eye is shown in the lower right corner. B, H&E-stained sections of eyes of 5-day-old gmr-driven TG flies overexpressing singly human NLS mutant TDP-43, or doubly NLS mutant TDP-43 and wt, C71G or M114T mutant PFN1. Scale bar, 100 μm. C, thickness of retina measured in TG flies doubly expressing NLS mutant TDP-43 and wt, C71G or M114T mutant PFN1. n = 10, mean ± S.E., *, p < 0.05; **, p < 0.01; ***, p < 0.001. D, comparison of the protein levels of TDP-43 (upper panel) and PFN1 (middle panel). Immunoblot analyses of the heads of 5-day-old gmr-driven TG flies overexpressing singly LacZ, human TDP-43, or NLS mutant TDP-43, or doubly NLS mutant TDP-43 and wt, C71G or M114T mutant PFN1. α-Tubulin levels are shown as a loading control (bottom panel).
FIGURE 6.
FIGURE 6.
Overexpression of fALS mutant PFN1, but not wt PFN1, suppressed function of TDP-43. A, semi-quantitative RT-PCR analyses of the splicing pattern of MADD gene in control siRNA-treated, TDP-43 siRNA-treated, EGFP, or myc-tagged wt, C71G, or M114T mutant PFN1 stably expressed HEK293 cells. 200-Base pair DNA size marker was indicated at the left of the panel. B, quantitative ratio of exon 31 skipping of MADD gene. n = 6, mean ± S.E., *, p < 0.05; ***, p < 0.001. C, quantitative RT-PCR analyses of expression level of HDAC6 mRNA in EGFP, or myc-tagged wt, C71G, or M114T mutant PFN1 stably expressed HEK293 cells. n = 6, mean ± S.E., *, p < 0.05. D, quantitative RT-PCR analyses of the expression level of TBPH mRNA in the compound eyes of 1–3-day-old gmr-driven TG flies expressing singly human TDP-43, or doubly TDP-43 and wt, C71G or M114T mutant PFN1. n = 4, mean ± S.E., **, p < 0.01.
FIGURE 7.
FIGURE 7.
RNAi knockdown of endogenous PFN1 did not alter TDP-43-induced retinal degeneration. A, semi-quantitative RT-PCR analyses of chic expression of the 1–3-day-old compound eyes of gmr-driven TG flies expressing LacZ or chic RNAi (upper panel). Levels of Rp49 mRNA are shown as an internal control (lower panel). B, external surface pictures of eyes of 5-day-old gmr-driven TG flies expressing chic RNAi, or doubly chic RNAi and human TDP-43. The enlarged view of each eye is shown in lower right corner. C, H&E-stained sections of eyes of 5-day-old gmr-driven TG flies expressing chic RNAi, or doubly chic RNAi and human TDP-43. Scale bar, 100 μm. D, thickness of retina measured in flies expressing chic RNAi or chic RNAi and TDP-43. Note that knockdown of chic caused neither retinal degeneration nor exacerbation of TDP-43-induced degeneration. n = 10, mean ± S.E. E, expression levels of TDP-43. Immunoblot analyses of the heads of 5-day-old gmr-driven TG flies expressing TDP-43 or chic RNAi and TDP-43 (upper panel). α-Tubulin levels are shown as a loading control (lower panel). Relative expression levels of TDP-43 are indicated under the panels. n = 3, mean ± S.E. F, expression levels of TBPH. Immunoblot analyses of the compound eyes of 5-day-old gmr-driven TG flies expressing LacZ or chic RNAi (upper panel). α-Tubulin levels are shown as a loading control (lower panel). Relative expression levels of TBPH are indicated under the panels. n = 4, mean ± S.E. G, immunofluorescence histochemistry of the retina of 5-day-old gmr-driven TG flies expressing TDP-43 or chic RNAi and TDP-43 immunolabeled by an anti-TDP-43 antibody (green) and DRAQ-5 (blue). Note that knockdown of chic did not alter the subcellular localization of TDP-43. Scale bar, 10 μm. H, immunofluorescence intensity profiles of TDP-43 (green) and nuclear (blue) measured at the dashed arrows in the bottom panels (G).
FIGURE 8.
FIGURE 8.
RNAi knockdown of endogenous PFN1 did not change the subcellular localization pattern of endogenous TDP-43 in HEK293 cells. Immunoblot analyses of the lysate of control or PFN1 siRNA (#1 or #2)-treated HEK293 cells using anti-PFN1 (upper panel), anti-TDP-43 (middle panel), or anti-α-tubulin (lower panel, loading control) antibodies. B, quantification of the relative expression level of TDP-43 in A. n = 6, mean ± S.E. C, immunofluorescence labeling of TDP-43 in control or PFN1 siRNA (#1 or #2)-treated HEK293 cells by anti-TDP-43 antibody (green, top panels), anti-PFN1 antibody (red, middle panels), or DRAQ5 (blue, bottom panels). Scale bar, 25 μm. D, immunoblot analysis of nuclear (Nuc) and cytoplasmic (Cyto) protein fractions of control or PFN1 siRNA (#2)-treated HEK293 cells using anti-TDP-43, anti-PFN1, anti-histone H3 as a marker of nuclear protein, or anti-α-tubulin. E, quantitative cytoplasmic/nuclear ratio of endogenous TDP-43 protein in D. n = 5, mean ± S.E.
FIGURE 9.
FIGURE 9.
Schematic model of the hypothetical mechanism for fALS mutation of PFN1. A, in the presence of wt PFN1, TDP-43 shuttles between the nucleus and cytoplasm and predominantly localizes at the nucleus in retinal cells. B, in the presence of fALS mutant PFN1, mutant PFN1 may impede the transport of TDP-43 from the cytoplasm to nucleus, or promote that of TDP-43 from the nucleus to cytoplasm by as yet unknown mechanism, resulting in an increase in the cytoplasmic TDP-43 and leading to degeneration.

Similar articles

Cited by

References

    1. Rosen D. R., Siddique T., Patterson D., Figlewicz D. A., Sapp P., Hentati A., Donaldson D., Goto J., O'Regan J. P., Deng H. X., Rahmani Z., Krizus A., McKenna-Yasek D., Cayabyab A., Gaston S. M., et al. (1993) Mutations in Cu/Zn superoxide dismutase gene are associated with familial amyotrophic lateral sclerosis. Nature 362, 59–62 - PubMed
    1. Sreedharan J., Blair I. P., Tripathi V. B., Hu X., Vance C., Rogelj B., Ackerley S., Durnall J. C., Williams K. L., Buratti E., Baralle F., de Belleroche J., Mitchell J. D., Leigh P. N., Al-Chalabi A., et al. (2008) TDP-43 mutations in familial and sporadic amyotrophic lateral sclerosis. Science 319, 1668–1672 - PMC - PubMed
    1. Gitcho M. A., Baloh R. H., Chakraverty S., Mayo K., Norton J. B., Levitch D., Hatanpaa K. J., White C. L. 3rd., Bigio E. H., Caselli R., Baker M., Al-Lozi M. T., Morris J. C., Pestronk A., et al. (2008) TDP-43 A315T mutation in familial motor neuron disease. Ann. Neurol. 63, 535–538 - PMC - PubMed
    1. Yokoseki A., Shiga A., Tan C. F., Tagawa A., Kaneko H., Koyama A., Eguchi H., Tsujino A., Ikeuchi T., Kakita A., Okamoto K., Nishizawa M., Takahashi H., and Onodera O. (2008) TDP-43 mutation in familial amyotrophic lateral sclerosis. Ann. Neurol. 63, 538–542 - PubMed
    1. Kabashi E., Valdmanis P. N., Dion P., Spiegelman D., McConkey B. J., Vande Velde C., Bouchard J. P., Lacomblez L., Pochigaeva K., Salachas F., Pradat P. F., Camu W., Meininger V., Dupre N., and Rouleau G. A. (2008) TARDBP mutations in individuals with sporadic and familial amyotrophic lateral sclerosis. Nat. Genet. 40, 572–574 - PubMed

MeSH terms

Supplementary concepts

LinkOut - more resources