. 2016 Oct 15;197(8):3152-3164.
doi: 10.4049/jimmunol.1600968. Epub 2016 Sep 14.

Long-Lived CD4+IFN-γ+ T Cells rather than Short-Lived CD4+IFN-γ+IL-10+ T Cells Initiate Rapid IL-10 Production To Suppress Anamnestic T Cell Responses during Secondary Malaria Infection

Affiliations

Long-Lived CD4+IFN-γ+ T Cells rather than Short-Lived CD4+IFN-γ+IL-10+ T Cells Initiate Rapid IL-10 Production To Suppress Anamnestic T Cell Responses during Secondary Malaria Infection

Ana Villegas-Mendez et al. J Immunol. .

Abstract

CD4+ T cells that produce IFN-γ are the source of host-protective IL-10 during primary infection with a number of different pathogens, including Plasmodium spp. The fate of these CD4+IFN-γ+IL-10+ T cells following clearance of primary infection and their subsequent influence on the course of repeated infections is, however, presently unknown. In this study, utilizing IFN-γ-yellow fluorescent protein (YFP) and IL-10-GFP dual reporter mice, we show that primary malaria infection-induced CD4+YFP+GFP+ T cells have limited memory potential, do not stably express IL-10, and are disproportionately lost from the Ag-experienced CD4+ T cell memory population during the maintenance phase postinfection. CD4+YFP+GFP+ T cells generally exhibited a short-lived effector rather than effector memory T cell phenotype postinfection and expressed high levels of PD-1, Lag-3, and TIGIT, indicative of cellular exhaustion. Consistently, the surviving CD4+YFP+GFP+ T cell-derived cells were unresponsive and failed to proliferate during the early phase of secondary infection. In contrast, CD4+YFP+GFP- T cell-derived cells expanded rapidly and upregulated IL-10 expression during secondary infection. Correspondingly, CD4+ T cells were the major producers within an accelerated and amplified IL-10 response during the early stage of secondary malaria infection. Notably, IL-10 exerted quantitatively stronger regulatory effects on innate and CD4+ T cell responses during primary and secondary infections, respectively. The results in this study significantly improve our understanding of the durability of IL-10-producing CD4+ T cells postinfection and provide information on how IL-10 may contribute to optimized parasite control and prevention of immune-mediated pathology during repeated malaria infections.


Figures

FIGURE 1.
FIGURE 1.
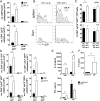
The contraction kinetics of the Ag-experienced CD4+YFP+GFP+ T cell response after primary malaria infection. IFN-γ–YFP and IL-10–GFP dual reporter mice were infected (i.v.) with 1 × 10⁴ P. yoelii NL pRBCs. Mice were treated with pyrimethamine from day 9 of infection for 10 d. (A) Peripheral parasite burdens before and after drug treatment. (B) The numbers of Ag-experienced (CD11a+CD49d+) CD4+YFP+GFP+ T cell populations in various organs before and after drug treatment. (CF) Representative histograms (spleen) and calculated relative maintenance (to day 7 postinfection levels) of (C and D) CD4+YFP+GFP+ and (E and F) CD4+YFP+ cells within the Ag-experienced CD4+ T cell population after malaria infection. (G and H) Splenic CD4+CD11a+CD49d+ cells were sort purified from mice on day 7 and day 60 postinfection and total CD4+ T cells were purified from uninfected mice (uninf). Cells were stimulated for 4 h with PMA and ionomycin and supernatant was assayed for (G) IFN-γ production and (H) IL-10 production. The results are the mean ± SEM of the group from two to three independent experiments (each experiment with three to five mice). (B) *p < 0.05 between numbers of CD4+YFP+GFP+ T cells on specified day versus numbers on day 0. (D) #p < 0.05 between all tissues except BM (day 30) versus respective day 7 level. p < 0.05 between all tissues (day 60) versus respective day 7 level. (F) ^p < 0.05 between liver (day 30) versus respective day 7 level. +p < 0.05 between spleen, liver, and BM (day 60) versus respective day 7 level. (G and H) *p < 0.05 between annotated groups. Significance tested using (B, G, and H) one-way ANOVA test with a Bonferroni post hoc analysis and (D and F) two-way ANOVA with a Bonferoni post hoc analysis.
FIGURE 2.
FIGURE 2.
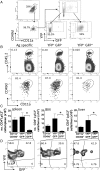
Ag-experienced CD4+YFP+GFP+ T cells are short-lived effector cells and express markers of cellular exhaustion after malaria infection. IFN-γ–YFP and IL-10–GFP dual reporter mice were infected (i.v.) with 1 × 10⁴ P. yoelii NL pRBCs. Mice were treated with pyrimethamine from day 9 of infection for 10 d. (A) Representative dot plots demonstrating the gating strategy and characterization of effector and memory CD4+ T cell subsets within the splenic parasite-specific CD4+YFP+GFP+ T cell population on day 14 postinfection. (B) Breakdown of the splenic Ag-experienced CD4+YFP+GFP+ T cell and CD4+YFP+GFP T cell populations into effector and memory subsets postinfection. (C and D) Representative histograms showing the expression of cell surface markers on splenic CD4+YFP+GFP+ and CD4+YFP+GFP T cells on day 60 postinfection. (D) Calculated mean fluorescence intensity (MFI) of expression of markers by CD4+YFP+GFP+ and CD4+YFP+GFP T cells on day 60 postinfection. The results are the mean ± SEM of the group with three to five mice per group, and are representative of three independent experiments. (B and D) *p < 0.05. Significance was tested using an unpaired two-tailed t test. el Tem, effector-like effector memory T cell; Tcm, central memory T cell; tdTe, terminally differentiated effector T cell; Te, effector T cell; Tem, effector memory T cell; Trm, resident memory T cell.
FIGURE 3.
FIGURE 3.
Ag-experienced CD4+YFP+GFP+ T cells have limited memory cell potential and are not programmed for stable IL-10 expression after malaria infection. Splenic Ag-experienced (CD11a+CD49d+) and Ag-experienced YFP+GFP+/− subsets were sort purified from P.yoelii NL–infected (day 7: 1 × 10⁴ pRBCs [i.v.]) dual reporter mice (CD45.2+) and were adoptively transferred separately into infected (day 7 postinfection) CD45.1+ mice. Recipient mice were treated with pyrimethamine from day 9 of infection for 10 d. (A) Representative dot plots showing the gating and purity of the three Ag-experienced CD4+ T cell populations. (B) Representative dot plots showing the identification of the three adoptively transferred populations and their expression levels of CD11a CD49d in spleens of recipient mice on day 60 postinfection (53 d after transfer). (C) Numbers of the three populations of transferred cells maintained in spleen, BM, and liver of recipient mice on day 60 postinfection. (D) Representative dot plots showing the expression of IFN-γ–YFP and IL-10–GFP in adoptively transferred CD4+YFP+GFP+ T cell–derived cells in the spleen, BM, and liver of recipient mice on day 60 postinfection. The results are the mean ± SEM of the group with three to five mice per group and are representative of three independent experiments. *p < 0.05. Significance was tested using a one-way ANOVA test with a Bonferroni post hoc analysis.
FIGURE 4.
FIGURE 4.
Ag-experienced CD4+YFP+YFP T cell–derived memory cells, but not CD4+YFP+GFP+ T cell–derived memory cells, respond rapidly during the early phases of challenge infection. Splenic Ag-experienced CD4+YFP+GFP+ and CD4+YFP+GFP T cell subsets were sort purified from P.yoelii NL–infected (day 7: 1 × 10⁴ pRBCs [i.v.]) dual reporter mice (CD45.2+) and were adoptively transferred, separately, into infected (day 7 postinfection) CD45.1+ mice. Recipient mice were treated with pyrimethamine from day 9 of infection for 10 d. Recipient mice were reinfected (1 × 10⁴ pRBCs [i.v.]) on day 60 postinfection with homologous P. yoelii NL parasites. (A) Total numbers of Ag-experienced CD4+YFP+GFP+ and CD4+YFP+GFP T cell–derived memory cells in the spleen and liver of recipient mice on day 60 after primary infection and day 4 of secondary infection. (B) Representative histograms and (C) frequencies of Ag-experienced CD4+YFP+GFP+ and CD4+YFP+GFP T cell–derived memory cells expressing GFP in the spleen and liver of recipient mice on day 60 after primary infection and day 4 of secondary infection. (D) Numbers of CD4+YFP+GFP+ and CD4+YFP+GFP T cell–derived memory cells expressing YFP (left column) and/or GFP (right column) in the (top row) spleen and (bottom row) liver of recipient mice on day 60 after primary infection and day 4 of secondary infection. (E and F) Splenic CD4+CD11a+CD49d+ cells were sort purified from mice on day 60 postinfection and total CD4+ T cells were purified from uninfected mice (uninf). Cells were stimulated for (E) 24 or 72 h with anti-CD3 and anti-CD28 or (F) 4 h with PMA and ionomycin and supernatant was assayed for (E) IFN-γ production and IL-10 production or (F) IL-2 production. The results are the mean ± SEM of the group with three to five mice per group and are representative of three independent experiments. *p < 0.05. Significance was tested using an unpaired t test.
FIGURE 5.
FIGURE 5.
Primary malaria infection leads to reprogramming of the IL-10 response during secondary infection. IFN-γ–YFP and IL-10–GFP dual reporter mice were infected (i.v.) with 1 × 10⁴ P. yoelii NL pRBCs or PBS. Mice were treated with pyrimethamine from day 9 postinjection for 10 d before being (re)infected (1 × 10⁴ pRBCs [i.v.]) on day 60 postinfection with homologous P. yoelii NL parasites. (A) The levels of IL-10 in the plasma of primary- and secondary-infected mice. (B) Peripheral parasite levels in primary- and secondary-infected mice. (C and D) The (C) frequencies and (D) numbers of leukocytes expressing IL-10–GFP in the spleen and liver of primary- and secondary-infected mice. (E) The cellular composition of the splenic and hepatic leukocyte IL-10 response in primary- and secondary-infected mice. (F) The numbers of Ag-experienced CD4+YFP+GFP+ T cells in the spleen and livers of primary- and secondary-infected mice. The results are the mean ± SEM of the group with three to five mice per group. The results are representative of four independent experiments. *p < 0.05 between day 0 secondary infection versus day 2 or day 4 secondary infection, p < 0.05 between primary infection versus secondary infection on each given day. Significance was tested using a two-way ANOVA test with a Bonferroni post hoc analysis.
FIGURE 6.
FIGURE 6.
IL-10 exerts strong regulatory effects on the innate compartment during the early phases of primary infection. B6 mice were infected (i.v.) with 1 × 10⁴ P. yoelii NL pRBCs or PBS. Mice were treated with pyrimethamine from day 9 postinfection for 10 d before being (re)infected (1 × 10⁴ pRBCs [i.v.]) on day 60 postinfection with homologous P. yoelii NL parasites. Mice were injected with 250 μg of anti–IL-10R or PBS 1 d prior to (re)infection and on days 1, 3, and 5 after (re)infection. (A and B) The course of infection in anti–IL-10R-treated and control primary- and secondary-infected mice was monitored by assessing (A) peripheral parasite levels and (B) weight loss. (C) The effect of anti–IL-10R treatment on the numbers of splenic immune cell populations on day 4 during primary and secondary infections. (D) Representative histograms showing the effect of anti–IL-10R treatment on MHC II expression (mean fluorescence intensity [MFI]) by splenic innate cells on day 4 during primary and secondary infections. (E) Calculated relative effect of anti–IL-10R treatment on MHC II expression by splenic innate cells during primary and secondary infection (presented as fold change in MFI expression compared with expression in respective control-treated primary or secondary-infected mice). Level of no effect is reflected by solid line. (A, C, and E) The results are the mean ± SEM of the group with three to five mice per group and are representative of three independent experiments. (A) *p < 0.05 between primary infection versus anti– IL-10R-treated primary infection on annotated day. (B) *p < 0.05 between day 0 anti– IL-10R-treated primary infection versus anti–IL-10R-treated primary infection on indicated day, p < 0.05 between day 0 anti–IL-10R-treated secondary infection versus anti–IL-10R-treated secondary infection on indicated day, p < 0.05 between secondary infection versus anti–IL-10R-treated secondary infection on specified day. (A and B) Using two-way ANOVA test with a Bonferroni post hoc analysis. (C) *p < 0.05 between primary infected versus secondary infected, using one-way ANOVA test with a Bonferroni post hoc analysis. (E) *p < 0.05 between fold change in effect during primary versus during secondary infection. (D and E) Using a two-tailed unpaired t test.
FIGURE 7.
FIGURE 7.
IL-10 exerts strong effects on the adaptive CD4+ T cell response during the early phases of secondary malaria infection. B6 mice were injected (i.v.) with 1 × 10⁴ P. yoelii NL pRBCs or PBS. Mice were treated with pyrimethamine from day 9 postinjection for 10 d before being (re)infected (1 × 10⁴ pRBCs [i.v.]) on day 60 postinfection with homologous P. yoelii NL parasites. Mice were injected with 250 μg of anti–IL-10R or PBS 1 d prior to (re)infection and on days 1, 3, and 5 after (re)infection. (A) The effect of anti–IL-10R treatment on Ag-experienced CD4+ T cell numbers on day 4 during primary and secondary infections. (B) Calculated relative effect of anti–IL-10R treatment on Ag-experienced CD4+ T cell numbers during primary and secondary infections (C) The effect of anti–IL-10R treatment on the concentration of IFN-γ in the plasma of primary- and secondary-infected mice on day 4 of infection. (D) Calculated relative effect of anti–IL-10R treatment on plasma IFN-γ levels on day 4 during primary and secondary infections. (B and D) Presented as fold change in levels in anti–IL-10R Ab-treated mice compared with results in respective control-treated primary- or secondary-infected mice). Level of no effect is reflected by solid line. The results are the mean ± SEM of the group with three to five mice per group and are representative of three independent experiments. (A and C) *p < 0.05 between primary-infected versus secondary-infected mice, #p < 0.05 between primary-infected versus anti–IL-10R-treated primary-infected mice, p < 0.05 between secondary-infected versus anti–IL-10R-treated secondary-infected mice, using one-way ANOVA with a Bonferroni post hoc analysis. (B and D) *p < 0.05 between fold change in effect during primary infection versus during secondary infections, using unpaired t test.

Similar articles

Cited by

References

    1. Engwerda C. R., Ng S. S., Bunn P. T. 2014. The regulation of CD4+ T cell responses during protozoan infections. Front. Immunol. 5: 498. - PMC - PubMed
    1. Freitas do Rosario A. P., Langhorne J. 2012. T cell-derived IL-10 and its impact on the regulation of host responses during malaria. Int. J. Parasitol. 42: 549–555. - PubMed
    1. Freitas do Rosário A. P., Lamb T., Spence P., Stephens R., Lang A., Roers A., Muller W., O’Garra A., Langhorne J. 2012. IL-27 promotes IL-10 production by effector Th1 CD4+ T cells: a critical mechanism for protection from severe immunopathology during malaria infection. J. Immunol. 188: 1178–1190. - PMC - PubMed
    1. Linke A., Kühn R., Müller W., Honarvar N., Li C., Langhorne J. 1996. Plasmodium chabaudi chabaudi: differential susceptibility of gene-targeted mice deficient in IL-10 to an erythrocytic-stage infection. Exp. Parasitol. 84: 253–263. - PubMed
    1. Couper K. N., Blount D. G., Wilson M. S., Hafalla J. C., Belkaid Y., Kamanaka M., Flavell R. A., de Souza J. B., Riley E. M. 2008. IL-10 from CD4+CD25−Foxp3−CD127− adaptive regulatory T cells modulates parasite clearance and pathology during malaria infection. PLoS Pathog. 4: e1000004. - PMC - PubMed

Publication types