FOXO/DAF-16 Activation Slows Down Turnover of the Majority of Proteins in C. elegans
- PMID: 27626670
- PMCID: PMC5434875
- DOI: 10.1016/j.celrep.2016.07.088
FOXO/DAF-16 Activation Slows Down Turnover of the Majority of Proteins in C. elegans
Abstract
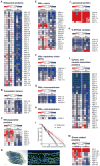
Most aging hypotheses assume the accumulation of damage, resulting in gradual physiological decline and, ultimately, death. Avoiding protein damage accumulation by enhanced turnover should slow down the aging process and extend the lifespan. However, lowering translational efficiency extends rather than shortens the lifespan in C. elegans. We studied turnover of individual proteins in the long-lived daf-2 mutant by combining SILeNCe (stable isotope labeling by nitrogen in Caenorhabditiselegans) and mass spectrometry. Intriguingly, the majority of proteins displayed prolonged half-lives in daf-2, whereas others remained unchanged, signifying that longevity is not supported by high protein turnover. This slowdown was most prominent for translation-related and mitochondrial proteins. In contrast, the high turnover of lysosomal hydrolases and very low turnover of cytoskeletal proteins remained largely unchanged. The slowdown of protein dynamics and decreased abundance of the translational machinery may point to the importance of anabolic attenuation in lifespan extension, as suggested by the hyperfunction theory.
Keywords: (15)N-metabolic labeling; Caenorhabditis elegans; FOXO/DAF-16; aging; daf-2 mutant; protein turnover.
Copyright © 2016 The Author(s). Published by Elsevier Inc. All rights reserved.
Figures


Similar articles
-
Tectochrysin increases stress resistance and extends the lifespan of Caenorhabditis elegans via FOXO/DAF-16.Biogerontology. 2020 Oct;21(5):669-682. doi: 10.1007/s10522-020-09884-w. Epub 2020 Jun 6. Biogerontology. 2020. PMID: 32506187
-
Benzimidazole derivative M084 extends the lifespan of Caenorhabditis elegans in a DAF-16/FOXO-dependent way.Mol Cell Biochem. 2017 Feb;426(1-2):101-109. doi: 10.1007/s11010-016-2884-x. Epub 2016 Nov 16. Mol Cell Biochem. 2017. PMID: 27854075
-
DAF-16/FoxO in Caenorhabditis elegans and Its Role in Metabolic Remodeling.Cells. 2020 Jan 2;9(1):109. doi: 10.3390/cells9010109. Cells. 2020. PMID: 31906434 Free PMC article. Review.
-
Effects of Caenorhabditis elegans sgk-1 mutations on lifespan, stress resistance, and DAF-16/FoxO regulation.Aging Cell. 2013 Oct;12(5):932-40. doi: 10.1111/acel.12120. Epub 2013 Jul 19. Aging Cell. 2013. PMID: 23786484 Free PMC article.
-
The purpose and ubiquity of turnover.Cell. 2024 May 23;187(11):2657-2681. doi: 10.1016/j.cell.2024.04.034. Cell. 2024. PMID: 38788689 Review.
Cited by
-
Nucleolar expansion and elevated protein translation in premature aging.Nat Commun. 2017 Aug 30;8(1):328. doi: 10.1038/s41467-017-00322-z. Nat Commun. 2017. PMID: 28855503 Free PMC article.
-
Accumulation of "Old Proteins" and the Critical Need for MS-based Protein Turnover Measurements in Aging and Longevity.Proteomics. 2020 Mar;20(5-6):e1800403. doi: 10.1002/pmic.201800403. Epub 2019 Sep 10. Proteomics. 2020. PMID: 31408259 Free PMC article. Review.
-
Longevity interventions modulate mechanotransduction and extracellular matrix homeostasis in C. elegans.Nat Commun. 2024 Jan 4;15(1):276. doi: 10.1038/s41467-023-44409-2. Nat Commun. 2024. PMID: 38177158 Free PMC article.
-
Mitochondrial and metabolic dysfunction in ageing and age-related diseases.Nat Rev Endocrinol. 2022 Apr;18(4):243-258. doi: 10.1038/s41574-021-00626-7. Epub 2022 Feb 10. Nat Rev Endocrinol. 2022. PMID: 35145250 Free PMC article. Review.
-
Sonneradon A Extends Lifespan of Caenorhabditis elegans by Modulating Mitochondrial and IIS Signaling Pathways.Mar Drugs. 2022 Jan 8;20(1):59. doi: 10.3390/md20010059. Mar Drugs. 2022. PMID: 35049915 Free PMC article.
References
-
- Arantes-Oliveira N, Apfeld J, Dillin A, Kenyon C. Regulation of life-span by germ-line stem cells in Caenorhabditis elegans. Science. 2002;295:502–505. - PubMed
-
- Braeckman BP, Houthoofd K, Vanfleteren JR. Assessing metabolic activity in aging Caenorhabditis elegans: concepts and controversies. Aging Cell. 2002;1:82–88. discussion 102-103. - PubMed
Publication types
MeSH terms
Substances
Grants and funding
LinkOut - more resources
Full Text Sources
Other Literature Sources
Miscellaneous

