In vivo single-RNA tracking shows that most tRNA diffuses freely in live bacteria
- PMID: 27625389
- PMCID: PMC5314786
- DOI: 10.1093/nar/gkw787
In vivo single-RNA tracking shows that most tRNA diffuses freely in live bacteria
Abstract
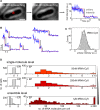
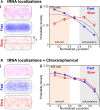
Transfer RNA (tRNA) links messenger RNA nucleotide sequence with amino acid sequence during protein synthesis. Despite the importance of tRNA for translation, its subcellular distribution and diffusion properties in live cells are poorly understood. Here, we provide the first direct report on tRNA diffusion localization in live bacteria. We internalized tRNA labeled with organic fluorophores into live bacteria, applied single-molecule fluorescence imaging with single-particle tracking and localized and tracked single tRNA molecules over seconds. We observed two diffusive species: fast (with a diffusion coefficient of ∼8 μm2/s, consistent with free tRNA) and slow (consistent with tRNA bound to larger complexes). Our data indicate that a large fraction of internalized fluorescent tRNA (>70%) appears to diffuse freely in the bacterial cell. We also obtained the subcellular distribution of fast and slow diffusing tRNA molecules in multiple cells by normalizing for cell morphology. While fast diffusing tRNA is not excluded from the bacterial nucleoid, slow diffusing tRNA is localized to the cell periphery (showing a 30% enrichment versus a uniform distribution), similar to non-uniform localizations previously observed for mRNA and ribosomes.
© The Author(s) 2016. Published by Oxford University Press on behalf of Nucleic Acids Research.
Figures


Similar articles
-
tRNA tracking for direct measurements of protein synthesis kinetics in live cells.Nat Chem Biol. 2018 Jun;14(6):618-626. doi: 10.1038/s41589-018-0063-y. Epub 2018 May 16. Nat Chem Biol. 2018. PMID: 29769736 Free PMC article.
-
Spatial Distribution and Ribosome-Binding Dynamics of EF-P in Live Escherichia coli.mBio. 2017 Jun 6;8(3):e00300-17. doi: 10.1128/mBio.00300-17. mBio. 2017. PMID: 28588135 Free PMC article.
-
Spontaneous reverse movement of mRNA-bound tRNA through the ribosome.Nat Struct Mol Biol. 2007 Apr;14(4):318-24. doi: 10.1038/nsmb1221. Epub 2007 Mar 18. Nat Struct Mol Biol. 2007. PMID: 17369838
-
RNA versatility governs tRNA function: Why tRNA flexibility is essential beyond the translation cycle.Bioessays. 2016 May;38(5):465-73. doi: 10.1002/bies.201500190. Epub 2016 Mar 18. Bioessays. 2016. PMID: 26990636 Review.
-
Structure and function of 10Sa RNA: trans-translation system.Biochimie. 1996;78(11-12):985-91. doi: 10.1016/s0300-9084(97)86721-1. Biochimie. 1996. PMID: 9150876 Review.
Cited by
-
Two Old Dogs, One New Trick: A Review of RNA Polymerase and Ribosome Interactions during Transcription-Translation Coupling.Int J Mol Sci. 2019 May 27;20(10):2595. doi: 10.3390/ijms20102595. Int J Mol Sci. 2019. PMID: 31137816 Free PMC article. Review.
-
Rediscovering Bacteria through Single-Molecule Imaging in Living Cells.Biophys J. 2018 Jul 17;115(2):190-202. doi: 10.1016/j.bpj.2018.03.028. Epub 2018 Apr 18. Biophys J. 2018. PMID: 29680157 Free PMC article. Review.
-
Comprehensive identification of RNA-protein interactions in any organism using orthogonal organic phase separation (OOPS).Nat Biotechnol. 2019 Feb;37(2):169-178. doi: 10.1038/s41587-018-0001-2. Epub 2019 Jan 3. Nat Biotechnol. 2019. PMID: 30607034 Free PMC article.
-
Trade-Offs between Speed, Accuracy, and Dissipation in tRNAIle Aminoacylation.J Phys Chem Lett. 2020 May 21;11(10):4001-4007. doi: 10.1021/acs.jpclett.0c01073. Epub 2020 May 6. J Phys Chem Lett. 2020. PMID: 32354218 Free PMC article.
-
Spatiotemporal kinetics of the SRP pathway in live E. coli cells.Proc Natl Acad Sci U S A. 2022 Sep 20;119(38):e2204038119. doi: 10.1073/pnas.2204038119. Epub 2022 Sep 12. Proc Natl Acad Sci U S A. 2022. PMID: 36095178 Free PMC article.
References
-
- Long R.M., Singer R.H., Meng X., Gonzalez I., Nasmyth K., Jansen R.P. Mating type switching in yeast controlled by asymmetric localization of ASH1 mRNA. Science. 1997;277:383–387. - PubMed
-
- Nevo-Dinur K., Nussbaum-Shochat A., Ben-Yehuda S., Amster-Choder O. Translation-independent localization of mRNA in E. coli. Science. 2011;331:1081–1084. - PubMed
-
- Femino A.M., Fay F.S., Fogarty K., Singer R.H. Visualization of single RNA transcripts in situ. Science. 1998;280:585–590. - PubMed
MeSH terms
Substances
Grants and funding
LinkOut - more resources
Full Text Sources
Other Literature Sources

