. 2016 Nov;46(11):2574-2586.
doi: 10.1002/eji.201546259. Epub 2016 Sep 27.

Rewiring cellular metabolism via the AKT/mTOR pathway contributes to host defence against Mycobacterium tuberculosis in human and murine cells

Affiliations

Rewiring cellular metabolism via the AKT/mTOR pathway contributes to host defence against Mycobacterium tuberculosis in human and murine cells

Ekta Lachmandas et al. Eur J Immunol. 2016 Nov.

Abstract

Cells in homeostasis metabolize glucose mainly through the tricarboxylic acid cycle and oxidative phosphorylation, while activated cells switch their basal metabolism to aerobic glycolysis. In this study, we examined whether metabolic reprogramming toward aerobic glycolysis is important for the host response to Mycobacterium tuberculosis (Mtb). Through transcriptional and metabolite analysis we show that Mtb induces a switch in host cellular metabolism toward aerobic glycolysis in human peripheral blood mononuclear cells (PBMCs). The metabolic switch is TLR2 dependent but NOD2 independent, and is mediated in part through activation of the AKT-mTOR (mammalian target of rapamycin) pathway. We show that pharmacological inhibition of the AKT/mTOR pathway inhibits cellular responses to Mtb both in vitro in human PBMCs, and in vivo in a model of murine tuberculosis. Our findings reveal a novel regulatory layer of host responses to Mtb that will aid understanding of host susceptibility to Mtb, and which may be exploited for host-directed therapy.

Keywords: Glycolysis; Immunometabolism; Mycobacterium tuberculosis; TLR2; mTOR.


Figures

Figure 1
Figure 1
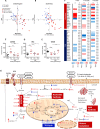
Transcriptional regulation of glucose metabolism during active TB disease and in PBMCs stimulated with Mtb. (A, B) Principal component analysis of the glycolysis and TCA cycle whole blood gene signatures of microarray data from publically available cohorts from (A) the United Kingdom (UK) and (B) South Africa (SA), previously published by Berry et al. (Series GSE19444) 9. Data for each sample, including active pulmonary TB (PTB), LTBI (TST positive), and CON (TST negative) individuals were plotted along PC1 for glycolysis versus PC1 for the TCA cycle. For the UK cohort, PC1 accounted for 37% of the total variation for both glycolysis and the TCA cycle. For the SA cohort PC1 accounted for 44 and 34% of the variance for glycolysis and the TCA cycle respectively. (C–E) Individual and mean whole blood gene expression for (C) GAPDH, (D) hexokinase‐3, and (E) IDH3B in controls and PTB patients on 0, 2, or 12 months of TB treatment (Series GSE19435). Microarray data derived from Berry et al 9. Symbols represent individual samples and data are shown as means ± SEM; means were compared using the Mann–Whitney U test. *p < 0.05, **p < 0.01, ***p < 0.001. (F) Heatmap of gene expression pattern of glycolysis or TCA cycle genes in in vitro‐stimulated PBMCs and in vivo whole blood (UK and SA publically available cohorts). All data was log‐2 transformed. The in vitro Mtb stimulations were normalized to RPMI by subtracting means whereas the in vivo PTB cohort was normalized to the corresponding LTBI cohort. p‐values were considered significant when less than 0.05 as determined by the Wilcoxon signed‐rank test for the in vitro data set and by the Mann–Whitney U test for the in vivo data sets. Red represents a significant up regulation, blue a significant down regulation and grey no difference. (G) Schematic representation of upregulated (in red) and downregulated (blue) genes in the glycolysis and TCA cycle pathways as determined by microarray analysis of Mtb‐stimulated PBMCs.
Figure 2
Figure 2
Physiology of the PBMC metabolic response to Mtb stimulation. (A, B) CD14+ monocytes were stimulated for 24 h with Mtb and (A) ECAR and (B) OCR rates were determined using the Seahorse metabolic analyzer. Three baseline measurements were determined. Data are shown as means ± SEM (n = 7). (C) Lactate production from macrophages stimulated with live H37Rv (10:1 MOI) was measured by a fluorescent coupled enzymatic assay. Data are shown as means ± SEM of n = 4, pooled from two independent experiments. (D‐F) PBMCs were stimulated with Mtb lysate and the kinetics of (D) glucose consumption, (E) lactate production and (F) the intracellular NAD+/NADH ratios from days 1, 3 and 7 was measured by metabolite specific coupled enzymatic assays. Data are shown as means ± SEM of n = 6 to 8, pooled from three independent experiments. Means were compared using the Wilcoxon signed‐rank test, *p < 0.05).
Figure 3
Figure 3
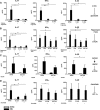
Induction of glycolysis in human PBMCs is mediated by the AKT‐mTOR pathway. (A–D) PBMCs were stimulated with RPMI or Mtb in a time‐dependent manner in the presence or absence of DMSO (vehicle control), wortmannin (PI3K/AKT inhibitor), or rapamycin (mTOR inhibitor). (C) CD14+ and CD3+ T cells were separated from PBMCs stimulated for 2 h with Mtb. Where indicated, GM‐CSF stimulation was included as a positive control. (A, B) AKT, (C, D) p70‐S6K and 4E‐BP1 phosphorylation and actin levels were determined by Western blot using specific antibodies. (A, B) Cell lysates were harvested at 15, 30, 60, and 120 min poststimulation. (C, D) Cell lysates were harvested at 30, 60, 120, and 240 min poststimulation. Representative blots from two of four donors are shown. (E–G) PBMCs were preincubated with 10 nM rapamycin, 100 nM torin, or 100 nM wortmannin for 1 h prior to stimulation with Mtb lysate. Data are shown as means ± SEM of n = 9, pooled from three independent experiments. Means were compared using the Wilcoxon signed‐rank test (*p < 0.05, **p < 0.01).
Figure 4
Figure 4
mTOR regulation of Mtb‐induced T‐cell cytokine responses. (A–D) PBMCs were preincubated with DMSO (vehicle control) or (A) 1 mM or 5 mM 2‐deoxy‐glucose, (B) 1 nM or 10 nM rapamycin, 100 nM torin, (C) 500 μM AICAR, or (D) 50 μM or 500 μM ascorbate or for 1 h prior to stimulation with Mtb lysate. IL‐17, IFN‐γ, and IL‐22 levels were measured from culture supernatants by ELISA. Data are shown as means ± SEM of n = 6–9 pooled from three independent experiments. Means were compared using the Wilcoxon signed‐rank test (*p < 0.05, **p < 0.01).
Figure 5
Figure 5
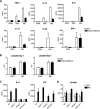
Role of NOD2 in the induction of glycolysis. (A, B) PBMCs from NOD2‐deficient patients (n = 2) and healthy volunteers (n = 4) were stimulated with RPMI, MDP, and Mtb for 24 h and 7 days. The levels of (A) indicated cytokines or (B) lactate production were measured from culture supernatants by ELISA and an enzymatic couple assay, respectively. Data are shown as means ± SEM of the indicated number of donor samples and are from a single experiment. (C, D) BMDMs from WT, NOD1 knockout (−/−), NOD2 knockout (−/−), and NOD 1/2 double knockout (−/−) mice were stimulated with RPMI or 1 μg/mL Mtb lysate for 24 h (n = 2). The levels of (C) IL‐6 and KC and (D) lactate production were measured as described above. Data are shown as means ± SEM of n = 2 from a single experiment.
Figure 6
Figure 6
Stimulation via TLR2 initiates rewiring of cellular metabolism in mouse macrophages. (A–C) PBMCs from healthy volunteers (n = 6) were stimulated with RPMI, MDP ± LPS, Pam3Cys (P3C) or Mtb lysate for 24 h. The levels of (A) IL‐1β, (B) IL‐6, and (C) lactate in cell culture supernatants were measured as described above. Data are shown as means ± SEM of n = 6 pooled from two experiments. Means were compared using the Wilcoxon signed‐rank test (*p < 0.05). (D, E) PBMCs were preincubated with TLR4 antagonist B. quintana LPS (20 and 100 ng/mL) prior to stimulation with RPMI, Mtb lysate, or LPS. The levels of (D) IL‐6 production and (E) lactate in culture supernatants were determined by ELISA and a coupled enzymatic assay, respectively. Data are shown as means ± SEM of n = 6–8 pooled from three experiments. Means were compared using the Wilcoxon signed‐rank test (*p < 0.05). (F–H) BMDMs and peritoneal macrophages (Mfs) from TLR2 knockout (TLR2−/−) mice were stimulated with RPMI, P3C (positive control) and Mtb lysate. The levels of (F) KC (IL‐8) and (G, H) lactate in culture supernatants were measured by ELISA and a coupled enzymatic assay. Data are shown as means ± SEM of n = 3–6 pooled from two experiments. Means were compared using the Wilcoxon signed‐rank test. (I) Levels of AKT activation from TLR2−/− BMDMs stimulated with RPMI, insulin (control; INS) and Mtb lysate (Mtb) was determined by western blot. Actin was used as loading control. One of two representative blots is shown.
Figure 7
Figure 7
In vivo effects of mTOR inhibition. (A, B) C57/BL6 mice were treated with rapamycin or vehicle (mixed PBS/100% EtOH) from 1 day prior to aerosol infection with Mtb until 28 days postinfection. Mice were euthanized and splenocytes were harvested and restimulated with Mtb lysate (1 μg/mL) for 6 days, after which (B) a bead‐based immunoassay for mTNF‐α, mIL‐12p70, mIIL‐17, and mIFN‐γ was performed. Data are shown as means ± SEM of n = 6 samples from a single experiment. Means were compared using the Mann–Whitney U test (*p < 0.05).

Similar articles

Cited by

References

    1. Michalek, R. D. , Gerriets, V. A. , Jacobs, S. R. , Macintyre, A. N. , MacIver, N. J. , Mason, E. F. , Sullivan, S. A. et al., Cutting edge: distinct glycolytic and lipid oxidative metabolic programs are essential for effector and regulatory CD4(+) T‐cell subsets. J. Immunol. 2011. 186: 3299–3303. - PMC - PubMed
    1. Cheng, S. C. , mTOR‐ and HIF‐1 alpha‐mediated aerobic glycolysis as metabolic basis for trained immunity. Science 2014. 346: 1579–1589. - PMC - PubMed
    1. Pearce, E. L. , Walsh, M. C. , Cejas, P. J. , Harms, G. M. , Shen, H. , Wang, L. S. , Jones, R. G. et al., Enhancing CD8 T‐cell memory by modulating fatty acid metabolism. Nature 2009. 460: U103–U118. - PMC - PubMed
    1. Everts, B. , Amiel, E. , Huang, S. C. C. , Smith, A. M. , Chang, C. H. , Lam, W. Y. , Redmann, V. et al., TLR‐driven early glycolytic reprogramming via the kinases TBK1‐IKK epsilon supports the anabolic demands of dendritic cell activation. Nat. Immunol. 2014. 15: 323–332. - PMC - PubMed
    1. Krawczyk, C. M. , Holowka, T. , Sun, J. , Blagih, J. , Amiel, E. , DeBerardinis, R. J. , Cross, J. R. et al., Toll‐like receptor‐induced changes in glycolytic metabolism regulate dendritic cell activation. Blood 2010. 115: 4742–4749. - PMC - PubMed

MeSH terms

LinkOut - more resources