

Investigation of endosome and lysosome biology by ultra pH-sensitive nanoprobes
- PMID: 27612550
- PMCID: PMC5339051
- DOI: 10.1016/j.addr.2016.08.014
Investigation of endosome and lysosome biology by ultra pH-sensitive nanoprobes
Abstract
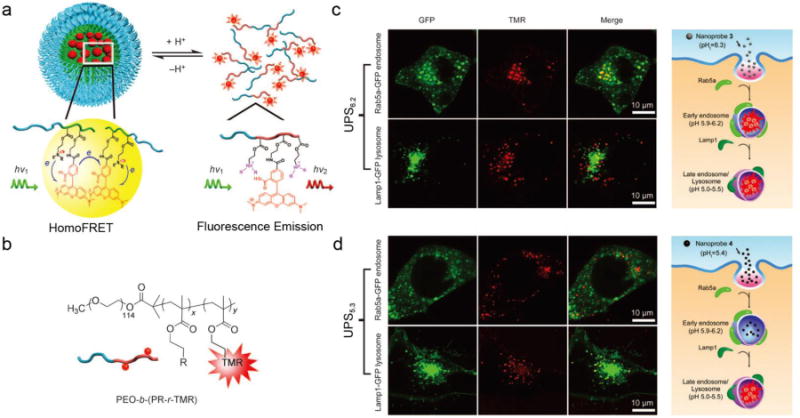
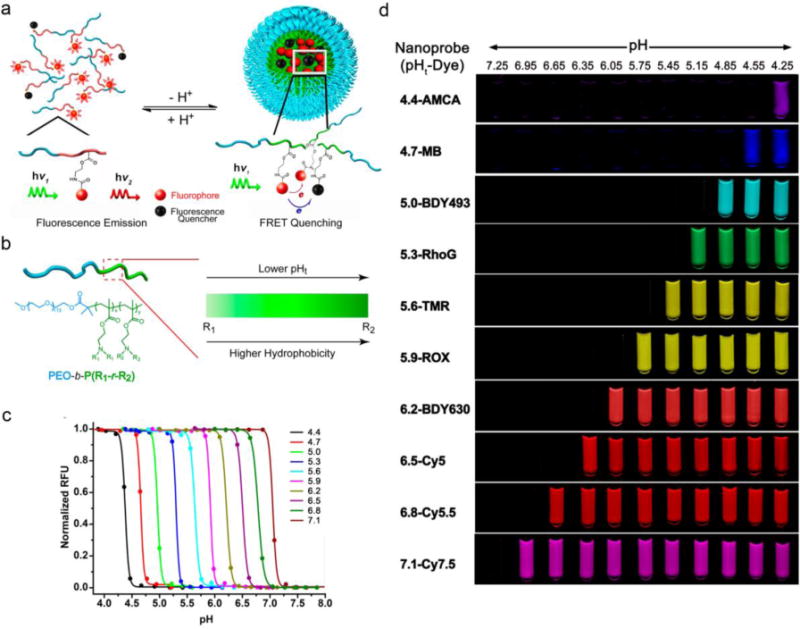
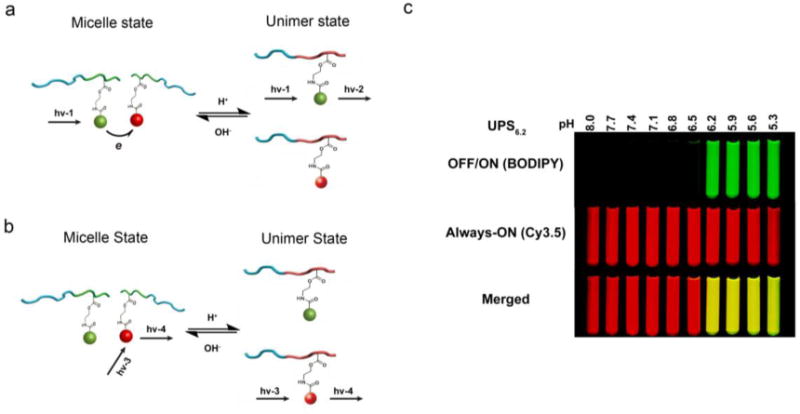
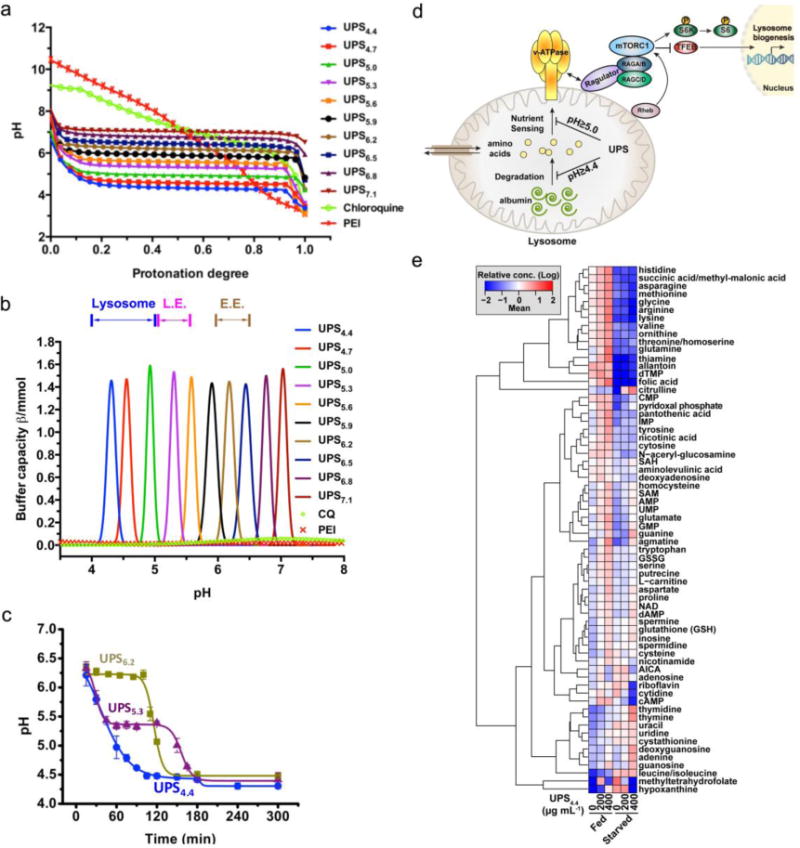
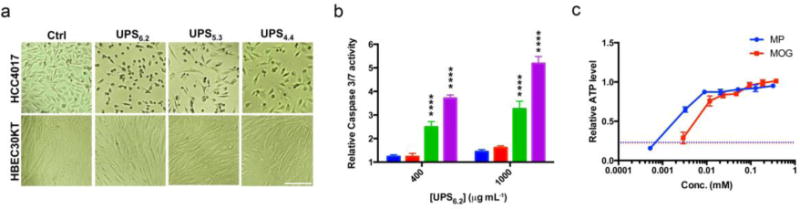
Endosomes and lysosomes play a critical role in various aspects of cell physiology such as nutrient sensing, receptor recycling, protein/lipid catabolism, and cell death. In drug delivery, endosomal release of therapeutic payloads from nanocarriers is also important in achieving efficient delivery of drugs to reach their intracellular targets. Recently, we invented a library of ultra pH-sensitive (UPS) nanoprobes with exquisite fluorescence response to subtle pH changes. The UPS nanoprobes also displayed strong pH-specific buffer effect over small molecular bases with broad pH responses (e.g., chloroquine and NH4Cl). Tunable pH transitions from 7.4 to 4.0 of UPS nanoprobes cover the entire physiological pH of endocytic organelles (e.g., early and late endosomes) and lysosomes. These unique physico-chemical properties of UPS nanoprobes allowed a 'detection and perturbation' strategy for the investigation of luminal pH in cell signaling and metabolism, which introduces a nanotechnology-enabled paradigm for the biological studies of endosomes and lysosomes.
Keywords: Cell signaling; Endocytic organelles; Metabolomics; Organelle imaging; pH buffering; pH sensitive nanoprobes.
Published by Elsevier B.V.
Figures
Similar articles
-
A nanobuffer reporter library for fine-scale imaging and perturbation of endocytic organelles.Nat Commun. 2015 Oct 5;6:8524. doi: 10.1038/ncomms9524. Nat Commun. 2015. PMID: 26437053 Free PMC article.
-
Selective perturbation of early endosome and/or trans-Golgi network pH but not lysosome pH by dose-dependent expression of influenza M2 protein.J Biol Chem. 1999 Apr 2;274(14):9854-60. doi: 10.1074/jbc.274.14.9854. J Biol Chem. 1999. PMID: 10092677
-
A novel live-cell imaging assay reveals regulation of endosome maturation.Elife. 2021 Nov 30;10:e70982. doi: 10.7554/eLife.70982. Elife. 2021. PMID: 34846303 Free PMC article.
-
How do cells optimize luminal environments of endosomes/lysosomes for efficient inflammatory responses?J Biochem. 2013 Dec;154(6):491-9. doi: 10.1093/jb/mvt099. Epub 2013 Oct 31. J Biochem. 2013. PMID: 24178399 Review.
-
Rab GTPase Function in Endosome and Lysosome Biogenesis.Trends Cell Biol. 2018 Nov;28(11):957-970. doi: 10.1016/j.tcb.2018.06.007. Epub 2018 Jul 17. Trends Cell Biol. 2018. PMID: 30025982 Review.
Cited by
-
Fully Automated Computational Approach for Precisely Measuring Organelle Acidification with Optical pH Sensors.ACS Appl Mater Interfaces. 2022 Apr 27;14(16):18133-18149. doi: 10.1021/acsami.2c00389. Epub 2022 Apr 11. ACS Appl Mater Interfaces. 2022. PMID: 35404562 Free PMC article.
-
Intracellular Trafficking of Size-Tuned Nanoparticles for Drug Delivery.Int J Mol Sci. 2023 Dec 25;25(1):312. doi: 10.3390/ijms25010312. Int J Mol Sci. 2023. PMID: 38203483 Free PMC article.
-
Intelligent Nanoparticle-Based Dressings for Bacterial Wound Infections.ACS Appl Bio Mater. 2021 May 17;4(5):3849-3862. doi: 10.1021/acsabm.0c01168. Epub 2020 Dec 9. ACS Appl Bio Mater. 2021. PMID: 34056562 Free PMC article. Review.
-
Therapeutic Nanoparticles and Their Targeted Delivery Applications.Molecules. 2020 May 8;25(9):2193. doi: 10.3390/molecules25092193. Molecules. 2020. PMID: 32397080 Free PMC article. Review.
-
Forward Precision Medicine: Micelles for Active Targeting Driven by Peptides.Molecules. 2021 Jul 2;26(13):4049. doi: 10.3390/molecules26134049. Molecules. 2021. PMID: 34279392 Free PMC article. Review.
References
-
- Maxfield FR, McGraw TE. Endocytic recycling. Nat Rev Mol Cell Biol. 2004;5:121–132. - PubMed
-
- Casey JR, Grinstein S, Orlowski J. Sensors and regulators of intracellular pH. Nat Rev Mol Cell Biol. 2010;11:50–61. - PubMed
-
- Mukherjee S, Ghosh RN, Maxfield FR. Endocytosis. Physiol Rev. 1997;77:759–803. - PubMed
Publication types
MeSH terms
Substances
Grants and funding
LinkOut - more resources
Full Text Sources
Other Literature Sources
