

Acoustic diagnosis of pulmonary hypertension: automated speech- recognition-inspired classification algorithm outperforms physicians
- PMID: 27609672
- PMCID: PMC5016849
- DOI: 10.1038/srep33182
Acoustic diagnosis of pulmonary hypertension: automated speech- recognition-inspired classification algorithm outperforms physicians
Abstract
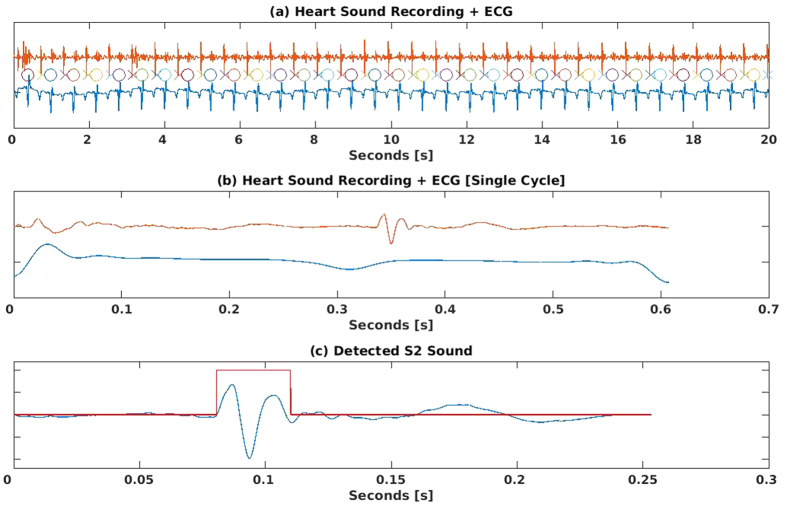
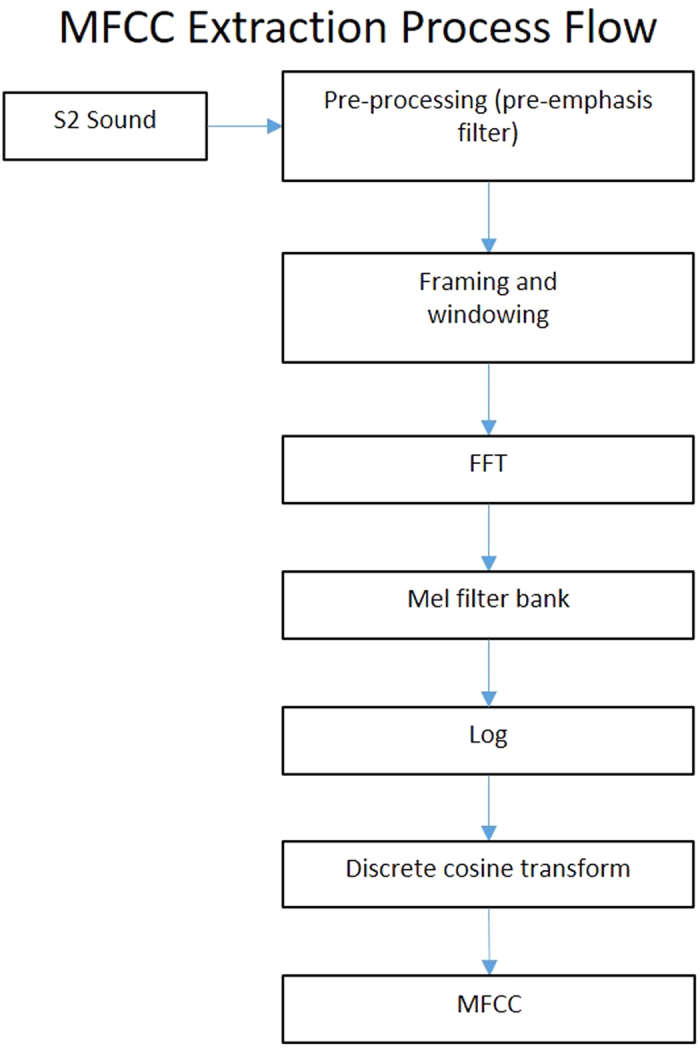
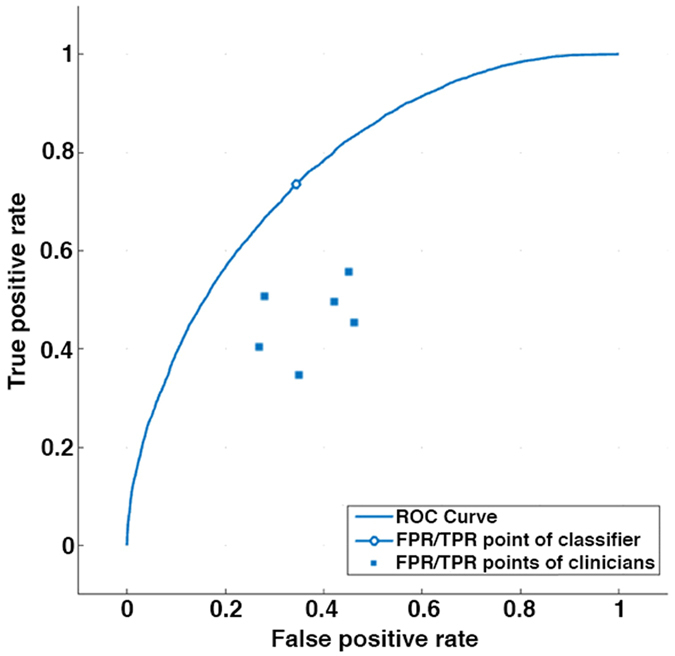
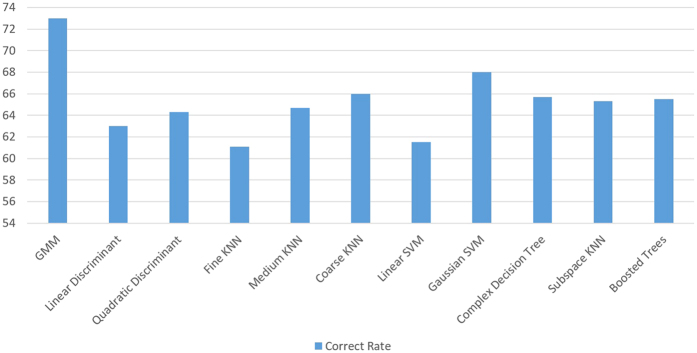
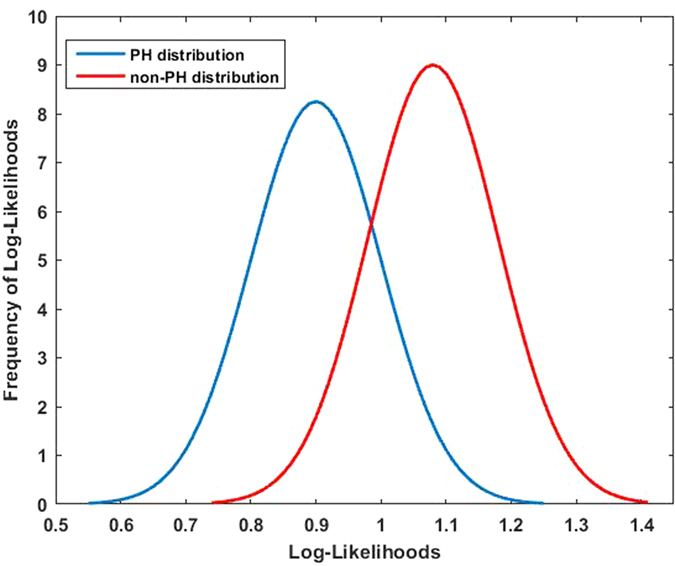
We hypothesized that an automated speech- recognition-inspired classification algorithm could differentiate between the heart sounds in subjects with and without pulmonary hypertension (PH) and outperform physicians. Heart sounds, electrocardiograms, and mean pulmonary artery pressures (mPAp) were recorded simultaneously. Heart sound recordings were digitized to train and test speech-recognition-inspired classification algorithms. We used mel-frequency cepstral coefficients to extract features from the heart sounds. Gaussian-mixture models classified the features as PH (mPAp ≥ 25 mmHg) or normal (mPAp < 25 mmHg). Physicians blinded to patient data listened to the same heart sound recordings and attempted a diagnosis. We studied 164 subjects: 86 with mPAp ≥ 25 mmHg (mPAp 41 ± 12 mmHg) and 78 with mPAp < 25 mmHg (mPAp 17 ± 5 mmHg) (p < 0.005). The correct diagnostic rate of the automated speech-recognition-inspired algorithm was 74% compared to 56% by physicians (p = 0.005). The false positive rate for the algorithm was 34% versus 50% (p = 0.04) for clinicians. The false negative rate for the algorithm was 23% and 68% (p = 0.0002) for physicians. We developed an automated speech-recognition-inspired classification algorithm for the acoustic diagnosis of PH that outperforms physicians that could be used to screen for PH and encourage earlier specialist referral.
Figures

Similar articles
-
Spectral analysis of the heart sounds in children with and without pulmonary artery hypertension.Int J Cardiol. 2014 Apr 15;173(1):92-9. doi: 10.1016/j.ijcard.2014.02.025. Epub 2014 Feb 24. Int J Cardiol. 2014. PMID: 24630336
-
Criteria for diagnosis of exercise pulmonary hypertension.Eur Respir J. 2015 Sep;46(3):728-37. doi: 10.1183/09031936.00021915. Epub 2015 May 28. Eur Respir J. 2015. PMID: 26022955
-
Detection of Heart Sounds in Children with and without Pulmonary Arterial Hypertension--Daubechies Wavelets Approach.PLoS One. 2015 Dec 2;10(12):e0143146. doi: 10.1371/journal.pone.0143146. eCollection 2015. PLoS One. 2015. PMID: 26629704 Free PMC article.
-
Non-invasive algorithms for the diagnosis of pulmonary hypertension.Thromb Haemost. 2012 Dec;108(6):1037-41. doi: 10.1160/TH12-04-0239. Epub 2012 Oct 10. Thromb Haemost. 2012. PMID: 23052634 Review.
-
Reversibility of fixed pulmonary hypertension in left ventricular assist device support recipients.Eur J Cardiothorac Surg. 2011 Oct;40(4):971-7. doi: 10.1016/j.ejcts.2011.01.019. Epub 2011 Feb 26. Eur J Cardiothorac Surg. 2011. PMID: 21354812 Review.
Cited by
-
Audio Recording Patient-Nurse Verbal Communications in Home Health Care Settings: Pilot Feasibility and Usability Study.JMIR Hum Factors. 2022 May 11;9(2):e35325. doi: 10.2196/35325. JMIR Hum Factors. 2022. PMID: 35544296 Free PMC article.
-
Digital stethoscope: technology update.Med Devices (Auckl). 2018 Jan 4;11:29-36. doi: 10.2147/MDER.S135882. eCollection 2018. Med Devices (Auckl). 2018. PMID: 29379321 Free PMC article. Review.
-
Ethical guidance for reporting and evaluating claims of AI outperforming human doctors.NPJ Digit Med. 2024 Oct 2;7(1):271. doi: 10.1038/s41746-024-01255-w. NPJ Digit Med. 2024. PMID: 39358556 Free PMC article.
-
Deep learning to predict elevated pulmonary artery pressure in patients with suspected pulmonary hypertension using standard chest X ray.Sci Rep. 2020 Nov 17;10(1):19311. doi: 10.1038/s41598-020-76359-w. Sci Rep. 2020. PMID: 33203947 Free PMC article.
-
Explanatory deep learning to predict elevated pulmonary artery pressure in children with ventricular septal defects using standard chest x-rays: a novel approach.Front Cardiovasc Med. 2024 Jan 12;11:1330685. doi: 10.3389/fcvm.2024.1330685. eCollection 2024. Front Cardiovasc Med. 2024. PMID: 38283829 Free PMC article.
References
-
- Rich S., Dantzker D. R. & Ayres N. A. Primary pulmonary hypertension: a national prospective study. Ann Int Med 107, 216–223 (1987). - PubMed
Publication types
MeSH terms
LinkOut - more resources
Full Text Sources
Other Literature Sources
Medical
