

Automatic Construction of Predictive Neuron Models through Large Scale Assimilation of Electrophysiological Data
- PMID: 27605157
- PMCID: PMC5015021
- DOI: 10.1038/srep32749
Automatic Construction of Predictive Neuron Models through Large Scale Assimilation of Electrophysiological Data
Abstract
We report on the construction of neuron models by assimilating electrophysiological data with large-scale constrained nonlinear optimization. The method implements interior point line parameter search to determine parameters from the responses to intracellular current injections of zebra finch HVC neurons. We incorporated these parameters into a nine ionic channel conductance model to obtain completed models which we then use to predict the state of the neuron under arbitrary current stimulation. Each model was validated by successfully predicting the dynamics of the membrane potential induced by 20-50 different current protocols. The dispersion of parameters extracted from different assimilation windows was studied. Differences in constraints from current protocols, stochastic variability in neuron output, and noise behave as a residual temperature which broadens the global minimum of the objective function to an ellipsoid domain whose principal axes follow an exponentially decaying distribution. The maximum likelihood expectation of extracted parameters was found to provide an excellent approximation of the global minimum and yields highly consistent kinetics for both neurons studied. Large scale assimilation absorbs the intrinsic variability of electrophysiological data over wide assimilation windows. It builds models in an automatic manner treating all data as equal quantities and requiring minimal additional insight.
Figures
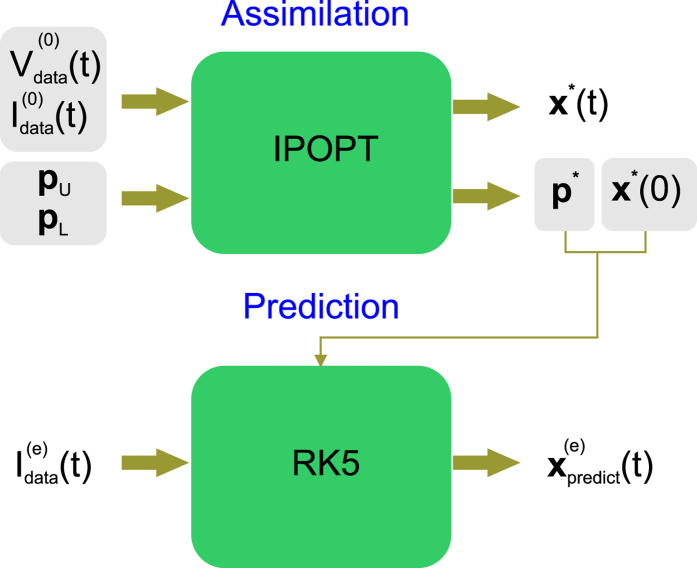
 and resultant time series membrane voltage
  of the epoch to assimilate (Epoch 0) are input into the nonlinear optimization filter (IPOPT). These provide the equality constraints. The user specifies the inequality constraints by choosing the upper and lower boundaries of the parameter search intervals, pL and pU. IPOPT outputs the state variables x*(t) solution of the minimization problem at each point of the assimilation window, together with the parameter solutions p*. The extracted parameters p* are inserted in the model equations to construct the completed model. The state of the neuron xpredict(t) is predicted by integrating the current protocol
  forward from initial conditions x*(0) using a fifth order, adaptive step size, Runge-Kutta solver (RK5). The model is validated by comparing the predicted membrane voltage
  with the voltage
  recorded in Epoch e.
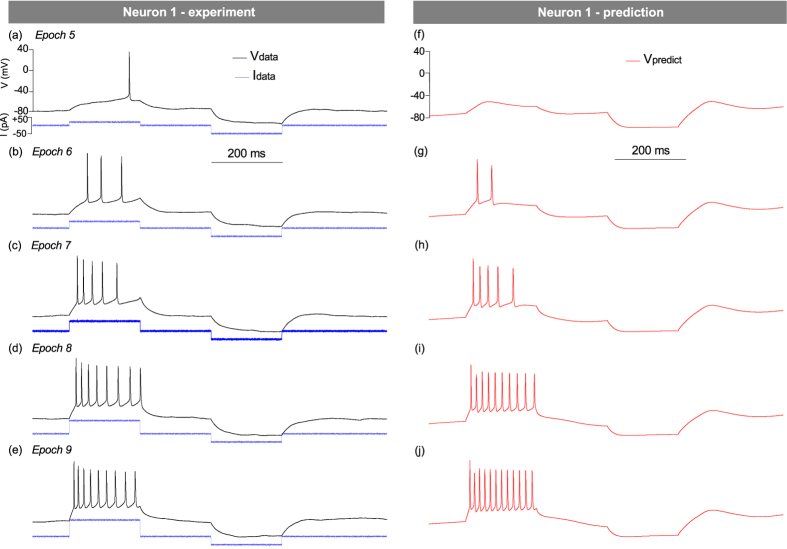
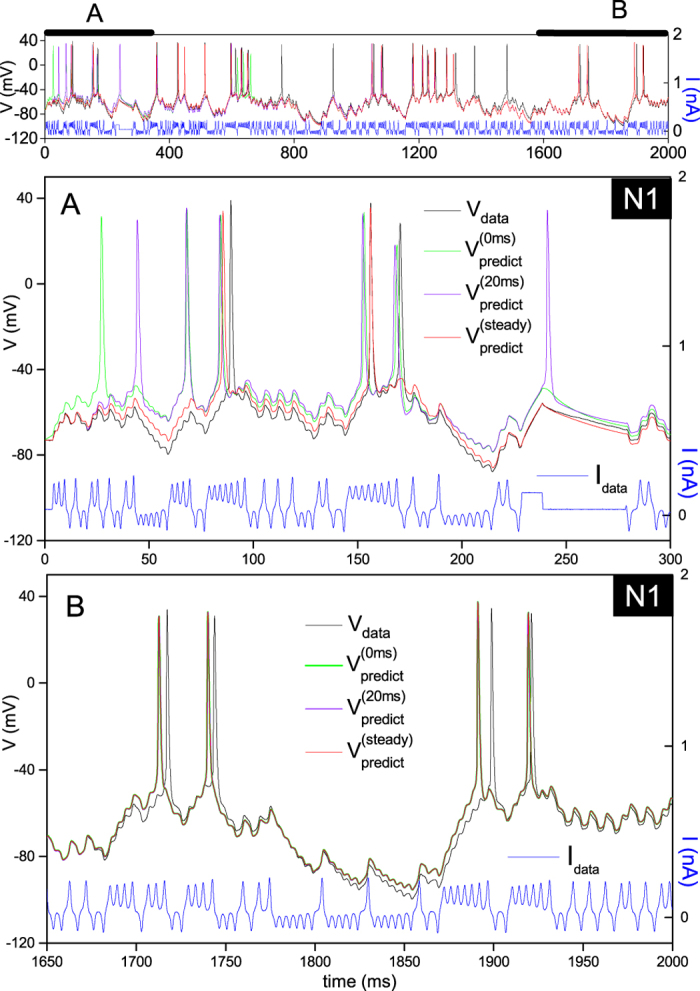
 (black line) was recorded under current clamp stimulation by current waveform
  (blue line). N1 is a putative RA-projecting neuron (top panel) and N2 is a X-projecting neuron (bottom panel). The assimilation window used to extract the parameters spans the interval [0–1600 ms] for N1 and [190 ms–1090 ms] for N2. The membrane voltage solution of the constrained optimization problem is V *(t) (green line). The membrane voltage predicted by integrating the experimental current waveform is
  (red line). Details of the oscillations of N2 are plotted in supplementary Figure S7.
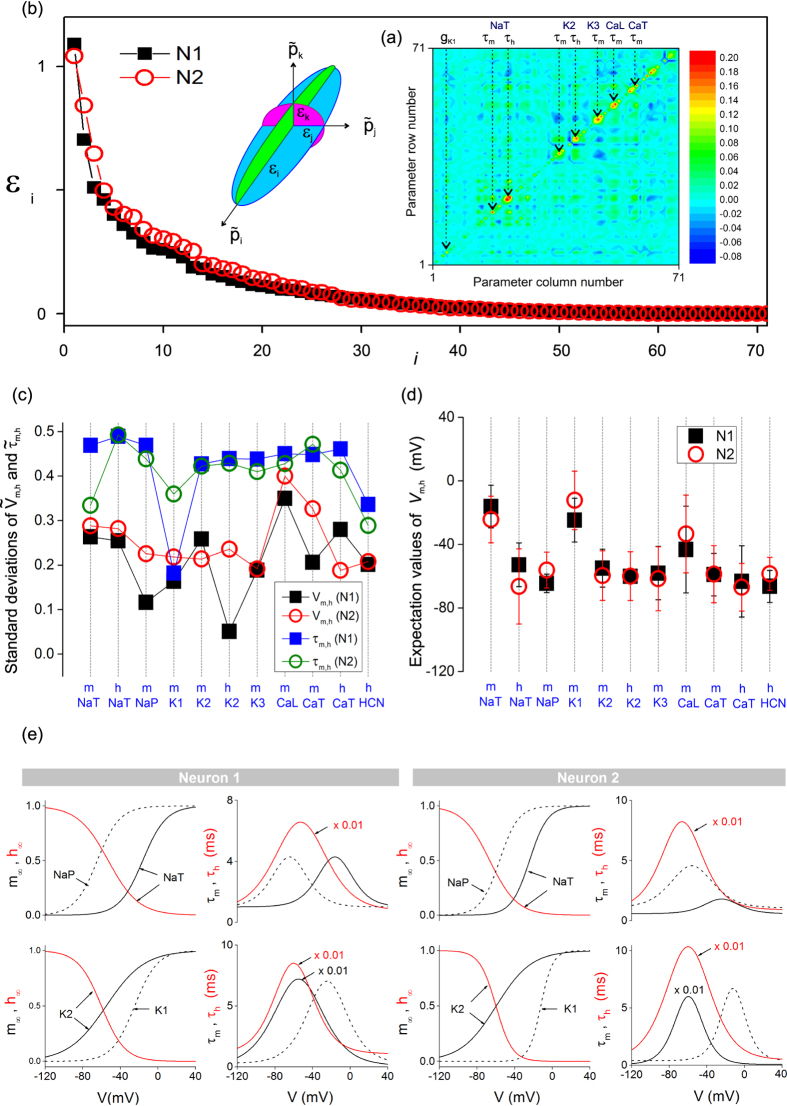
 of N1. The dashed arrows indicate the sloppy parameters with the largest off-diagonal matrix elements. (b) Spectrum of eigenvalues of the covariance matrix of N1 (black squares) and N2 (red circles) which measure the length of the principal axes of the data misfit ellipsoid (inset). (c) Standard deviations of activation and inactivation voltage thresholds and recovery times of neuron N1 (square symbols) and N2 (circles). (d) Maximum likelihood expectation values of the activation and inactivation thresholds of N1 (dark squares) and N2 (red circles). The error bars are the standard deviations. (e) Stationary values (m∞, h∞) and time constants (τm, τh) of the activation and inactivation variables of NaT, NaP, K1 and K2 ion currents for neurons N1 and N2. These were calculated using the maximum likelihood expectation of parameters.
Similar articles
-
Estimating parameters and predicting membrane voltages with conductance-based neuron models.Biol Cybern. 2014 Aug;108(4):495-516. doi: 10.1007/s00422-014-0615-5. Epub 2014 Jun 25. Biol Cybern. 2014. PMID: 24962080
-
Exploring parameter space in detailed single neuron models: simulations of the mitral and granule cells of the olfactory bulb.J Neurophysiol. 1993 Jun;69(6):1948-65. doi: 10.1152/jn.1993.69.6.1948. J Neurophysiol. 1993. PMID: 7688798
-
Electrophysiological characterization and computational models of HVC neurons in the zebra finch.J Neurophysiol. 2013 Sep;110(5):1227-45. doi: 10.1152/jn.00162.2013. Epub 2013 May 29. J Neurophysiol. 2013. PMID: 23719205
-
Optimal solid state neurons.Nat Commun. 2019 Dec 3;10(1):5309. doi: 10.1038/s41467-019-13177-3. Nat Commun. 2019. PMID: 31796727 Free PMC article.
-
Ionic conductance mechanisms contributing to the electrophysiological properties of neurons.Curr Opin Neurobiol. 1991 Jun;1(1):105-12. doi: 10.1016/0959-4388(91)90017-2. Curr Opin Neurobiol. 1991. PMID: 1726580 Review.
Cited by
-
Optimal control methods for nonlinear parameter estimation in biophysical neuron models.PLoS Comput Biol. 2022 Sep 15;18(9):e1010479. doi: 10.1371/journal.pcbi.1010479. eCollection 2022 Sep. PLoS Comput Biol. 2022. PMID: 36108045 Free PMC article.
-
Scaling and Benchmarking an Evolutionary Algorithm for Constructing Biophysical Neuronal Models.Front Neuroinform. 2022 Jun 17;16:882552. doi: 10.3389/fninf.2022.882552. eCollection 2022. Front Neuroinform. 2022. PMID: 35784184 Free PMC article.
-
Single shot detection of alterations across multiple ionic currents from assimilation of cell membrane dynamics.Sci Rep. 2024 Mar 12;14(1):6031. doi: 10.1038/s41598-024-56576-3. Sci Rep. 2024. PMID: 38472404 Free PMC article.
-
Kernel Reconstruction for Delayed Neural Field Equations.J Math Neurosci. 2018 Feb 5;8(1):3. doi: 10.1186/s13408-018-0058-8. J Math Neurosci. 2018. PMID: 29399710 Free PMC article.
-
Estimation of neuron parameters from imperfect observations.PLoS Comput Biol. 2020 Jul 16;16(7):e1008053. doi: 10.1371/journal.pcbi.1008053. eCollection 2020 Jul. PLoS Comput Biol. 2020. PMID: 32673311 Free PMC article.
References
-
- Abarbanel H. D. I. Predicting the future: Completing Models of Observed Complex Systems, Springer-Verlag. June (2013)
-
- Markram H. The Blue Brain project. Nature Rev. Neurosci. 7, 153 (2006). - PubMed
-
- Prinz A. A., Billimoria C. P. & Marder E. Alternative to hand-tuning conductance-based models: constriction and analysis of databases of model neurons. J. Neurophysiol. 90, 4015 (2003). - PubMed
-
- Golowasch J. S. G. M., Abbott L. F. & Marder E. Failure of averaging in the construction of a conductance-based neuron model. J. Neurophysiol. 87, 1129 (2002). - PubMed
Publication types
MeSH terms
Substances
Grants and funding
LinkOut - more resources
Full Text Sources
Other Literature Sources
