. 2016 Sep 20;113(38):10553-8.
doi: 10.1073/pnas.1606863113. Epub 2016 Sep 6.

Structural mechanism for the recognition and ubiquitination of a single nucleosome residue by Rad6-Bre1

Affiliations

Structural mechanism for the recognition and ubiquitination of a single nucleosome residue by Rad6-Bre1

Laura D Gallego et al. Proc Natl Acad Sci U S A. .

Abstract

Cotranscriptional ubiquitination of histone H2B is key to gene regulation. The yeast E3 ubiquitin ligase Bre1 (human RNF20/40) pairs with the E2 ubiquitin conjugating enzyme Rad6 to monoubiquitinate H2B at Lys123. How this single lysine residue on the nucleosome core particle (NCP) is targeted by the Rad6-Bre1 machinery is unknown. Using chemical cross-linking and mass spectrometry, we identified the functional interfaces of Rad6, Bre1, and NCPs in a defined in vitro system. The Bre1 RING domain cross-links exclusively with distinct regions of histone H2B and H2A, indicating a spatial alignment of Bre1 with the NCP acidic patch. By docking onto the NCP surface in this distinct orientation, Bre1 positions the Rad6 active site directly over H2B Lys123. The Spt-Ada-Gcn5 acetyltransferase (SAGA) H2B deubiquitinase module competes with Bre1 for binding to the NCP acidic patch, indicating regulatory control. Our study reveals a mechanism that ensures site-specific NCP ubiquitination and fine-tuning of opposing enzymatic activities.

Keywords: Bre1–Rad6; RING E3 ligase; cross-linking mass spectrometry; nucleosome; ubiquitin.


Conflict of interest statement

The authors declare no conflict of interest.

Figures
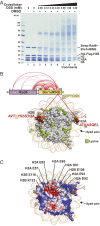
Fig. 1.
Fig. 1.
Bre1–NCP interaction topology determined by XL-MS. (A) Titration of DSS to recombinant Rad6∼Bre1 and NCP (S. cerevisiae proteins mixed at a 1:1 molar ratio). Samples were separated by SDS/PAGE (4–12%, MOPS buffer) and stained by Coomassie. DSS at 0.24 mM was chosen for further XL-MS analysis. (B) XL-MS analysis revealed Rad6∼Bre1 intralinks and interlinks with NCP (red lines). Yeast NCP (PDB ID code 1ID3) is depicted in surface representation when viewed down the DNA superhelical axis. Sequences of cross-linked Bre1 and histone peptides with amino acid position of Lys residues are indicated. Peptides (red) were mapped onto the NCP surface. H2B Lys123 is labeled in orange; all other NCP Lys residues visible in the structure are in green. The C terminus of H2A is only partially resolved (dashed line). Dotted white line represents the axis between cross-linked H2B and H2A peptides. NCP dyad axis is indicated as a reference. (C) NCP electrostatic surface potential (negative in red, positive in blue) highlights the NCP acidic patch formed by H2A/H2B residues. Axis of cross-linked peptides as in B. H2B Lys123 is also indicated.
Fig. S1.
Fig. S1.
(A) Titration of DSS to recombinant Rad6∼Bre1 and NCP (Saccharomyces cerevisiae proteins mixed at a 1:1 M ratio). Samples were separated by SDS/PAGE (4–12%, MOPS buffer), analyzed by immunoblotting against Strep-Rad6∼Bre1 and His-Flag–H2B and show the presence of cross-linked high molecular weight complexes. DSS at 0.24 mM was chosen for further XL-MS analysis. (B) XL-MS analysis of intralinks (red) and interlinks (dotted black lines) among yeast histones.
Fig. 2.
Fig. 2.
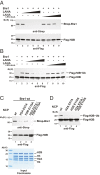
The NCP acidic patch directly recruits Bre1. (A) The LANA peptide competes with Bre1 for interaction with the NCP acidic patch. In vitro binding assays with recombinant NCPs immobilized on anti-Flag beads and recombinant full-length Strep-tagged Bre1 incubated in a 1:3 molar ratio (NCP:Bre1). LANA (lanes 2–5) or a LANA_LRS > AAA peptide (lanes 6–9), mutated in critical NCP-interacting residues (25), were added with increasing concentrations (20, 40, 60, 80 µM). Following elution, anti-Strep immunoblotting was used to detect NCP-bound Strep–Bre1. Anti-Flag detection confirmed equal input of NCPs. The asterisk indicates an H2B degradation product. (B) H2B Lys123∼Ub by Bre1 requires an accessible NCP acidic patch. In vitro NCP ubiquitination assay was performed in the presence of LANA (lanes 3–6) or a LANA_LRS > AAA peptide (lanes 7–10) (20, 40, 60, 80 µM peptide). Anti-Flag immunoblotting detects both H2B and H2B Lys123∼Ub. (C) NCP acidic patch mutations impair Bre1 recognition. In vitro binding assay with NCP wild-type or different NCP mutants carried out as in A. Input of mutant NCPs shows their intact stoichiometry. (D) NCP acidic patch mutations affect H2B Lys123∼Ub. In vitro NCP ubiquitination assay with wild-type or mutant NCPs. Reactions were incubated for 20 min and analyzed by SDS/PAGE and immunoblotting.
Fig. 3.
Fig. 3.
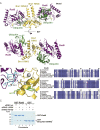
Bre1 RING-Rad6 complex based on XL-MS and homology modeling. (A) Ribbon representation of the modeled S. cerevisiae Bre1 RING domain (yellow) interaction with Rad6 (purple). See Fig. S2A for further details on modeling templates and a version that includes ubiquitin. Zinc ions are shown as gray spheres. The Rad6 active site is marked as a yellow stick. The Rad6 N-terminal helix 1 (H1) and loops L4 and L7 comprise the canonical E3-binding site. Cross-linked peptides (Bre1 in green; Rad6 in cyan) were mapped onto the structure and their sequences are indicated with the same color code, including amino acid position of cross-linked Lys residues. Boxed region is magnified in B. (B) Close-up of the predicted Bre1 RING–Rad6 interface highlighting cross-linked peptides in Bre1 (green) and Rad6 (cyan). Side-chains of relevant residues are shown in stick representation and measured distances between cross-linked lysines are indicated. (C) Sequence alignment of Bre1 RING domain orthologs from S. cerevisiae, Candida glabrata, Gallus gallus, Drosophila melanogaster, Mus musculus, and Homo sapiens. Zinc-coordinating residues are labeled in red. Asterisks indicate the position of residues involved in Bre1 RING-Rad6 interaction. The alignment was generated with ClustalW and colored in Jalview by identity. Numbers refer to S. cerevisiae Bre1 residues.
Fig. S2.
Fig. S2.
(A) Homology model of the dimeric S. cerevisiae Bre1 RING domain (yellow) (PDB ID code 4R7E) bound to S. cerevisiae Rad6 (purple) (PDB ID code 1AYZ) charged with ubiquitin (green) is shown in ribbon representation. Gray spheres are zinc ions. The Rad6 active site Cys88 is marked as a yellow stick. A BLAST search with the S. cerevisiae Bre1 RING sequence against sequences of known RING structures deposited in PDB identified the Cbl RING domain from the Cbl–UbcH7 complex (PDB ID code 1FBV) as the highest-scoring homolog. Superposition of the Cbl–RING with Bre1–RING resulted in an excellent spatial alignment (0.7 Å rmsd). This alignment brought UbcH7 to the Bre1–RING dimer. Superposition of S. cerevisiae Rad6 to UbcH7 resulted in a reasonable spatial alignment (1.5 Å rmsd). These steps were repeated for the second copy of the Bre1RING in the homodimer. The RNF4–UbcH5∼Ub (PDB ID code 4AP4) was superimposed onto Rad6, bringing ubiquitin to Rad6. This was repeated for the second copy of Rad6 in the Bre1 dimer. The end result is a dimeric form of a Bre1 RING–Rad6∼Ub complex. (B) Close-up of the Bre1 RING–Rad6 model highlighting an oppositely charged interface. Three Rad6 acidic residues located on a loop are shown in stick representation (cyan) and measured distances to Bre1 Arg675 are indicated. Cross-linked Lys residues on Bre1 (Lys673, Lys682 in green) and Rad6 (Lys66 in cyan) are also indicated as a reference. (Right) Sequence alignment of Rad6 orthologs in the fungi/metazoa group. The Rad6 catalytic Cys88 is labeled in red. Asterisks mark the position of Rad6 acidic residues potentially interacting with the Bre1 RING domain. The alignment was generated with ClustalW and colored in Jalview by identity. Numbers refer to S. cerevisiae Rad6 residues. (C) In vitro binding assay with GST–Rad6 immobilized on GSH beads and incubated with Bre1 eRING constructs in 1:5-M ratio. Recombinant GST was used as negative control. After elution, proteins were analyzed by SDS/PAGE (4–12%, MOPS buffer) and Coomassie staining. Same eluates were immunoblotted with anti-Strep antibody (see Fig. 4C).
Fig. 4.
Fig. 4.
Bre1 residues required for Rad6 activation and NCP recognition. (A) Representative immunoblot of a single turnover ubiquitin discharge experiment, in which precharged Rad6∼Ub was incubated without Bre1 or with 100 µM of wild-type or mutant Bre1 eRING. Reactions were stopped after 0, 10, and 20 min by denaturation. Samples were separated by nonreducing SDS/PAGE (12% gel, MES buffer) followed by anti-His immunoblotting. Bre1 proteins are shown (Left). (B) Quantification of single turnover experiments as shown in A. Intensity of the Rad6∼Ub and Rad6 bands were quantified with the ImageLab 1.5.2 software. The ratio between Rad6∼Ub and Rad6 was calculated for every condition and time 0 was used for normalization. Four independent experiments were performed. Mean and SD are indicated. (C) Bre1 RING mutants are not impaired in Rad6 binding. GST–Rad6 was immobilized on GSH beads and incubated with Bre1 eRING constructs in a 1:5 molar ratio. Recombinant GST was used as negative control. After elution, bound proteins were detected by anti-Strep immunoblotting. See Fig. S2C for protein input. (D) Specific RING domain mutations impair NCP recognition. In vitro binding assay with NCPs immobilized on anti-FLAG beads and Bre1 constructs added in 1:3 molar ratio (NCP:Bre1). After elution, immunoblotting was used to detect NCP-bound Bre1 and equal NCP loading. Input for recombinant Bre1 proteins is shown (Lower). (E) In vitro NCP ubiquitination assay performed with the indicated Bre1 mutants.
Fig. 5.
Fig. 5.
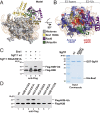
Model of Bre1 RING–Rad6∼Ub interaction with the NCP. (A) Orthogonal view of the E3–E2∼Ub complex that was manually docked onto the NCP acidic patch and subjected to energy minimization and MD equilibration. H2B Lys123 is labeled in orange. The Rad6 active site (Cys88) is depicted as a yellow sphere. (B) View of the complex looking down on the DNA superhelical axis. The electrostatic surface potential of the histone octamer (negative in red, positive in blue) is indicated. Basic residues at the “base” of the RING domain (Arg679, Arg681, and Lys682) are labeled as blue spheres. The estimated Cα cross-linking distances between Bre1 Lys682 and the H2A peptide are 22.6 Å (Bre1 Lys682–H2A Thr125; note that cross-linked H2A Lys126 is not resolved in the NCP structure) and 15.1 Å for Bre1 Lys682 and H2B Lys123. (C) Bre1 competes with the Sgf11 ZnF for recognition of the NCP acidic patch. In vitro NCP ubiquitination assay was performed in the presence of wild-type or mutant GST–Sgf11–Sus1 (60 µM). Reactions were incubated for 60 min and analyzed by SDS/PAGE and immunoblotting. Input for Sgf11–Sus1 constructs is shown (Right). (D) Global H2B Lys123∼Ub levels depend on an intact NCP acidic patch. Cell lysates from S. cerevisiae strains with Flag-tagged histone H2B were subjected to anti-Flag immunoprecipitation. Recovered proteins were detected by immunoblotting.
Fig. S3.
Fig. S3.
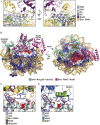
(A) Distance measurements between the Rad6 active site and histone Lys residues on the NCP surface. Structure is based on manual-docking/MD simulations. The active site Cys88 of Rad6 is highlighted as a yellow stick, Ubiquitin was omitted for clarity. All nucleosomal Lys residues are shown in green stick mode, only H2B Lys123 is marked in orange. Distances between the Cα atom of Rad6 Cys88 and adjacent histone Lys Cα atoms were measured in PyMol. H2B Lys123 lies closest to the Rad6 active site. (B) Superposition analysis of the Bmi1–Ring1B∼UbcH5c–NCP complex (PDB ID code 4R8P) with the Bre1–Rad6∼Ub–NCP model using the NCP for alignment. Both E3 RING domains insert their Arg anchors into the NCP acidic patch. However, the resulting E3–E2 geometry is entirely different as the E2 enzymes are rotated by ∼180° when viewed down the DNA superhelical axis. The electrostatic surface potential of the yeast histone octamer (negative in red, positive in blue) is indicated. The active sites of the E2 enzymes (Cys88 for Rad6; Cys85 for UbcH5) are labeled as yellow spheres. (C) Close-up view of the S. cerevisiae Bre1 RING domain in contact with the S. cerevisiae NCP (XL-MS/homology model). Critical basic residues on the Bre1 RING (blue) and acidic NCP residues (red) are shown in stick mode. The catalytic center of Rad6 appears as a yellow sphere and the target Lys123 is highlighted as an orange stick. (D) Close-up view of the S. cerevisiae DUB module Sgf11 ZnF in complex with the Xenopus laevis NCP (PDB ID code 4ZUX). Criticial basic and acidic residues as well as the target lysine are indicated in stick mode (color code as in C). The highlighted X. laevis acidic patch residues correspond to the yeast acidic NCP residues in a sequence alignment.

Similar articles

Cited by

References

    1. Luger K, Mäder AW, Richmond RK, Sargent DF, Richmond TJ. Crystal structure of the nucleosome core particle at 2.8 A resolution. Nature. 1997;389(6648):251–260. - PubMed
    1. Taverna SD, Li H, Ruthenburg AJ, Allis CD, Patel DJ. How chromatin-binding modules interpret histone modifications: Lessons from professional pocket pickers. Nat Struct Mol Biol. 2007;14(11):1025–1040. - PMC - PubMed
    1. McGinty RK, Tan S. Nucleosome structure and function. Chem Rev. 2015;115(6):2255–2273. - PMC - PubMed
    1. Wood A, et al. Bre1, an E3 ubiquitin ligase required for recruitment and substrate selection of Rad6 at a promoter. Mol Cell. 2003;11(1):267–274. - PubMed
    1. Robzyk K, Recht J, Osley MA. Rad6-dependent ubiquitination of histone H2B in yeast. Science. 2000;287(5452):501–504. - PubMed

Publication types

MeSH terms

LinkOut - more resources