. 2016 Sep 2;13(1):234.
doi: 10.1186/s12974-016-0692-6.

The anti-inflammatory Annexin A1 induces the clearance and degradation of the amyloid-β peptide

Affiliations

The anti-inflammatory Annexin A1 induces the clearance and degradation of the amyloid-β peptide

Miriam Ries et al. J Neuroinflammation. .

Abstract

Background: The toxicity of amyloid-β (Aβ) peptide present in the brain of Alzheimer's disease (AD) patients is thought to be mediated via the increased secretion of pro-inflammatory mediators, which can lead to neuronal dysfunction and cell death. In addition, we have previously shown that inflammation can affect Aβ generation. More recently, we have reported that in vitro administration of the anti-inflammatory mediator Annexin A1 (ANXA1) following an inflammatory challenge suppressed microglial activation and this effect was mediated through formyl peptide receptor-like 1 (FPRL1/FPR2) signalling. The aim of this study was to determine the potential role of ANXA1 in the generation and clearance of Aβ.

Methods: We first compared ANXA1 protein expression in the brains of AD patients and healthy controls as well as in the 5XFAD model of AD. To determine the role of ANXA1 in the processing of amyloid precursor protein (APP) and the degradation of Aβ, N2a neuroblastoma cells were treated with human recombinant ANXA1 or transfected with ANXA1 siRNA. We also investigated the effect of ANXA1 on Aβ phagocytosis and microglial activation in BV2 cells treated with synthetic Aβ.

Results: Our data show that ANXA1 is increased in the brains of AD patients and animal models of AD at early stages. ANXA1 was able to reduce the levels of Aβ by increasing its enzymatic degradation by neprilysin in N2a cells and to stimulate Aβ phagocytosis by microglia. These effects were mediated through FPRL1 receptors. In addition, ANXA1 inhibited the Aβ-stimulated secretion of inflammatory mediators by microglia.

Conclusions: These data suggest that ANXA1 plays a pivotal role in Aβ clearance and supports the use of ANXA1 as potential pharmacological tool for AD therapeutics.

Keywords: Alzheimer’s disease; Amyloid-β; Annexin A1; Anti-inflammatory; Formyl-peptide receptor; Inflammation; Microglia; Neprilysin.


Figures
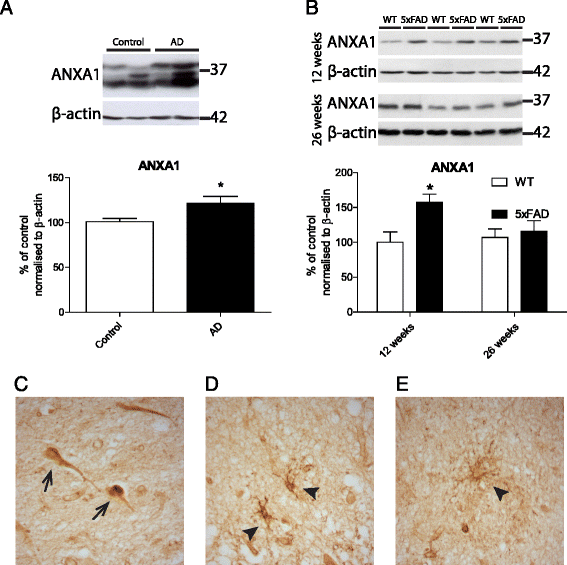
Fig. 1
Fig. 1
ANXA1 is increased in postmortem brains of AD patients and in 5XFAD mice. a Representative blots and quantification of ANXA1 expression in the frontal cortex of neurologically healthy controls and sporadic Alzheimer’s patients and normalised to β-actin (n = 20 controls, 12 males, 8 females, range 40–97 years, mean age 73.24 ± 4 years, n = 22 AD cases, 11 males, 11 females, range 42–98 years, mean age 79.09 ± 3 years). b Representative blots and quantification of ANXA1 expression in the cortex of 5XFAD mice and wild-type littermates and normalised to β-actin (n = 6/group, males aged 12 and 26 weeks). ce Representative images of human postmortem AD brain hippocampal sections stained for ANXA1. Arrows indicate expression in neurons (c), microglia (d) and astrocytic (e) staining. Values shown in graphs represent the mean value ± SEM and are expressed as fold change in comparison to the normalized control. Statistical analysis included Student’s independent two-tailed t test, *p < 0.05
Fig. 2
Fig. 2
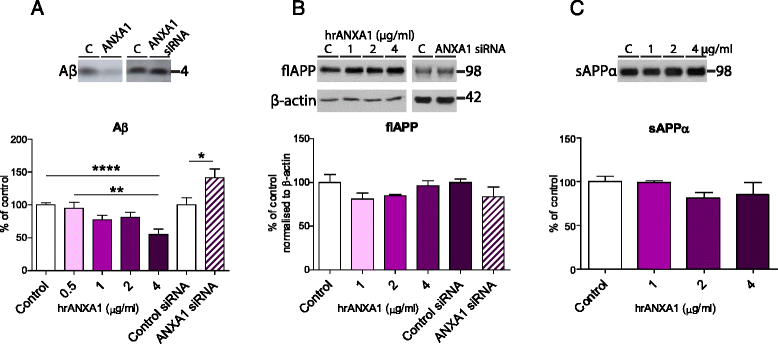
Treatment of neuroblastoma cells with recombinant ANXA1 reduces the levels of soluble Aβ. a Representative Western blots and quantification of soluble Aβ in the medium of N2asw cells treated with 0.5–4 μg/ml hrANXA1 for 18 h (n = 9–24 samples) or transfected with control or ANXA1 siRNA (n = 15 samples). b Representative Western blots and quantification of full-length APP protein expression in N2asw cells treated with 1–4 μg/ml hrANXA1 for 18 h (n = 3–11 samples) or transfected with control or ANXA1 siRNA (n = 15 samples) and normalised to β-actin. c Representative Western blots and quantification of soluble APPα in the medium of N2asw cells treated with 1–4 μg/ml hrANXA1 for 18 h (n = 3–11 samples). Values shown in graphs represent the mean value ± SEM and are expressed as fold change in comparison to the normalized control. Statistical analysis included one-way ANOVA with Bonferroni’s multiple-comparison post-test or independent two-tailed Student’s t test, *p < 0.05, **p < 0.01, ****p < 0.0001
Fig. 3
Fig. 3
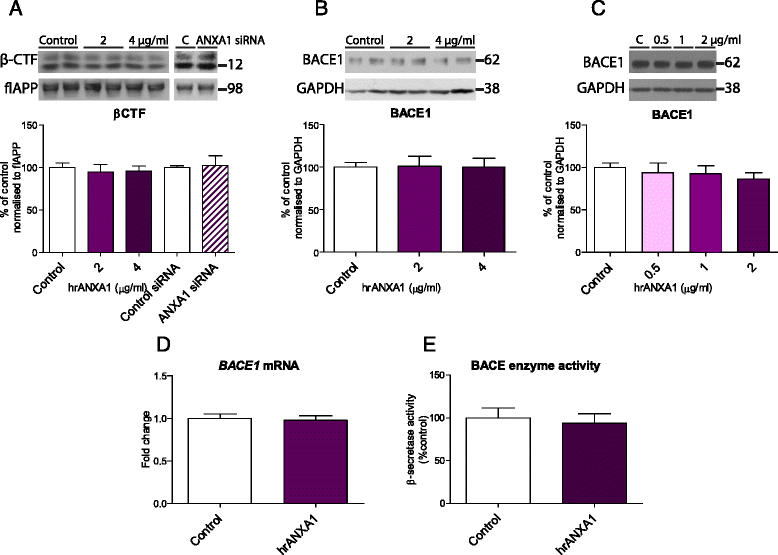
Treatment of neuroblastoma cells with recombinant ANXA1 does not affect BACE1 activity or expression. a Representative Western blots and quantification of β-CTF expression in N2asw cells treated with 2–4 μg/ml hrANXA1 for 18 h (n = 9–18 samples) or transfected with control or ANXA1 siRNA (n = 9 samples) and normalised to full-length APP. b Representative Western blots and quantification of BACE1 protein expression in N2asw cells treated with 2–4 μg/ml hrANXA1 for 18 h and normalised to GAPDH (n = 6–12 samples). c Representative Western blots and quantification of BACE1 protein expression in SK-N-SH cells treated with 0.5–2 μg/ml hrANXA1 for 18 h and normalised to GAPDH (n = 15–27 samples). d Quantification of BACE1 mRNA expression by qPCR analysis in SK-N-SH cells treated with 2 μg/ml hrANXA1 for 18 h (n = 9 samples). e Quantification of β-secretase activity in N2asw cells following treatment with 4 μg/ml hrANXA1 for 18 h (n = 5 samples). Values shown in graphs represent the mean value ± SEM and are expressed as fold change in comparison to the normalized control
Fig. 4
Fig. 4
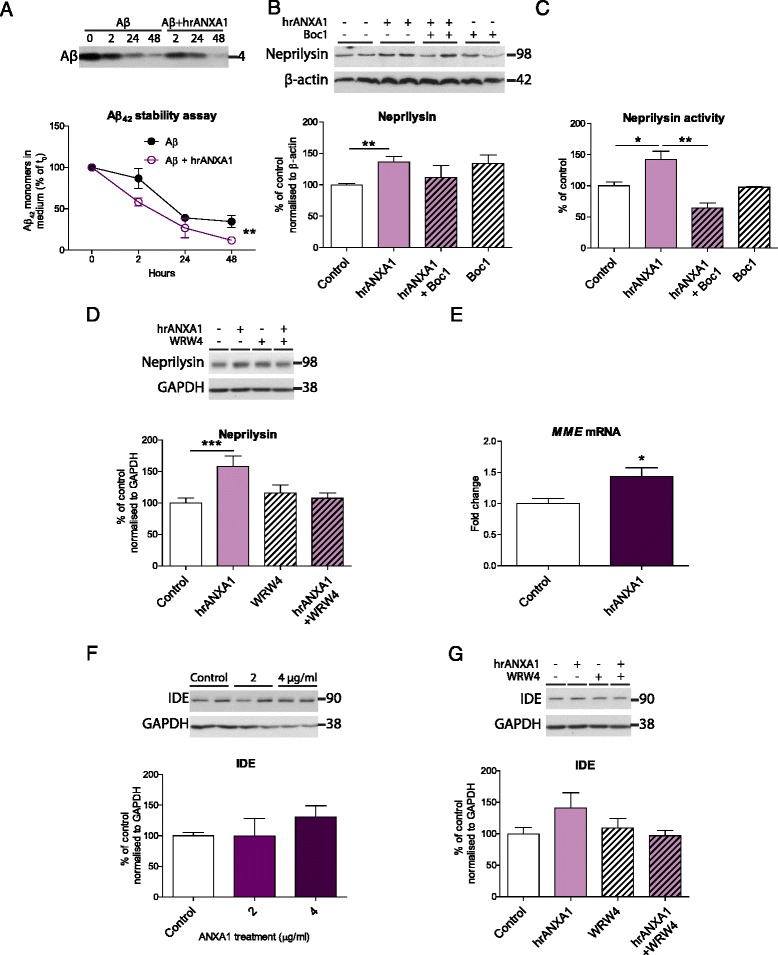
hrANXA1 treatment increases the expression and activity of Aβ-degrading enzyme neprilysin. a Representative Western blots and quantification of synthetic Aβ1–42 monomers expression in the medium of N2asw cells incubated with synthetic Aβ1–42 (0.1 μM), following 0–48-h treatment with 10-nM hrANXA1 assessed by Western blotting using 6E10 antibody (n = 3). b Representative Western blots and quantification of neprilysin protein expression in N2asw cells treated with 4 μg/ml hrANXA1 and/or the non-selective FPR inhibitor Boc1 (5 μg/ml) for 18 h, normalised to β-actin (n = 10–37 samples). c Quantification of neprilysin activity in N2asw cells treated with 4 μg/ml hrANXA1 and/or the non-selective FPR inhibitor Boc1 (5 μg/ml) for 18 h (n = 2–8 samples). d Representative Western blots and quantification of neprilysin protein expression in SK-N-SK cells treated with 2 μg/ml hrANXA1 and/or selective FPR2 inhibitor WRW4 (5 μM) for 18 h normalised to GAPDH (n = 11–21 samples). e Quantification of MME (neprilysin) mRNA expression by qPCR analysis in SK-N-SK cells treated with 2 μg/ml hrANXA1 for 18 h (n = 5–6 samples). f Representative Western blots and quantification of IDE protein expression in N2asw cells treated with 2–4 μg/ml hrANXA1 for 18 h and normalised to GAPDH. g Representative Western blots and quantification of IDE protein expression in SK-N-SK cells treated with 2 μg/ml hrANXA1 and/or selective FPR2 inhibitor WRW4 (5 μM) for 18 h, normalised to GAPDH (n = 10–18 samples). Values shown in graphs represent the mean value ± SEM and are expressed as a percentage change in comparison to the normalized control or fold change of control. Statistical analysis included two-way ANOVA, one-way ANOVA with Bonferroni’s multiple-comparison post-test, Kruskal-Wallis test with Dunn’s multiple-comparison post-test or unpaired Student’s two-tailed t test as appropriate, *p < 0.05, **p < 0.01, ***p < 0.001
Fig. 5
Fig. 5
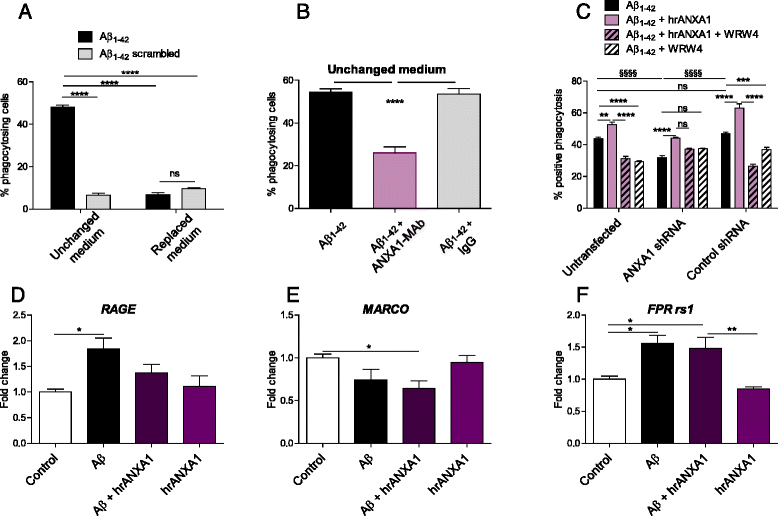
ANXA1 increases microglial phagocytosis of Aβ1–42. ab Phagocytosis of 5-FAM-labelled-Aβ1–42 or 5-FAM-labelled-scrambled Aβ1–42 by BV2 microglia incubated for 3 h with 3 μg/ml of these compounds in medium that has been conditioned by BV2 cells for 18 h overnight or freshly changed prior to Aβ incubation (n = 9), measured by FACS. b Phagocytosis of 5-FAM-labelled-Aβ1–42 (3 μg/ml) by BV2 microglia after 3-h incubation with anti-ANXA1-antibody (20 ng/ml) or anti-IgG-antibody when medium has been conditioned by BV2 cells overnight, measured by FACS (n = 9). c Phagocytosis of 5-FAM-labelled-Aβ1–42 (5 μg/ml) incubated for 3 h with BV2 microglia (untransfected, control shRNA or ANXA1 shRNA transfected) in the absence or presence of hrANXA1 (5 μg/ml) and/or selective FPR2 antagonist WRW4 (5 μM) (n = 3–9). df Quantification of mRNA levels of receptors involved in receptor-mediated endocytosis in BV2 cells treated with 3 μM Aβ1–42 with or without 5 μg/ml hrANXA1 for 16 h. d RAGE (n = 6 samples). e MARCO (n = 6). f FPR rs1 (n = 6). Values shown in graphs represent the mean value ± SEM and are expressed as a percentage change in comparison to the normalized control or fold change of control. Statistical analysis included Student’s independent two-tailed t test, one-way ANOVA with Bonferroni’s multiple-comparison post-test or two-way ANOVA with Bonferroni’s multiple-comparison post-test as appropriate. *p < 0.05, **p < 0.01, ***p < 0.001, ****/§§§§ p < 0.0001
Fig. 6
Fig. 6
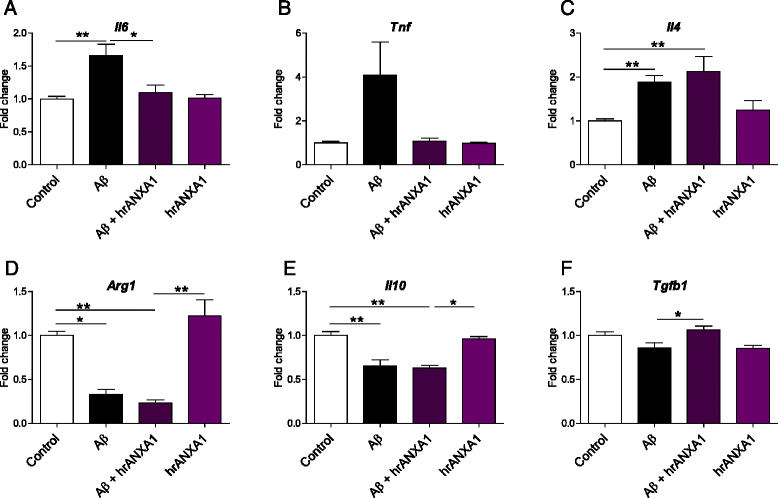
ANXA1 reduces the Aβ-induced expression of pro-inflammatory mediators in microglia. Quantification of mRNA levels of inflammatory mediators in BV2 cells treated with 3 μM Aβ1–42 with or without 5 μg/ml hrANXA1 for 16 h. a Il6 (n = 6–12 samples). b Tnf (n = 6–17). c Il4 (n = 6–9 samples). d Arg1 (n = 6–9 samples). e Il10 (n = 6–14 samples). f Tgfb1 (n = 6 samples). Values shown in graphs represent the mean value ± SEM and are expressed as fold change in comparison to the normalized control. Statistical analysis included one-way ANOVA with Bonferroni’s multiple-comparison post-test or Kruskal-Wallis test with Dunn’s multiple-comparison post-test, *p < 0.05, **p < 0.01

Similar articles

Cited by

References

    1. Haass C, Kaether C, Thinakaran G, Sisodia S. Trafficking and proteolytic processing of APP. Cold Spring Harb Perspect Med. 2012;2:a006270. doi: 10.1101/cshperspect.a006270. - DOI - PMC - PubMed
    1. Solito E, Sastre M. Microglia function in Alzheimer’s disease. Front Pharmacol. 2012;3:14. doi: 10.3389/fphar.2012.00014. - DOI - PMC - PubMed
    1. Perry VH, Teeling J. Microglia and macrophages of the central nervous system: the contribution of microglia priming and systemic inflammation to chronic neurodegeneration. Semin Immunopathol. 2013;35:601–612. doi: 10.1007/s00281-013-0382-8. - DOI - PMC - PubMed
    1. Sastre M, Klockgether T, Heneka MT. Contribution of inflammatory processes to Alzheimer’s disease: molecular mechanisms. Int J Dev Neurosci. 2006;24:167–176. doi: 10.1016/j.ijdevneu.2005.11.014. - DOI - PubMed
    1. Sastre M, Dewachter I, Landreth GE, Willson TM, Klockgether T, van Leuven F, et al. Nonsteroidal anti-inflammatory drugs and peroxisome proliferator-activated receptor-gamma agonists modulate immunostimulated processing of amyloid precursor protein through regulation of beta-secretase. J Neurosci. 2003;23:9796–9804. - PMC - PubMed

Publication types

MeSH terms

Substances