. 2016 Aug 29;8(9):1896-1922.
doi: 10.18632/aging.101022.

Analysis of the machinery and intermediates of the 5hmC-mediated DNA demethylation pathway in aging on samples from the MARK-AGE Study

Affiliations

Analysis of the machinery and intermediates of the 5hmC-mediated DNA demethylation pathway in aging on samples from the MARK-AGE Study

Elisabetta Valentini et al. Aging (Albany NY). .

Abstract

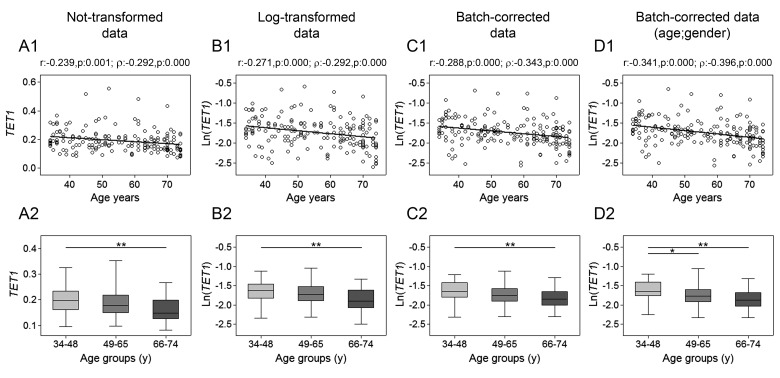
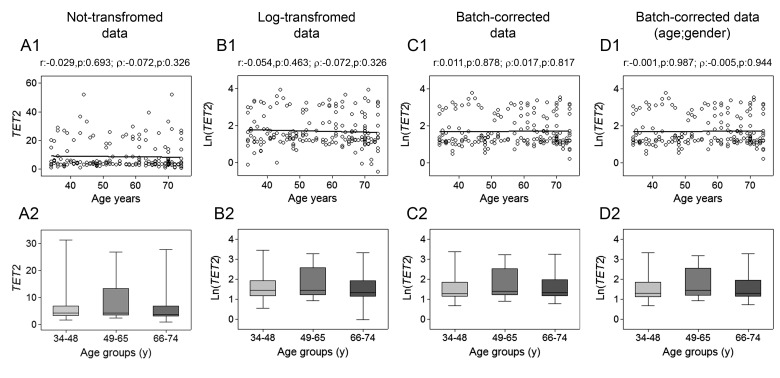
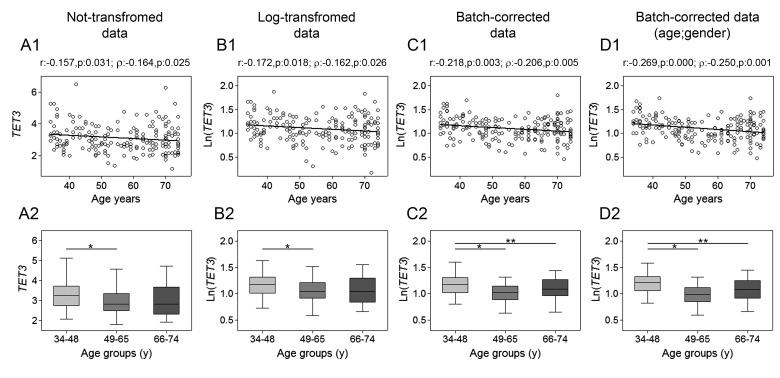
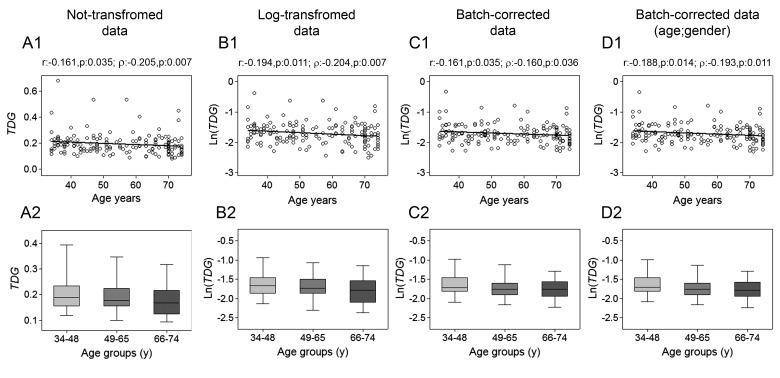
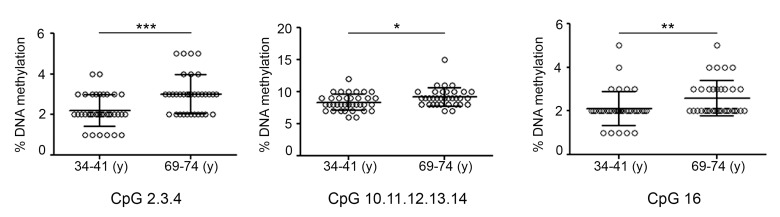
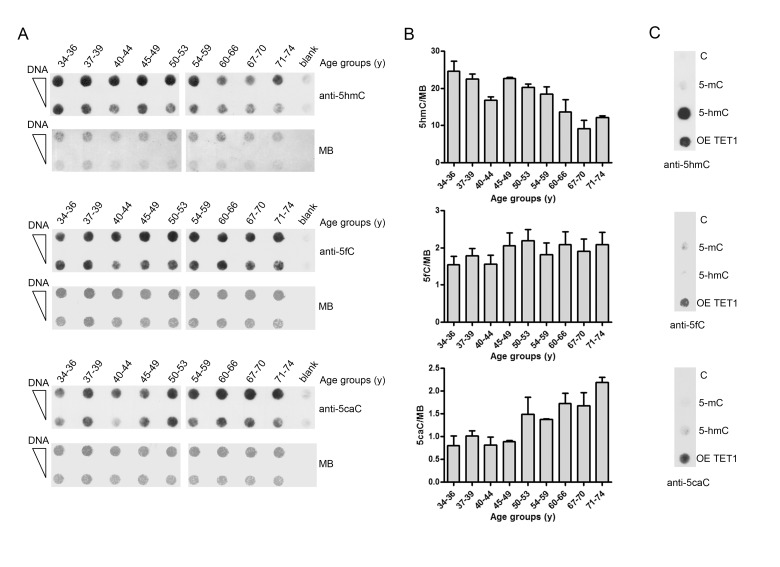
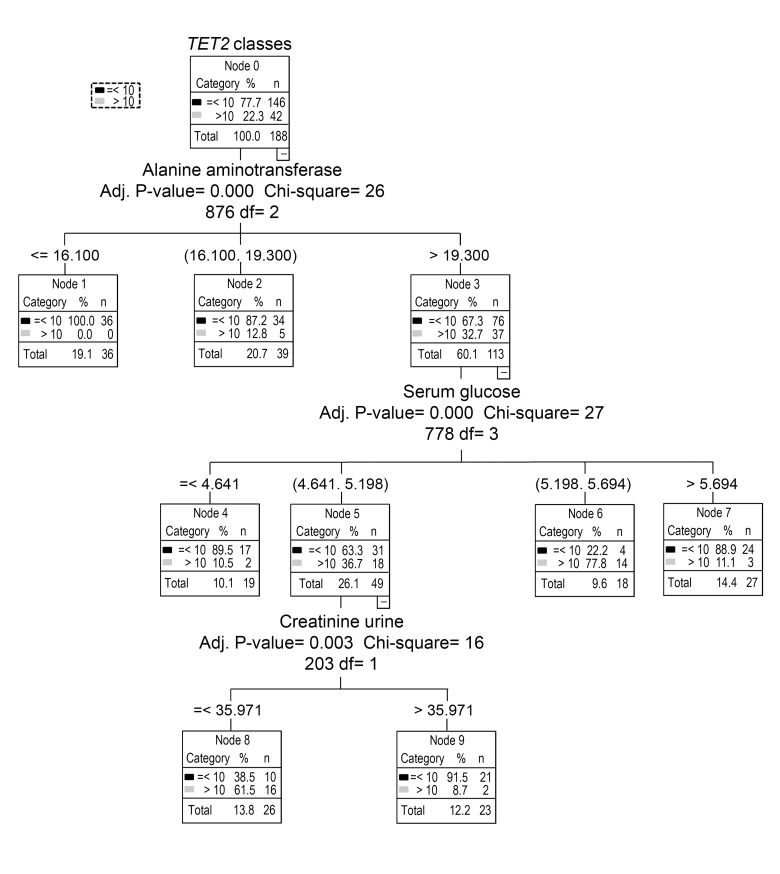
Gradual changes in the DNA methylation landscape occur throughout aging virtually in all human tissues. A widespread reduction of 5-methylcytosine (5mC), associated with highly reproducible site-specific hypermethylation, characterizes the genome in aging. Therefore, an equilibrium seems to exist between general and directional deregulating events concerning DNA methylation controllers, which may underpin the age-related epigenetic changes. In this context, 5mC-hydroxylases (TET enzymes) are new potential players. In fact, TETs catalyze the stepwise oxidation of 5mC to 5-hydroxymethylcytosine (5hmC), 5-formylcytosine (5fC) and 5-carboxylcytosine (5caC), driving the DNA demethylation process based on thymine DNA glycosylase (TDG)-mediated DNA repair pathway. The present paper reports the expression of DNA hydroxymethylation components, the levels of 5hmC and of its derivatives in peripheral blood mononuclear cells of age-stratified donors recruited in several European countries in the context of the EU Project 'MARK-AGE'. The results provide evidence for an age-related decline of TET1, TET3 and TDG gene expression along with a decrease of 5hmC and an accumulation of 5caC. These associations were independent of confounding variables, including recruitment center, gender and leukocyte composition. The observed impairment of 5hmC-mediated DNA demethylation pathway in blood cells may lead to aberrant transcriptional programs in the elderly.

Keywords: DNA hydroxymethylation; TDG; aging; genesTET.


Conflict of interest statement

All authors declare no conflict of interest.

Figures

Figure 1
Figure 1. Age-related changes of TET1 mRNA levels in PBMC
Upper panels show scatter plots representing the linear correlation between TET1 mRNA levels and age in PBMC calculated from (A1) non-transformed TET1 data, (B1) log-transformed TET1 data, (C1) batch-corrected TET1 data, (D1) batch-corrected TET1 data retaining age and gender differences. Parametric (Pearson r) and non-parametric (Spearman's ρ) correlation coefficients and statistical significance are given above each graph. Lower panels show bar graphs reporting the expression levels of TET1 gene in three different age classes calculated from (A2) non-transformed TET1 data, (B2) log-transformed TET1 data, (C2) batch-corrected TET1 data, (D2) batch-corrected TET1 data retaining age and gender differences. Boxplots show the median, the interquartile range (boxes) and the 5–95% data range (whisker caps). Comparisons between groups were performed by the Kruskal-Wallis test followed by post-hoc Bonferroni test (*P < 0.05; **P < 0.01). (y)= years.
Figure 2
Figure 2. Age-related changes of TET2 mRNA levels in PBMC
Upper panels show scatter plots representing the linear correlation between TET2 mRNA levels and age in PBMC calculated from (A1) non-transformed TET2 data, (B1) log-transformed TET2 data, (C1) batch-corrected TET2 data, (D1) batch-corrected TET2 data retaining age and gender differences. Parametric (Pearson r) and non-parametric (Spearman's ρ) correlation coefficients and statistical significance are given above each graph. Lower panels show bar graphs reporting the expression levels of TET2 gene in three different age classes calculated from (A2) non-transformed TET2 data, (B2) log-transformed TET2 data, (C2) batch-corrected TET2 data, (D2) batch-corrected TET2 data retaining age and gender differences. Boxplots show the median, the interquartile range (boxes) and the 5–95% data range (whisker caps). Comparisons between groups were performed by the Kruskal-Wallis test followed by post-hoc Bonferroni test. (y)= years.
Figure 3
Figure 3. Age-related changes of TET3 mRNA levels in PBMC
Upper panels show scatter plots representing the linear correlation between TET3 mRNA levels and age in PBMC calculated from (A1) non-transformed TET3 data, (B1) log-transformed TET3 data, (C1) batch-corrected TET3 data, (D1) batch-corrected TET3 data retaining age and gender differences. Parametric (Pearson r) and non-parametric (Spearman's ρ) correlation coefficients and statistical significance are given above each graph. Lower panels show bar graphs reporting the expression levels of TET3 gene in three different age classes calculated from (A2) non-transformed TET3 data, (B2) log-transformed TET3 data, (C2) batch-corrected TET3 data, (D2) batch-corrected TET3 data retaining age and gender differences. Boxplots show the median, the interquartile range (boxes) and the 5–95% data range (whisker caps). Comparisons between groups were performed by the Kruskal-Wallis test followed by post-hoc Bonferroni test (*P < 0.05; **P < 0.01). (y)= years.
Figure 4
Figure 4. Age-related changes of TDG mRNA levels in PBMC
Upper panels show scatter plots representing the linear correlation of between TDG mRNA levels and age in PBMC calculated from (A1) non-transformed TDG data, (B1) log-transformed TDG data, (C1) batch-corrected TDG data, (D1) batch-corrected TDG data retaining age and gender differences. Parametric (Pearson r) and non-parametric (Spearman's ρ) correlation coefficients and statistical significance are given above each graph. Lower panels show bar graphs reporting the expression levels of TDG gene in three different age classes calculated from (A2) non-transformed TDG data, (B2) log-transformed TDG data, (C2) batch-corrected TDG data, (D2) batch-corrected TDG data retaining age and gender differences. Boxplots show the median, the interquartile range (boxes) and the 5–95% data range (whisker caps). Comparisons between groups were performed by the Kruskal-Wallis test followed by post-hoc Bonferroni test. (y)= years.
Figure 5
Figure 5. DNA methylation profile of TET1 CGI in aging
Graphs represent the CpGs of TET1 CGI analyzed by the epiTYPER assay and show the difference in DNA methylation between the groups of young (34-41) and old (69-74) individuals. Statistical significance was obtained by the Mann-Whitney test (*P < 0.05; **P < 0.01; ***P < 0.001). n(34-41y)=36; n(69-74y)=34. (y)= years.
Figure 6
Figure 6. Age-related changes of 5hmC levels in PBMC
Upper panels show scatter plots representing the linear correlation of between 5hmc levels and age in PBMC calculated from (A1) non-transformed 5hmC data, (B1) log-transformed 5hmC data, (C1) batch-corrected 5hmC data, (D1) batch-corrected 5hmC data retaining age and gender differences. Parametric (Pearson r) and non-parametric (Spearman's ρ) correlation coefficients and statistical significance are given above each graph. Lower panels show bar graphs reporting the levels of 5hmC in three different age classes calculated from (A2) non-transformed 5HMC data, (B2) log-transformed 5hmC data, (C2) batch-corrected 5hmC data, (D2) batch-corrected 5hmC data retaining age and gender differences. Boxplots show the median, the interquartile range (boxes) and the 5–95% data range (whisker caps). Comparisons between groups were performed by the Kruskal-Wallis test followed by the post-hoc Bonferroni test (*P < 0.05; **P < 0.01). (E) Representative dot blot performed on DNA from 20 individuals by using anti-5hmC antibody and methylene blue (MB) staining to control DNA loading. (y)= years.
Figure 7
Figure 7. Age-related changes of 5hmC, 5fC and 5caC levels in PBMC
(A) The graph shows the amount of 5hmC, 5fC and 5caC determined by dot-blot assay on pooled DNA samples obtained by grouping individuals into nine different age classes. n(34-36y)=16; n(37-39y)=17 ; n(40-44y)=16; n(45-49y)=22; n(50-53y)=16; n(54-59y)=16; n(60-66y)=31; n(67-70y)=27; n(71-74y)=27. Analysis was performed with 5hmC, 5fC and 5caC specific antibodies. Methylene blue (MB) staining was used to monitor DNA loading. (B) Bar graphs show the densitometric quantification of 5hmC, 5fC and 5caC signal after normalization for loading by MB staining, shown as mean ± S.E.M. of three different technical replicates. (C) Linear dsDNA containing unmodified (C), full methylated (5mC) or hydroxymethylated (5hmC) cytosines were used as specificity control of the anti-5hmC antibody. DNA derived from HEK293T overexpressing TET1 catalytic domain (OE TET1) was used as positive control for anti-5fC and anti-5caC antibodies. (y)= years.
Figure 8
Figure 8. Identification of major variables that affect TET2 expression by decision tree analysis
Decision tree analysis was performed to identify potential variables responsible of TET2 gene bimodal distribution. Apart from demographic characteristics, several clinical biochemistry parameters were included.

Similar articles

Cited by

References

    1. Jones PA. Functions of DNA methylation: islands, start sites, gene bodies and beyond. Nat Rev Genet. 2012;13:484–92. doi: 10.1038/nrg3230. - DOI - PubMed
    1. Lowe R, Overhoff MG, Ramagopalan SV, Garbe JC, Koh J, Stampfer MR, Beach DH, Rakyan VK, Bishop CL. The senescent methylome and its relationship with cancer, ageing and germline genetic variation in humans. Genome Biol. 2015;16:194. doi: 10.1186/s13059-015-0748-4. - DOI - PMC - PubMed
    1. Seisenberger S, Peat JR, Hore TA, Santos F, Dean W, Reik W. Reprogramming DNA methylation in the mammalian life cycle: building and breaking epigenetic barriers. Philos Trans R Soc Lond B Biol Sci. 2013;368:20110330. doi: 10.1098/rstb.2011.0330. - DOI - PMC - PubMed
    1. Horvath S. DNA methylation age of human tissues and cell types. Genome Biol. 2013;14:R115. doi: 10.1186/gb-2013-14-10-r115. - DOI - PMC - PubMed
    1. Bradley-Whitman MA, Lovell MA. Epigenetic changes in the progression of Alzheimer's disease. Mech Ageing Dev. 2013;134:486–95. doi: 10.1016/j.mad.2013.08.005. - DOI - PMC - PubMed

Publication types