

Rational Design of a Parthenolide-based Drug Regimen That Selectively Eradicates Acute Myelogenous Leukemia Stem Cells
- PMID: 27573247
- PMCID: PMC5063982
- DOI: 10.1074/jbc.M116.750653
Rational Design of a Parthenolide-based Drug Regimen That Selectively Eradicates Acute Myelogenous Leukemia Stem Cells
Erratum in
-
Rational design of a parthenolide-based drug regimen that selectively eradicates acute myelogenous leukemia stem cells.J Biol Chem. 2016 Nov 25;291(48):25280. doi: 10.1074/jbc.A116.750653. J Biol Chem. 2016. PMID: 27888238 Free PMC article. No abstract available.
Abstract
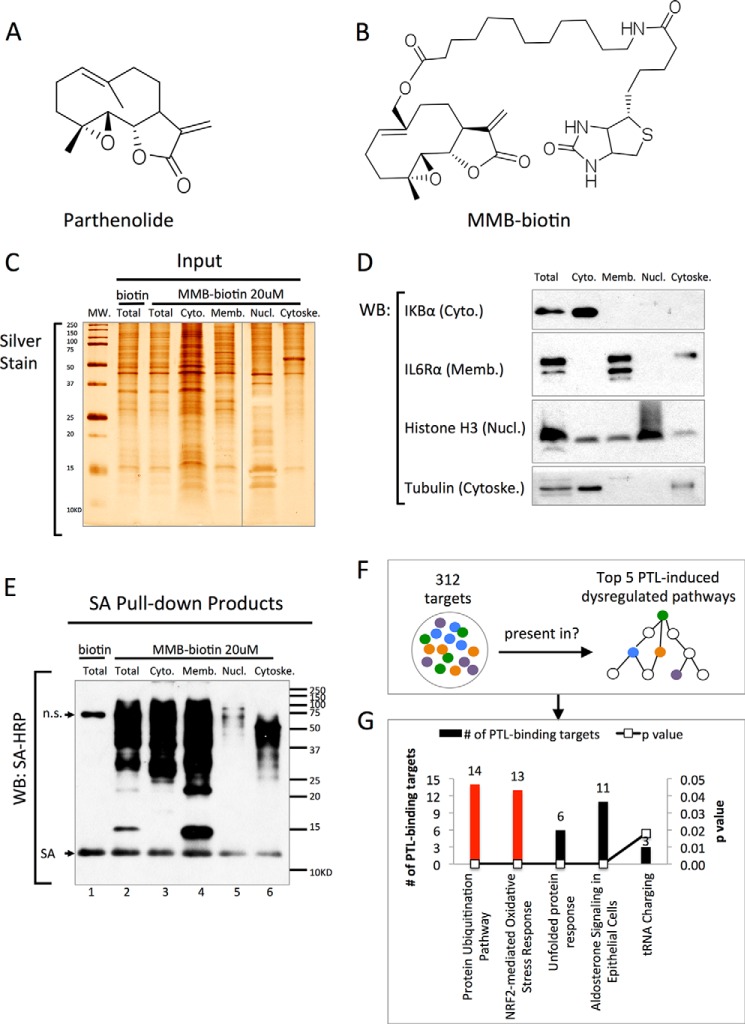
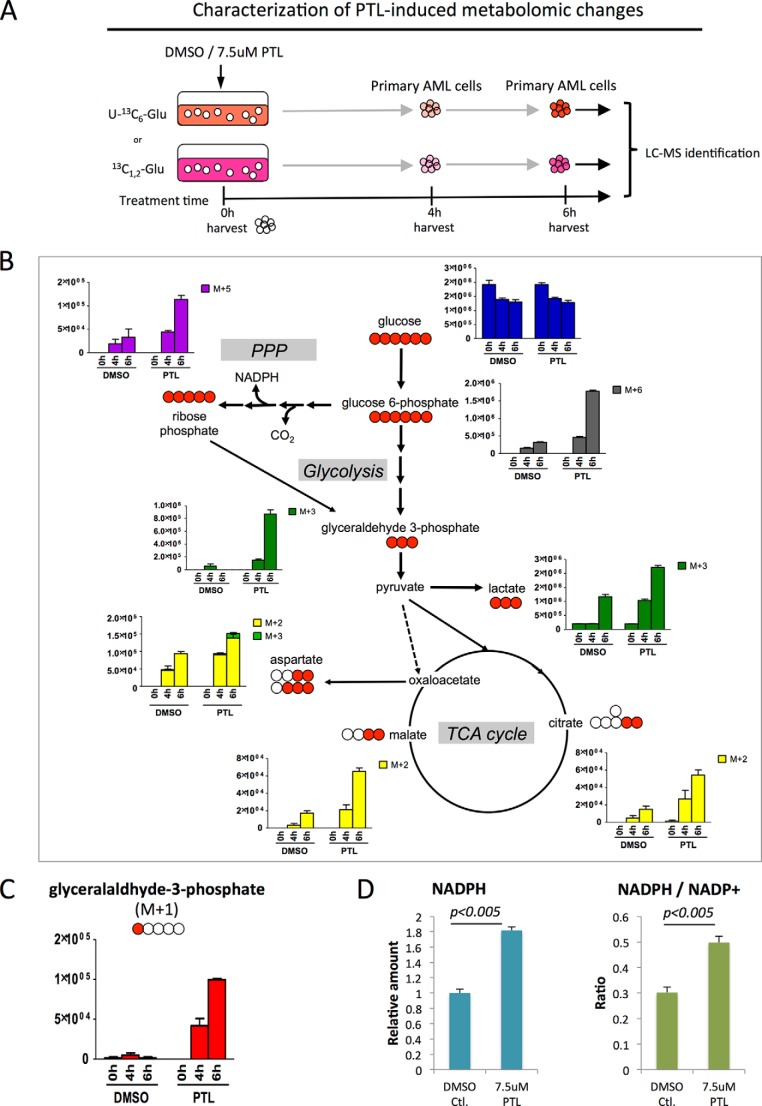
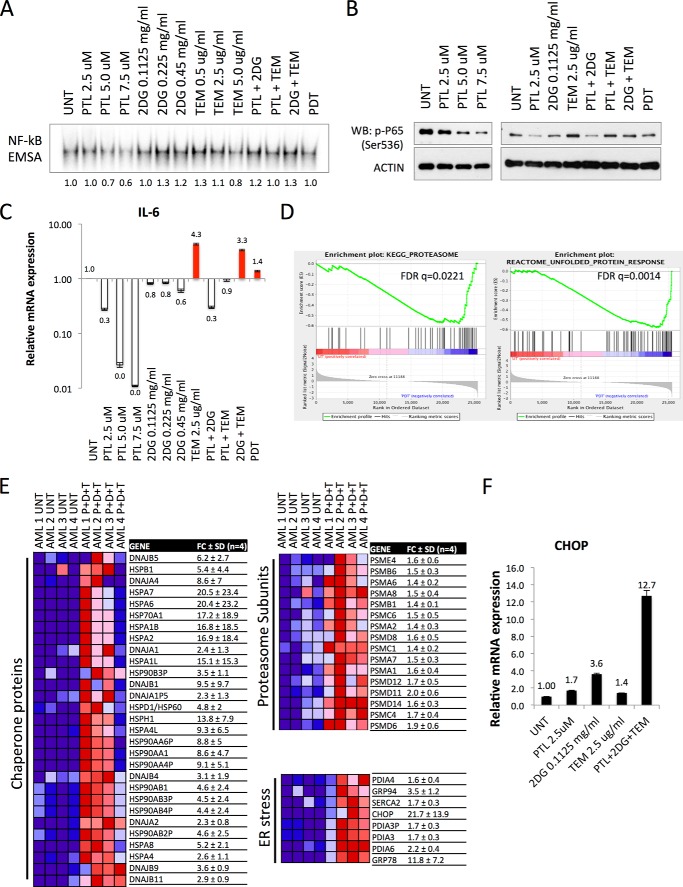
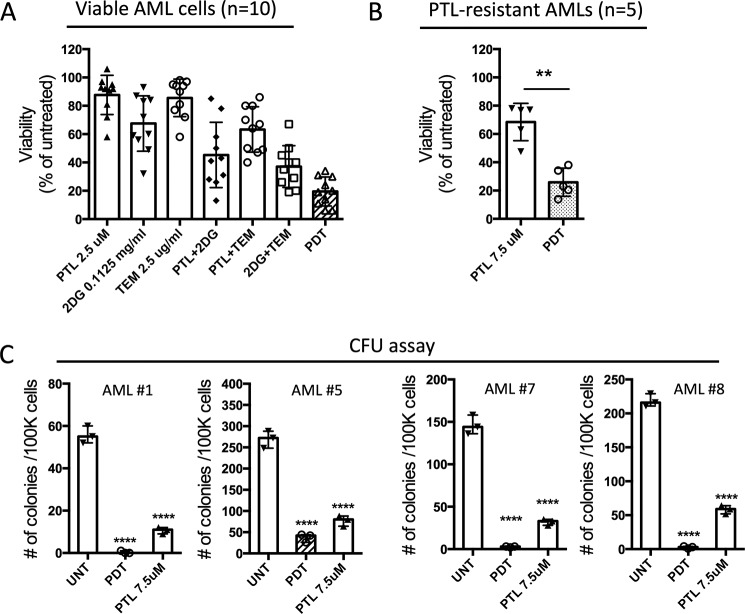
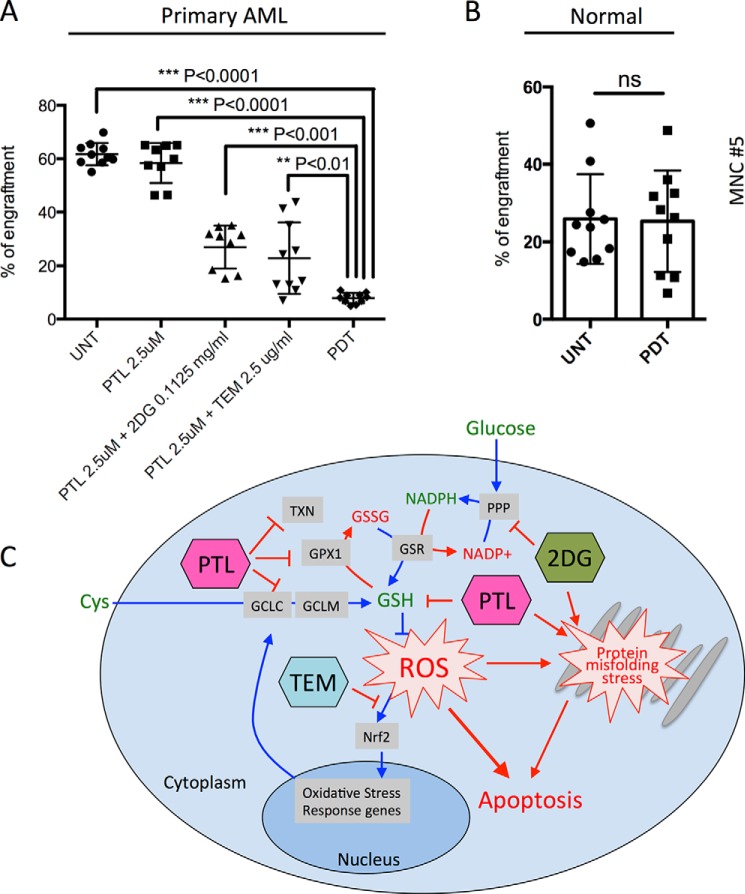
Although multidrug approaches to cancer therapy are common, few strategies are based on rigorous scientific principles. Rather, drug combinations are largely dictated by empirical or clinical parameters. In the present study we developed a strategy for rational design of a regimen that selectively targets human acute myelogenous leukemia (AML) stem cells. As a starting point, we used parthenolide, an agent shown to target critical mechanisms of redox balance in primary AML cells. Next, using proteomic, genomic, and metabolomic methods, we determined that treatment with parthenolide leads to induction of compensatory mechanisms that include up-regulated NADPH production via the pentose phosphate pathway as well as activation of the Nrf2-mediated oxidative stress response pathway. Using this knowledge we identified 2-deoxyglucose and temsirolimus as agents that can be added to a parthenolide regimen as a means to inhibit such compensatory events and thereby further enhance eradication of AML cells. We demonstrate that the parthenolide, 2-deoxyglucose, temsirolimus (termed PDT) regimen is a potent means of targeting AML stem cells but has little to no effect on normal stem cells. Taken together our findings illustrate a comprehensive approach to designing combination anticancer drug regimens.
Keywords: 2-deoxyglucose; anticancer drug; drug combination; drug development; drug resistance; endoplasmic reticulum stress (ER stress); leukemia; oxidative stress; parthenolide; temsirolimus.
© 2016 by The American Society for Biochemistry and Molecular Biology, Inc.
Figures


Similar articles
-
Disulfiram/copper selectively eradicates AML leukemia stem cells in vitro and in vivo by simultaneous induction of ROS-JNK and inhibition of NF-κB and Nrf2.Cell Death Dis. 2017 May 18;8(5):e2797. doi: 10.1038/cddis.2017.176. Cell Death Dis. 2017. PMID: 28518151 Free PMC article.
-
The NF (Nuclear factor)-κB inhibitor parthenolide interacts with histone deacetylase inhibitors to induce MKK7/JNK1-dependent apoptosis in human acute myeloid leukaemia cells.Br J Haematol. 2010 Oct;151(1):70-83. doi: 10.1111/j.1365-2141.2010.08319.x. Epub 2010 Aug 2. Br J Haematol. 2010. PMID: 20701602 Free PMC article.
-
Targeting aberrant glutathione metabolism to eradicate human acute myelogenous leukemia cells.J Biol Chem. 2013 Nov 22;288(47):33542-33558. doi: 10.1074/jbc.M113.511170. Epub 2013 Oct 2. J Biol Chem. 2013. PMID: 24089526 Free PMC article. Clinical Trial.
-
Role of SIRT1 in the growth and regulation of normal hematopoietic and leukemia stem cells.Curr Opin Hematol. 2015 Jul;22(4):324-9. doi: 10.1097/MOH.0000000000000152. Curr Opin Hematol. 2015. PMID: 26049753 Free PMC article. Review.
-
Concise review: Leukemia stem cells in personalized medicine.Stem Cells. 2014 Apr;32(4):844-51. doi: 10.1002/stem.1597. Stem Cells. 2014. PMID: 24214290 Free PMC article. Review.
Cited by
-
Characterization and targeting of malignant stem cells in patients with advanced myelodysplastic syndromes.Nat Commun. 2018 Sep 12;9(1):3694. doi: 10.1038/s41467-018-05984-x. Nat Commun. 2018. PMID: 30209285 Free PMC article.
-
Comprehensive Structure-Activity Profiling of Micheliolide and its Targeted Proteome in Leukemia Cells via Probe-Guided Late-Stage C-H Functionalization.ACS Cent Sci. 2021 May 26;7(5):841-857. doi: 10.1021/acscentsci.0c01624. Epub 2021 Apr 28. ACS Cent Sci. 2021. PMID: 34079900 Free PMC article.
-
Metabolic underpinnings of leukemia pathology and treatment.Cancer Rep (Hoboken). 2019 Apr;2(2):e1139. doi: 10.1002/cnr2.1139. Epub 2018 Oct 7. Cancer Rep (Hoboken). 2019. PMID: 32721091 Free PMC article. Review.
-
Targeting Mitochondrial Oxidative Phosphorylation Eradicates Acute Myeloid Leukemic Stem Cells.Front Oncol. 2022 Apr 29;12:899502. doi: 10.3389/fonc.2022.899502. eCollection 2022. Front Oncol. 2022. PMID: 35574326 Free PMC article.
-
Parthenolide as Cooperating Agent for Anti-Cancer Treatment of Various Malignancies.Pharmaceuticals (Basel). 2020 Aug 14;13(8):194. doi: 10.3390/ph13080194. Pharmaceuticals (Basel). 2020. PMID: 32823992 Free PMC article. Review.
References
MeSH terms
Substances
Grants and funding
LinkOut - more resources
Full Text Sources
Other Literature Sources
Medical
Research Materials
