. 2016 Aug 29;11(8):e0160834.
doi: 10.1371/journal.pone.0160834. eCollection 2016.

Statistical Techniques Complement UML When Developing Domain Models of Complex Dynamical Biosystems

Affiliations

Statistical Techniques Complement UML When Developing Domain Models of Complex Dynamical Biosystems

Richard A Williams et al. PLoS One. .

Abstract

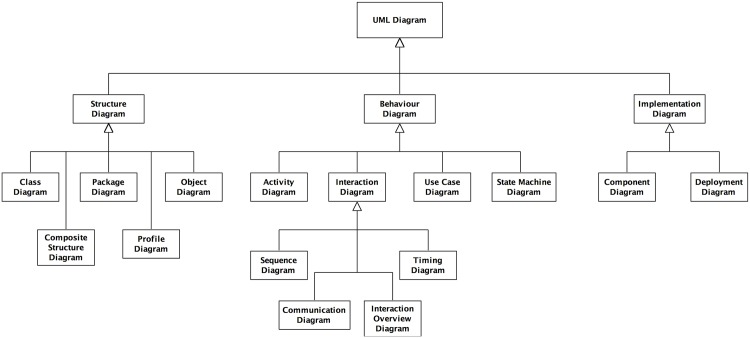
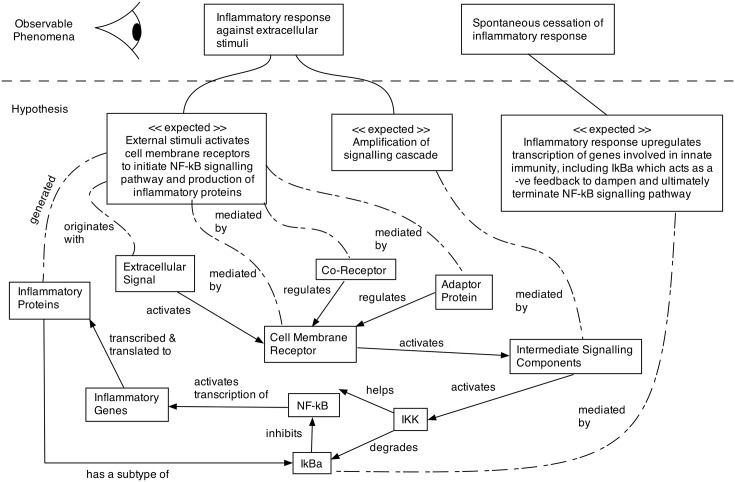
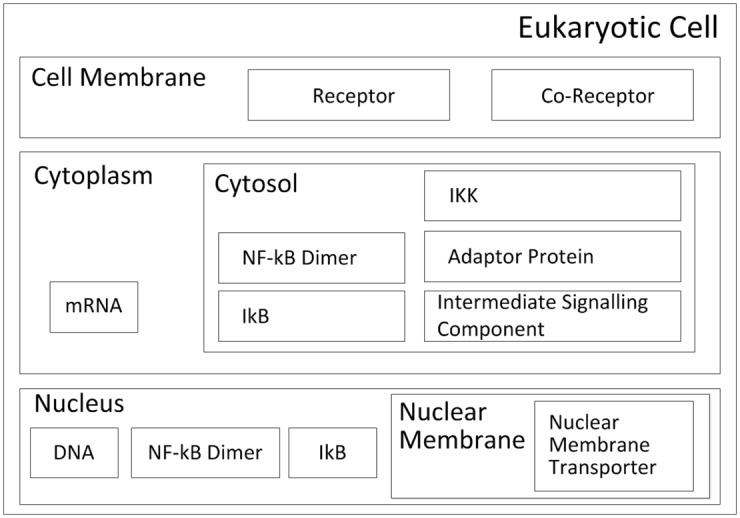
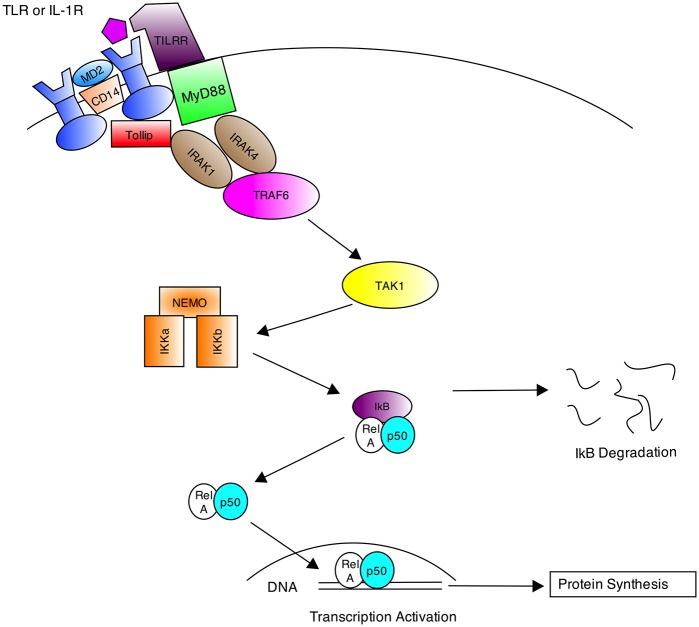
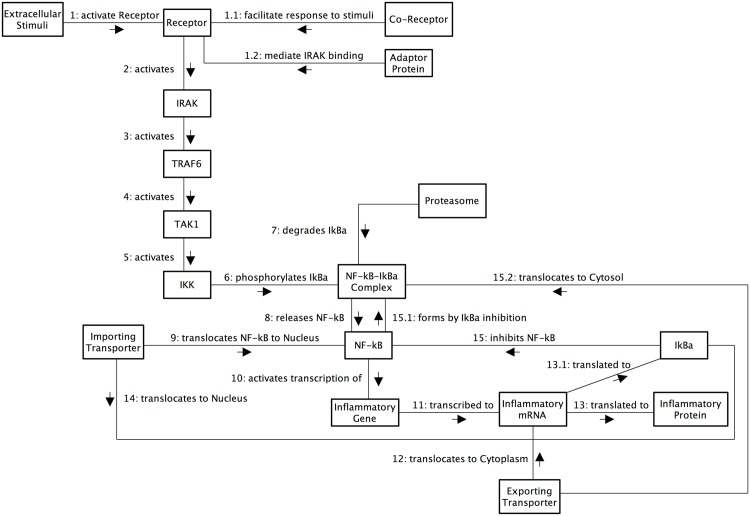
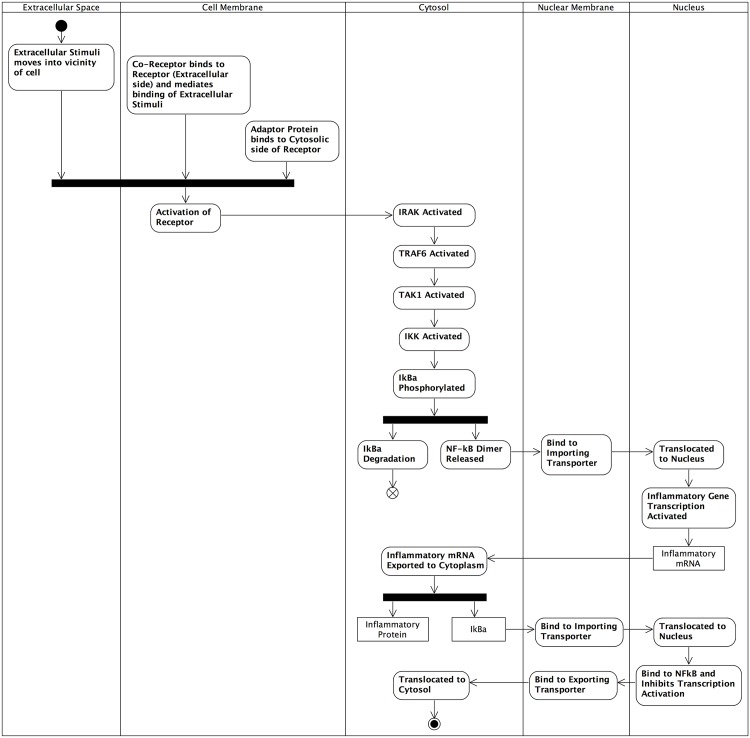
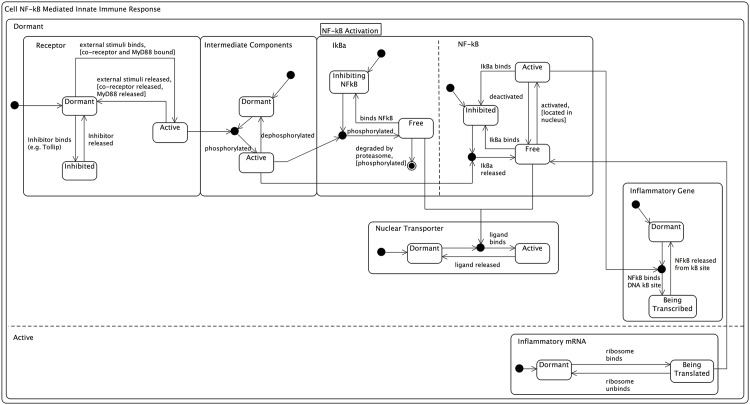
Computational modelling and simulation is increasingly being used to complement traditional wet-lab techniques when investigating the mechanistic behaviours of complex biological systems. In order to ensure computational models are fit for purpose, it is essential that the abstracted view of biology captured in the computational model, is clearly and unambiguously defined within a conceptual model of the biological domain (a domain model), that acts to accurately represent the biological system and to document the functional requirements for the resultant computational model. We present a domain model of the IL-1 stimulated NF-κB signalling pathway, which unambiguously defines the spatial, temporal and stochastic requirements for our future computational model. Through the development of this model, we observe that, in isolation, UML is not sufficient for the purpose of creating a domain model, and that a number of descriptive and multivariate statistical techniques provide complementary perspectives, in particular when modelling the heterogeneity of dynamics at the single-cell level. We believe this approach of using UML to define the structure and interactions within a complex system, along with statistics to define the stochastic and dynamic nature of complex systems, is crucial for ensuring that conceptual models of complex dynamical biosystems, which are developed using UML, are fit for purpose, and unambiguously define the functional requirements for the resultant computational model.


Conflict of interest statement

The authors of this manuscript have read the journal’s policy and have the following competing interests: JT is Director of SimOmics Ltd. This does not alter the authors’ adherence to PLOS ONE policies on sharing data and materials.

Figures

Fig 1
Fig 1. The CoSMoS Process.
The CoSMoS process advocates an iterative lifecycle, consisting of three separate phases (discovery, development and exploration), and creation of four key project artefacts (domain model, platform model, simulation platform, and results model). The discovery phase focuses on formulation of the problems to be investigated through use of the computational model, resulting in creation of a functional specification of the required biological behaviour to be simulated (domain model). The development phase focuses on transforming the domain model into a technical specification (platform model) specific to the programming language(s) and computer architectures to be used, and actual development of the computational model (simulation platform), including calibration, validation and verification. The exploration phase focuses on the in silico experimentation to investigate the biological problems of interest, and the generation of predictions (documented in the results model), which facilitate the generation of novel hypotheses for subsequent testing in the biological arena.
Fig 2
Fig 2. Taxonomy of UML diagramming notations.
Structure diagrams show the static structure of the components within a system, and comprise: Class, Composite Structure, Package, Profile and Object diagrams. Behaviour diagrams show the dynamic behaviour of the components within a system, and comprise: Activity, Sequence, Communication, State Machine, Use Case, Interaction Overview, and Timing diagrams. Finally, implementation diagrams comprise Component and Deployment diagrams (after [10]).
Fig 3
Fig 3. Expected behaviours diagram.
Expected behaviours diagram depicting the observable phenomena of the IL-1 stimulated NF-κB signalling pathway; the behaviours that are hypothesised to be responsible for these phenomena; and at an abstracted level the components of the complex system that are believed to be responsible for the development of these emergent behaviours. At the highest level of the system, activation of the NF-κB pathway initiates a transitory inflammatory response (the system dynamics automatically cease the response). It is hypothesised (expected) that these phenomena occur through interaction of three functional modules that relate to activation of cell membrane receptors, amplification of the signalling cascade, and upregulation of transcription. Developed from the reviews of [–39].
Fig 4
Fig 4. Cartoon-like containment diagram.
Cartoon-like containment diagram showing the physical containment of the components involved in the IL-1 stimulated NF-κB signalling pathway and the physical environment in which they are situated within a Eukaryotic cell. We believe that this is a much more intuitive way of representing physical containment than the corresponding UML class containment diagram (not shown). Developed from [42].
Fig 5
Fig 5. Histogram of control observations.
Histrogram of control observations from the dataset of [31], that have been binned (grouped) using an integer interval of initial (time 0 min) fluorescence. The superimposed line represents a Negative Binomial distribution, using the median calculated from the raw data. The median average has been calculated as 1.947153.
Fig 6
Fig 6. Histogram of IL-1 stimulated observations.
Histogram of IL-1 stimulated observations from the dataset of [31], that have been binned (grouped) using an integer interval of initial (time 0 min) fluorescence. The superimposed line represents a Negative Binomial distribution, using the median calculated from the raw data. The median average has been calculated as 1.729876.
Fig 7
Fig 7. Graph of median average fluorescence.
Graph of median average fluorescence for control (No IL-1) and IL-1 stimulated observations from [31]. The data has been transformed so that each cell has become its own control. The error bars illustrate the spread of observations between the 25th and 75th percentiles.
Fig 8
Fig 8. PCA plot of principal components 1 and 2.
PCA plot of principal components 1 and 2, colour-coded by observation category, i.e. control versus IL-1 stimulated and range of initial cytoplasmic fluorescence. The six categories are: IL-1 stimulated/0-1.5 = Blue, IL-1 stimulated/1.5-3.0 = Red, IL-1 stimulated/>3.0 = Black, control/0-1.5 = Yellow, control/1.5-3.0 = Green, and control/>3.0 = Purple. The plot shows separation of observations with initial fluorescence < 1.5 units from the rest of the data, with partial separation between the control and IL-1 stimulated observations within this group. There is also a limited degree of separation between observations with initial fluorescence values of 1.5-3.0 units from the rest of the data, however the amount of overlap between control and IL-1 stimulated is more significant here.
Fig 9
Fig 9. Cartoon diagram of high-level interactions.
Simplified cartoon diagram depicting the high-level interactions between the TLR or IL-1R superfamily of receptors, the co-receptors and adaptor proteins, and the protein kinases within the NF-κB canonical signalling pathway. Diagram developed from findings of [–55].
Fig 10
Fig 10. UML communication diagram.
UML communication diagram for the IL-1 stimulated NF-κB signalling pathway. Although portraying temporal interactions as per sequence diagrams (not shown), we believe that these diagrams are more intuitive for non-Computer Science audiences as they are more flexible in relation to the position of system components, thus allowing the positioning of components to approximate to the spatial locations within a Eukaryotic cell. Developed from reviews of [56, 57].
Fig 11
Fig 11. UML activity diagram.
Full end-to-end UML activity diagram for the IL-1 stimulated NF-κB signalling pathway using the concept of swim-lanes to convey sub-cellular location of components. Developed from [39, 56, 57].
Fig 12
Fig 12. Linked state machine diagrams.
Linked series of state machine diagrams for the IL-1 stimulated NF-κB signalling pathway. The individual components have their own state machines, which are explicitly linked using UML join notations and embedded within a single large state machine that represents the cell. Here the cell has two states relating to dormant or active. Developed using [, , , , –68].

Similar articles

Cited by

References

    1. Kitano H (2002) Computational Systems Biology. Nature 420: 206–210. 10.1038/nature01254 - DOI - PubMed
    1. Kitano H (2002) Systems biology: A brief overview. Science 295: 1662–1664. 10.1126/science.1069492 - DOI - PubMed
    1. Kitano H (2004) Biological robustness. Nature Reviews Genetics 5: 826–837. 10.1038/nrg1471 - DOI - PubMed
    1. Alden K, Timmis J, Andrews PS, Veiga-Fernandes H, Coles M (2012) Pairing experimentation and computational modelling to understand the role of tissue inducer cells in the development of lymphoid organs. Frontiers in Inflammation 3: 172. - PMC - PubMed
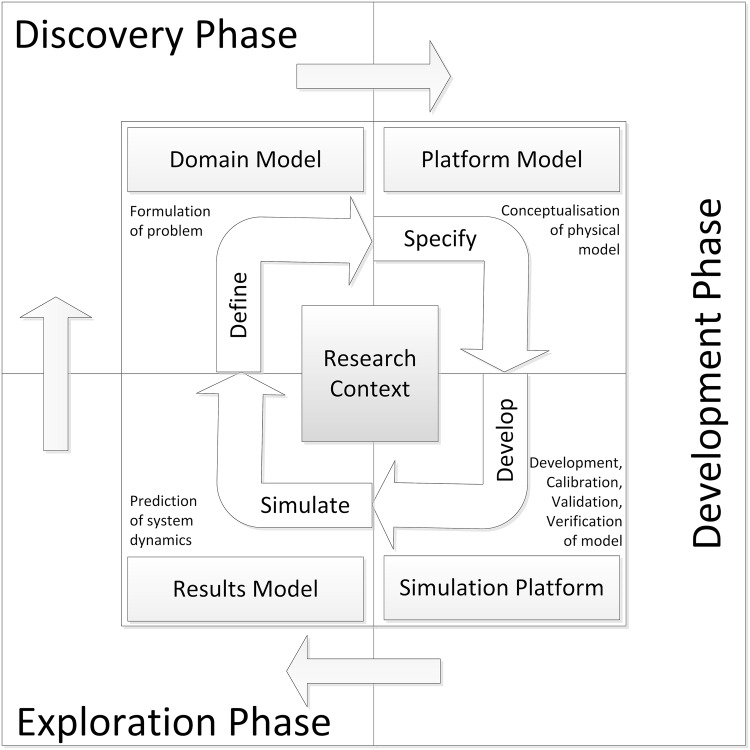
    1. Andrews PS, Polack FAC, Sampson AT, Stepney S, Timmis J (2010) The CoSMoS process, version 0.1: A process for the modelling and simulation of complex systems. Tech. Rep. YCS-2010-453, University of York