. 2016 Oct 11;7(41):66754-66768.
doi: 10.18632/oncotarget.11479.

Wnt activation followed by Notch inhibition promotes mitotic hair cell regeneration in the postnatal mouse cochlea

Affiliations

Wnt activation followed by Notch inhibition promotes mitotic hair cell regeneration in the postnatal mouse cochlea

Wenli Ni et al. Oncotarget. .

Abstract

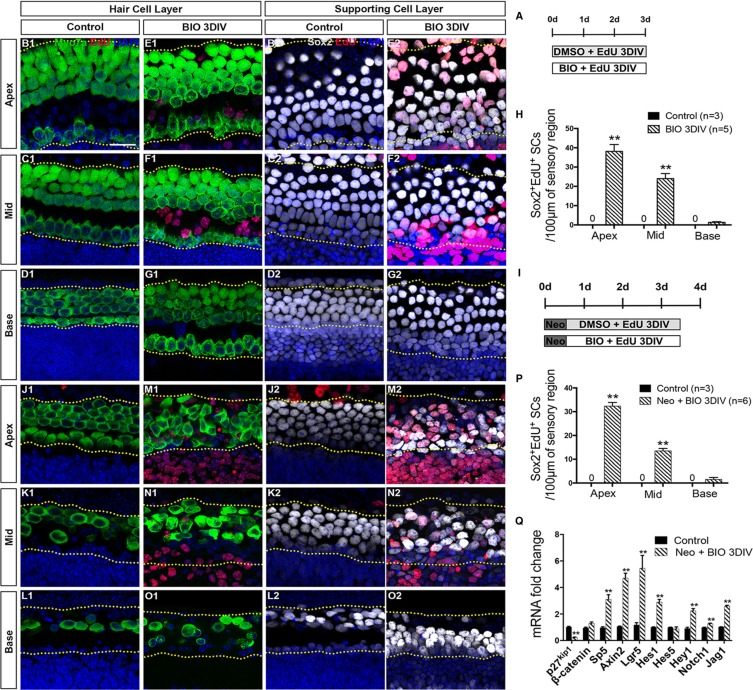
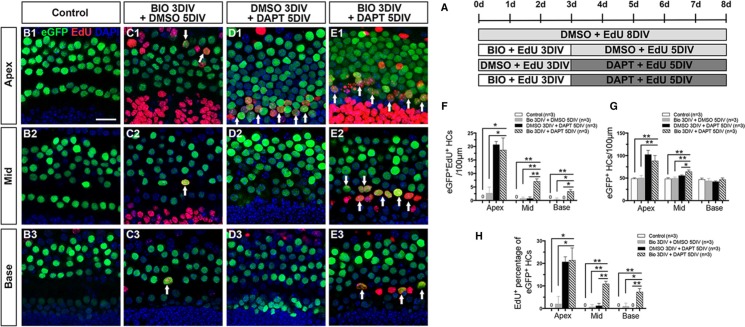
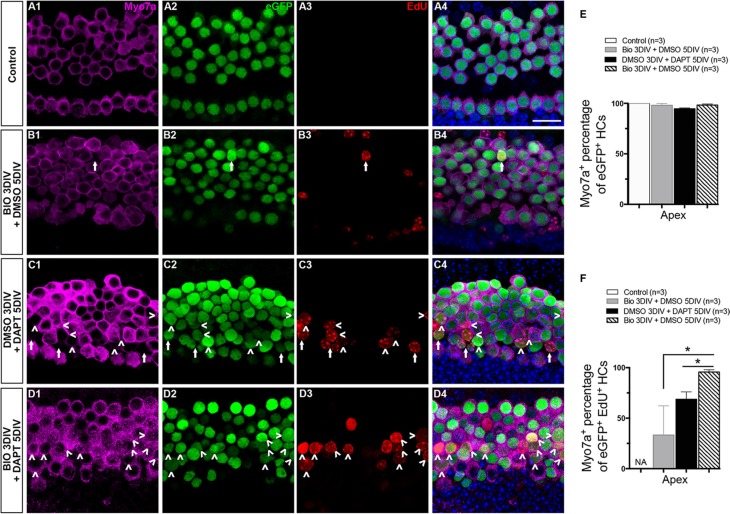
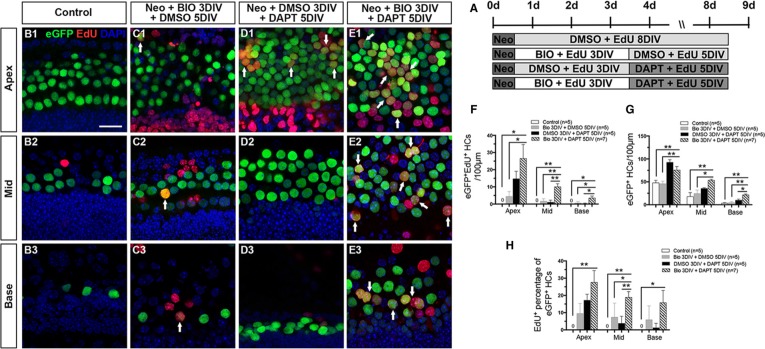
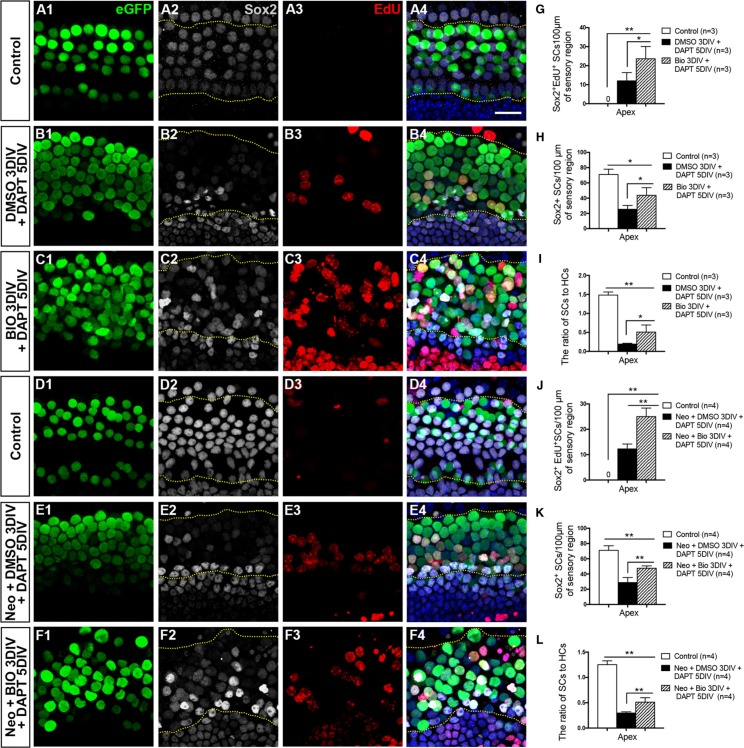
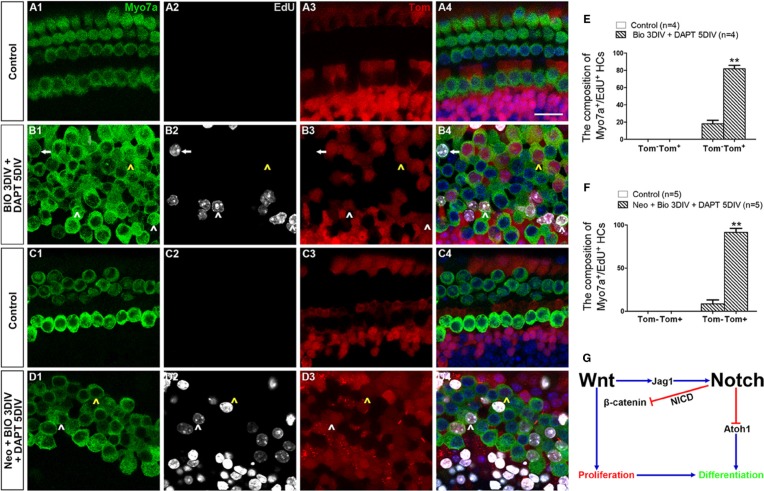
Hair cell (HC) loss is the main cause of permanent hearing loss in mammals. Previous studies have reported that in neonatal mice cochleae, Wnt activation promotes supporting cell (SC) proliferation and Notch inhibition promotes the trans-differentiation of SCs into HCs. However, Wnt activation alone fails to regenerate significant amounts of new HCs, Notch inhibition alone regenerates the HCs at the cost of exhausting the SC population, which leads to the death of the newly regenerated HCs. Mitotic HC regeneration might preserve the SC number while regenerating the HCs, which could be a better approach for long-term HC regeneration. We present a two-step gene manipulation, Wnt activation followed by Notch inhibition, to accomplish mitotic regeneration of HCs while partially preserving the SC number. We show that Wnt activation followed by Notch inhibition strongly promotes the mitotic regeneration of new HCs in both normal and neomycin-damaged cochleae while partially preserving the SC number. Lineage tracing shows that the majority of the mitotically regenerated HCs are derived specifically from the Lgr5+ progenitors with or without HC damage. Our findings suggest that the co-regulation of Wnt and Notch signaling might provide a better approach to mitotically regenerate HCs from Lgr5+ progenitor cells.

Keywords: Notch; Wnt; lineage tracing; proliferation; regeneration.


Conflict of interest statement

CONFLICTS OF INTEREST

The authors declare no potential conflicts of interest.

Figures

Figure 1
Figure 1. Wnt/β-catenin signaling activation induced proliferation of SCs
(A) Cochleae were cultured in DMEM/F12 media with 1 mM EdU and 5 μM BIO or 0.5% DMSO for 3 days. (BG) Confocal slices from the apex, middle, and base of neonatal organ of Corti explants cultured without neomycin administration. The dotted lines in B–D and E–G showed the counting limits of SCs in the sensory cell region, which includes three rows of Deiters′ cells and inner and outer pillar cells. No Myo7a+ (green)/EdU+ (red) cells or Sox2+ (gray)/EdU+ (red) cells were observed in the DMSO-treated cochleae from the apex to the base (Myo7a B1–D1, Sox2 B2-D2). No Myo7a+/EdU+ cells were observed in the BIO-treated cochleae (E1–G1). Conversely, significant proliferation (Sox2+/EdU+ cells) was observed in the SC layer in BIO-treated cochleae (E2–G2). DAPI shows the nuclei in blue, and the scale bar is 20 μm. (H) The number of Sox2+/EdU+ cells per 100 μm in the sensory region from the apex to the base of the normal cochleae. (I) Cochleae were cultured in DMEM/F12 media with 0.5 mM neomycin overnight at P1, then with 1 mM EdU and 5 μM BIO or 0.5% DMSO for 3 days. (JO) Confocal slices from the apex, middle, and base of injured neonatal organ of Corti explants cultured with neomycin. The dotted lines in J–L and M–O showed the counting limits of SCs in the sensory cell region consistent with the uninjured cochleae. No Myo7a+ (green)/EdU+(red) cells or Sox2+ (gray)/EdU+ (red) cells were observed in DMSO-treated cochleae from the apex to the base (Myo7a J1–L1, Sox2 J2–L2), while significantly more Sox2+/EdU+ cells were observed in the BIO-treated group especially in the apex and middle of the cochleae (M2, N2). No Myo7a+/EdU+ cells were observed in the BIO-treated cochleae (M1–O1). DAPI shows the nuclei in blue, and the scale bar is the same as B1. (P) The number of Sox2+/EdU+ cells per 100 μm in the sensory region from the apex to the base of the injured cochleae. (Q) Quantitative RT-PCR results of the mRNA expression changes of Wnt and Notch signaling. Data in G and P are presented as mean ± SEM per 100 μm; **p < 0.01, unpaired Student's t-tests (two-tailed), see also Supplementary Table S1.
Figure 2
Figure 2. Notch signaling inhibition after Wnt/β-catenin signaling activation increased the number of HCs
(A) Cochleae of Atoh1-eGFP mice were dissected at P1 for further treatment. In the trial group, 50 μM DAPT (a γ-secretase inhibitor) was added to the culture media for 5 days after BIO treatment. BIO and DAPT were replaced with DMSO in the controls. (BE) All Atoh1+ cells were marked by eGFP (green), and EdU (red) was added to the culture media to capture proliferating cells. No eGFP+/EdU+ cells were observed in the cochleae of the DMSO-treated group (B1–B3). Few eGFP+/EdU+ cells were observed in the apex of the BIO-DMSO group (C1, arrows). Numerous eGFP+/EdU+ cells were seen in the apex of the DMSO-DAPT group (D1, arrows). The number of double-positive cells decreased progressively from the apex to the base in the cochleae from the BIO-DAPT group (E1-E3, arrows). DAPI shows the nuclei in blue, and the scale bar is 20 μm. (F) The number of eGFP+/EdU+ cells per 100 μm from the apex to the base of normal cochleae. (G) The number of eGFP+ cells per 100 μm from the apex to the base of normal cochleae. (H) The percentage (%) of EdU+ cells of the total eGFP+ cells in the normal cochleae. Data in F-H are presented as mean ± SEM per 100 μm; *p < 0.05, **p < 0.01, unpaired Student's t-tests (two-tailed), see also Supplementary Table S2.
Figure 3
Figure 3. The maturation of mitotically regenerated HCs
(AD) To determine whether the newly generated eGFP+ cells were mature HCs, cochleae were stained with antibodies against Myo7a. All images are from the apex of the injured cochleae. In the control group, all HCs were co-marked by both eGFP+ (green) and Myo7a+ (magenta) (A4). The situation was nearly the same in the BIO-DMSO group except for the occasional appearance of an eGFP+/EdU+ cell (green and red, B4). Numerous eGFP+ cells without Myo7a expression were seen in the DMSO-DAPT group, and many of these were eGFP+/EdU+ cells (C1–C4). Most of the eGFP+ cells and eGFP+/EdU+ cells in the BIO-DAPT group were co-marked by Myo7a (D1–D4). Arrows show Myo7a-/eGFP+/EdU+ cells and arrowheads show Myo7a+/eGFP+/EdU+ cells. DAPI shows the nuclei in blue, and the scale bar is 20 μm. (EF) Graphs E and F show the percentages of Myo7a+ cells in eGFP+ cells and EdU+/eGFP+ cells, respectively, in the apex of the cochleae. Data are represented as mean ± SEM; *p < 0.05, unpaired Student's t-tests (two-tailed), see also Supplementary Table S3.
Figure 4
Figure 4. Wnt/β-catenin signaling activation followed by Notch signaling inhibition increased HC regeneration in neonatal mouse cochleae after damage
(A) Cochleae of Atoh1-eGFP+ mice were cultured in DMEM/F12 media with 0.5 mM neomycin overnight at P1, then with 1 mM EdU and 5 μM BIO or 0.5% DMSO for 3 days followed by 50 μM DAPT or 0.5% DMSO for 5 more days. (BE) Consistent with the results in the normal neonatal cochleae, no eGFP+/EdU+ cells were observed in the DMSO-treated group (green and red, B1–B3), and very few eGFP+/EdU+ cells were observed in the BIO-DMSO group (C1–C3, arrows). Several eGFP+/EdU+ cells were observed in the apex of the DMSO-DAPT group (D1, arrows). Greater numbers of eGFP+/EdU+ cells were observed in the BIO-DAPT group (E1–E3, arrows). DAPI shows the nuclei in blue, and the scale bar is 20 μm. (F) The number of eGFP+/EdU+ cells per 100 μm from the apex to the base of the injured cochleae. (G) The number of eGFP+ cells per 100 μm from the apex to the base of the injured cochleae. (H) The percentage (%) of EdU+ cells of the total eGFP+ cells in the injured cochleae. Data in F–H are represented as mean ± SEM per 100 μm; *p < 0.05, **p < 0.01, unpaired Student's t-tests (two-tailed), see also Supplementary Table S4.
Figure 5
Figure 5. SC proliferation was promoted and the SC number was partially restored in the BIO-DAPT group
(AC) SCs were counted and analyzed. Images were taken from the apex of the uninjured cochleae. The dotted lines in A2–C2 and A4–C4 showed the counting limits of SCs in the sensory cell region. HCs (eGFP+, green) and SCs (Sox2+, gray) were well organized and integrated in the control group (A1–4). Sox2 expression was significantly decreased in the SC region in the DMSO-DAPT group (B1–B4). In contrast, Sox2 expression was preserved to a certain degree in the BIO-DAPT group (C1–C4). EdU is red, DAPI is blue, and the scale bar is 20 μm. (DF) Images were taken from the apex of the cochleae after neomycin administration. The dotted lines in D2–F2 and D4–F4 showed the counting limits of SCs in the sensory cell region consistent with the uninjured cochleae. The numbers of HCs (eGFP+, green) and SCs (Sox2+, gray) were similar to normal cochleae in the control group (D1–D4). Sox2 expression was weaker in the SC region in the DMSO-DAPT group (E1–E4), while it was preserved to a certain degree in the BIO-DAPT group (F1–F4). EdU is red, DAPI is blue, and the scale bar shares the same in A4. (GJ) Graphs G and J show the number of Sox2+/EdU+ cells per 100 μm in the sensory region of the injured (J) or uninjured (G) cochleae. Graphs H and K show the number of Sox2+ cells per 100 μm in the sensory region of the injured (K) or uninjured (H) cochleae. Graphs I and L show the ratio of Sox2+ SCs to eGFP+ HCs in the apex of the injured (L) or uninjured (I) cochleae. Data are presented as mean ± SEM; *p < 0.05, **p < 0.01, unpaired Student's t-tests (two-tailed), see also Supplementary Table S5.
Figure 6
Figure 6. The majority of proliferative SCs in the BIO-treated group originated from Lgr5+ progenitor cells
(AD) Rosa26 reporter mice were crossed with Lgr5eGFP-CreER mice for lineage tracing. All images are from the apex of the normal (A, B) and injured (C, D) cochleae. SCs were marked by Sox2 (green, A1–D1), and proliferative cells were marked by EdU (Gray, A2–D2). All Lgr5+ cells expressed tdTomato (Tom, red, A3-D3). Few Sox2+/Tom+ cells were seen in control groups (A4, C4). A total of 75.22 ± 4.23% of the proliferative Sox2+ SCs in the apex had originated from Lgr5+ SCs in normal cochleae (B1–B4), and 93.26 ± 1.57% of the Lgr5+ SCs in the neomycin-injured cochleae expressed tdTomato after BIO administration (D1–D4). Arrows show Tom/Sox2+/EdU+ cells. DAPI is blue and the scale bars are 20 μm. (EF) The graphs show the ratios of Tom- and Tom+ cells in Sox2+/EdU+ cells of the normal (E) and neomycin-treated (F) cochleae. Data are presented as mean ± SEM; **p < 0.01, unpaired Student's t-tests (two-tailed), see also Supplementary Table S6.
Figure 7
Figure 7. The majority of mitotically regenerated HCs in the BIO-DAPT group originated from Lgr5+ progenitor cells
(AD) Rosa26 reporter mice were crossed with Lgr5eGFP-CreER mice for lineage tracing. All images are from the apex of the normal (A, B) and injured (C, D) cochleae. HCs were marked by Myo7a (green, A1–D1), and proliferating cells were marked by EdU (Gray, A2–D2). All Lgr5+ cells expressed tdTomato (Tom, red, A3–D3). All images are from the apex of the cochleae. Few Myo7a+/Tom+ cells were seen in the control groups (A4, C4). A large proportion of the Myo7a+/EdU+ cells (81.90 ± 3.90%) in the normal BIO-DAPT-treated cochleae expressed tdTomato (B4), and 91.47 ± 4.66% of the Myo7a+/EdU+ cells were marked by tdTomato in the injured cochleae (D4). White arrowheads show Tom+/Myo7a+/EdU+ cells, and arrows show Tom/Myo7a+/EdU+ cells. Moreover, there were several EdU/Myo7a+/Tom+ cells in both the normal and injured cochleae that differentiated from the original SCs (B4, D4, yellow arrowheads). DAPI is blue and the scale bars are 20 μm. (EF) The graphs show the ratio of Tom and Tom+ cells in Myo7a+/EdU+ cells of normal (E) and neomycin-treated (F) cochleae. Data are presented as mean ± SEM; **p < 0.01, unpaired Student's t-tests (two-tailed), see also Supplementary Table S6. (G) Schematic of the possible crosstalk between Wnt and Notch signaling during the proliferation and differentiation process.

Similar articles

Cited by

References

    1. Colin Mathers AS, Concha Marisol. Global burden of hearing loss in the year 2000. Geneva: World Health Organization; 2000. Available at http://www.whoint/healthinfo/statistics/bod_hearinglosspdf.
    1. Duthey B. Priority Medicines for Europe and the World “A Public Health Approach to Innovation” Update on 2004 Background Paper. BP 6.21 Hearing Loss. Geneva: WHOInt; 2013. Available at http://www.who.int/medicines/areas/priority_medicines/BP6_21Hearing.pdf?....
    1. White PM, Doetzlhofer A, Lee YS, Groves AK, Segil N. Mammalian cochlear supporting cells can divide and trans-differentiate into hair cells. Nature. 2006;441:984–7. - PubMed
    1. Li W, Wu J, Yang J, Sun S, Chai R, Chen ZY, Li H. Notch inhibition induces mitotically generated hair cells in mammalian cochleae via activating the Wnt pathway. Proc Natl Acad Sci U S A. 2015;112:166–71. - PMC - PubMed
    1. Li H, Liu H, Heller S. Pluripotent stem cells from the adult mouse inner ear. Nature medicine. 2003;9:1293–9. - PubMed

MeSH terms

LinkOut - more resources