Transcript-level expression analysis of RNA-seq experiments with HISAT, StringTie and Ballgown
- PMID: 27560171
- PMCID: PMC5032908
- DOI: 10.1038/nprot.2016.095
Transcript-level expression analysis of RNA-seq experiments with HISAT, StringTie and Ballgown
Abstract
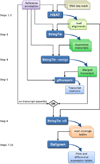
High-throughput sequencing of mRNA (RNA-seq) has become the standard method for measuring and comparing the levels of gene expression in a wide variety of species and conditions. RNA-seq experiments generate very large, complex data sets that demand fast, accurate and flexible software to reduce the raw read data to comprehensible results. HISAT (hierarchical indexing for spliced alignment of transcripts), StringTie and Ballgown are free, open-source software tools for comprehensive analysis of RNA-seq experiments. Together, they allow scientists to align reads to a genome, assemble transcripts including novel splice variants, compute the abundance of these transcripts in each sample and compare experiments to identify differentially expressed genes and transcripts. This protocol describes all the steps necessary to process a large set of raw sequencing reads and create lists of gene transcripts, expression levels, and differentially expressed genes and transcripts. The protocol's execution time depends on the computing resources, but it typically takes under 45 min of computer time. HISAT, StringTie and Ballgown are available from http://ccb.jhu.edu/software.shtml.
Figures


Similar articles
-
Plant Transcriptome Analysis with HISAT-StringTie-Ballgown and TopHat-Cufflinks Pipelines.Methods Mol Biol. 2024;2812:203-213. doi: 10.1007/978-1-0716-3886-6_11. Methods Mol Biol. 2024. PMID: 39068364
-
Improved RNA-seq Workflows Using CyVerse Cyberinfrastructure.Curr Protoc Bioinformatics. 2018 Sep;63(1):e53. doi: 10.1002/cpbi.53. Epub 2018 Aug 31. Curr Protoc Bioinformatics. 2018. PMID: 30168903
-
Differential gene and transcript expression analysis of RNA-seq experiments with TopHat and Cufflinks.Nat Protoc. 2012 Mar 1;7(3):562-78. doi: 10.1038/nprot.2012.016. Nat Protoc. 2012. PMID: 22383036 Free PMC article.
-
Mapping RNA-seq Reads with STAR.Curr Protoc Bioinformatics. 2015 Sep 3;51:11.14.1-11.14.19. doi: 10.1002/0471250953.bi1114s51. Curr Protoc Bioinformatics. 2015. PMID: 26334920 Free PMC article. Review.
-
Protocol for transcriptome assembly by the TransBorrow algorithm.Biol Methods Protoc. 2023 Nov 1;8(1):bpad028. doi: 10.1093/biomethods/bpad028. eCollection 2023. Biol Methods Protoc. 2023. PMID: 38023349 Free PMC article. Review.
Cited by
-
Gene Expression Profiling Regulated by lncRNA H19 Using Bioinformatic Analyses in Glioma Cell Lines.Cancer Genomics Proteomics. 2024 Nov-Dec;21(6):608-621. doi: 10.21873/cgp.20477. Cancer Genomics Proteomics. 2024. PMID: 39467632 Free PMC article.
-
Proteomic and Transcriptomic Analyses Reveal Pathological Changes in the Entorhinal Cortex Region that Correlate Well with Dysregulation of Ion Transport in Patients with Alzheimer's Disease.Mol Neurobiol. 2021 Aug;58(8):4007-4027. doi: 10.1007/s12035-021-02356-3. Epub 2021 Apr 27. Mol Neurobiol. 2021. PMID: 33904022
-
Viral genomic, metagenomic and human transcriptomic characterization and prediction of the clinical forms of COVID-19.PLoS Pathog. 2021 Mar 29;17(3):e1009416. doi: 10.1371/journal.ppat.1009416. eCollection 2021 Mar. PLoS Pathog. 2021. PMID: 33780519 Free PMC article. Clinical Trial.
-
Integrated Analysis of Long Non-Coding RNA and mRNA to Reveal Putative Candidate Genes Associated with Backfat Quality in Beijing Black Pig.Foods. 2022 Nov 15;11(22):3654. doi: 10.3390/foods11223654. Foods. 2022. PMID: 36429246 Free PMC article.
-
SgRVE6, a LHY-CCA1-Like Transcription Factor From Fine-Stem Stylo, Upregulates NB-LRR Gene Expression and Enhances Cold Tolerance in Tobacco.Front Plant Sci. 2020 Aug 19;11:1276. doi: 10.3389/fpls.2020.01276. eCollection 2020. Front Plant Sci. 2020. PMID: 32973836 Free PMC article.
References
Publication types
MeSH terms
Substances
Grants and funding
LinkOut - more resources
Full Text Sources
Other Literature Sources
Medical
Molecular Biology Databases

