. 2016 Sep 6;113(36):E5318-27.
doi: 10.1073/pnas.1601844113. Epub 2016 Aug 24.

Rab5 and its effector FHF contribute to neuronal polarity through dynein-dependent retrieval of somatodendritic proteins from the axon

Affiliations

Rab5 and its effector FHF contribute to neuronal polarity through dynein-dependent retrieval of somatodendritic proteins from the axon

Xiaoli Guo et al. Proc Natl Acad Sci U S A. .

Abstract

An open question in cell biology is how the general intracellular transport machinery is adapted to perform specialized functions in polarized cells such as neurons. Here we illustrate this adaptation by elucidating a role for the ubiquitous small GTPase Ras-related protein in brain 5 (Rab5) in neuronal polarity. We show that inactivation or depletion of Rab5 in rat hippocampal neurons abrogates the somatodendritic polarity of the transferrin receptor and several glutamate receptor types, resulting in their appearance in the axon. This loss of polarity is not caused primarily by increased transport from the soma to the axon but rather by decreased retrieval from the axon to the soma. Retrieval is also dependent on the Rab5 effector Fused Toes (FTS)-Hook-FTS and Hook-interacting protein (FHIP) (FHF) complex, which interacts with the minus-end-directed microtubule motor dynein and its activator dynactin to drive a population of axonal retrograde carriers containing somatodendritic proteins toward the soma. These findings emphasize the importance of both biosynthetic sorting and axonal retrieval for the polarized distribution of somatodendritic receptors at steady state.

Keywords: FHF complex; Rab5; dynein; neuronal polarity; retrograde transport.


Conflict of interest statement

The authors declare no conflict of interest.

Figures

Fig. 1.
Fig. 1.
Effect of dominant-negative Rabs on the somatodendritic polarity of the TfR. (A) Rat hippocampal neurons were cotransfected at DIV3 with plasmids encoding mCherry (mCh)-TfR together with GFP (control) or dominant-negative GFP-Rab2A-S20N, GFP-Rab4B-S22N, GFP-Rab5A-S34N, GFP-Rab6A-T27N, GFP-Rab7A-T22N, GFP-Rab8A-T22N, or GFP-Rab11A-S25N. At DIV10, the neurons were fixed, immunostained for AnkG (an AIS marker), and imaged by confocal microscopy. In these and all subsequent experiments, analysis of receptor polarity was performed only on neurons that exhibited a normal appearance of the AIS. (B) Dendrite/axon polarity indexes for TfR are represented as the mean ± SEM from 8–20 neurons in at least three independent experiments such as that described in A. *P < 0.01 per one-way ANOVA followed by Dunnett’s test, compared with GFP control. (C) Neurons cotransfected at DIV3 with mCherry-TfR and GFP-Rab5A-S34N were immunostained at DIV10 for AnkG and MAP2 (a somatodendritic marker). In both A and C, images are shown in negative grayscale. Arrows mark the position of the AIS, and arrowheads indicate the axon. (Scale bars: 20 μm.) In A, notice the presence of mCherry-TfR in the axon of GFP-Rab5A-S34N–expressing neurons.
Fig. S1.
Fig. S1.
Expression of dominant-negative Rab5A or Rab5-shRNA abolishes the somatodendritic polarity of TfR at 48 h posttransfection. (A and B) Rat hippocampal neurons were cotransfected at DIV5 with plasmids encoding TfR-GFP together with mCherry-tubulin (control) (A, Upper Row), mCherry-Rab5A-S34N (A, Lower Row), mCherry-expressing scrambled shRNA control (B, Upper Row), or mCherry-expressing Rab5-shRNA plasmids (B, Lower Row). Fixed neurons were immunostained at DIV7 (i.e., 48 h after transfection) for AnkG and were imaged by confocal microscopy. Images are shown in negative grayscale. Arrows mark the position of the AIS, and arrowheads indicate the axon. (Scale bar: 20 μm.) (C and D) Dendrite/axon polarity indexes are represented as the mean ± SEM from 10 neurons in at least three independent experiments such as those shown in A and B, respectively. *P < 0.01 per Student’s t test.
Fig. 2.
Fig. 2.
Expression of dominant-negative Rab5A abolishes the somatodendritic polarity of glutamate receptors. (A and B) Rat hippocampal neurons were cotransfected at DIV4 with plasmids encoding GluR1-GFP, SEP-GluR2, NR2A-GFP, NR2B-GFP, or mGluR1-GFP together with plasmids encoding mCherry (mCh)-tubulin (control) (A) or dominant-negative mCherry-Rab5A-S34N (B). Fixed neurons were immunostained at DIV9 for GFP and AnkG and were imaged by confocal microscopy. Images are shown in negative grayscale. Arrows mark the position of the AIS, and arrowheads indicate the axon. (Scale bar: 20 μm.) (C) Dendrite/axon polarity indexes for glutamate receptors are represented as the mean ± SEM from 10 neurons in at least three independent experiments such as those shown in A and B. *P < 0.01 per Student’s t test. Notice that expression of mCherry-Rab5A-S34N abrogates the somatodendritic polarity of all the glutamate receptor proteins.
Fig. 3.
Fig. 3.
Expression of Rab5-shRNA abrogates the somatodendritic polarity of various endogenous receptors. (A and B) Rat hippocampal neurons were transfected at DIV5 with a scrambled shRNA control plasmid (A) or Rab5-shRNA–expressing plasmid (B), both also driving expression of mCherry. Neurons were fixed and immunostained at DIV10 for the endogenous receptor proteins TfR, GluR1, GluR2, or NR2A, together with AnkG for distinction of dendrites and axons. The distribution of the receptor proteins was imaged by confocal microscopy. Fifty-micrometer segments of dendrites and axons immediately distal to the AIS are shown. (C) Dendrite/axon polarity indexes are represented as the mean ± SEM from 10 neurons in three independent experiments such as described in A and B. *P < 0.01 per Student’s t test. Note that transfection with Rab5-shRNA plasmid abrogates the somatodendritic polarity of endogenous TfR, GluR1, GluR2, and NR2A.
Fig. S2.
Fig. S2.
Treatment with Rab5-shRNA abolishes the somatodendritic polarity of glutamate receptors. (A and B) Rat hippocampal neurons were transfected at DIV5 (A) or DIV4 (B) with mCherry-expressing scrambled shRNA control (Upper) or a combination of mCherry-expressing Rab5A-shRNA and Rab5B/C-shRNA plasmids (Rab5-shRNA) (Lower). Fixed neurons were immunostained at DIV7 (i.e., 48 h after transfection) (A) or DIV9 (i.e., 120 h after transfection) (B) for endogenous Rab5 and were imaged by confocal microscopy. (Scale bar: 20 μm.) Notice the absence of endogenous Rab5 staining in the neurons expressing Rab5-shRNA. (C and D) Quantification of the relative Rab5 fluorescence intensity in transfected neurons compared with adjacent untransfected neurons at 48 h posttransfection (C) or 120 h posttransfection (D). The values are the mean ± SEM from 10 neurons in at least three independent experiments such as those shown in A and B. *P < 0.01 per Student’s t test. (EG) Treatment with Rab5-shRNA abolishes the somatodendritic polarity of glutamate receptors. (E and F) Rat hippocampal neurons were cotransfected at DIV4 with plasmids encoding GluR1-GFP, SEP-GluR2, NR2A-GFP, NR2B-GFP, or mGluR1-GFP, together with mCherry-expressing empty shRNA control (E) or mCherry-expressing Rab5-shRNA plasmids (F). Fixed neurons were immunostained at DIV9 for GFP and AnkG and were imaged by confocal microscopy. Images are shown in negative grayscale. Arrows mark the position of the AIS, and arrowheads indicate the axon. (Scale bar: 20 μm.) (G) Dendrite/axon polarity indexes for glutamate receptors are represented as the mean ± SEM from 10 neurons in at least three independent experiments such as those shown in E and F. *P < 0.01 per Student’s t test.
Fig. 4.
Fig. 4.
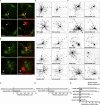
Rab5 depletion reduces axonal retrograde transport of the TfR. (A) Colocalization of Rab5 with TfR. Rat hippocampal neurons cotransfected at DIV3 with plasmids encoding mCherry (mCh)-TfR and GFP-Rab5A were immunostained at DIV10 for AnkG. Fixed neurons were imaged by confocal microscopy. Arrows indicate the position of the AIS. Magnifications of the boxed regions in the top row are shown in the middle and bottom rows. In the bottom row, brightness (i.e., gain) was increased to enhance the weak mCherry-TfR fluorescence in the axon. (Scale bars: 20 μm for the top row; 10 μm for the middle and bottom rows.) (B) Rat hippocampal neurons transfected as in A were surface-labeled at DIV8 with CF640-conjugated antibody to the AIS marker neurofascin and analyzed by live-cell imaging. Dual-color images of an axon segment adjacent to the distal edge of the AIS were acquired sequentially at 1-s intervals. The three top strips show single frames, and the two middle panels show negative grayscale kymographs from Movie S1. The bottom panel represents the trajectories of carriers having both GFP-Rab5A and mCherry-TfR (yellow lines), only GFP-Rab5A (green), or only mCherry-TfR (red). Lines with negative and positive slopes represent carriers moving in anterograde and retrograde directions, respectively. Vertical lines represent stationary foci. (C) Quantification of colocalization of GFP-Rab5A and mCherry-TfR in anterograde and retrograde carriers. Values are the mean ± SEM from proximal axon segments of six neurons imaged as in B. (D) Rat hippocampal neurons were transfected at DIV3 with plasmids encoding TfR-GFP together with mCherry-tubulin (control) or Rab5-shRNA also expressing mCherry and imaged live at DIV8 after surface-labeling with CF640-conjugated antibody to the AIS marker neurofascin. An axonal segment 25–35 μm distal to the AIS was photobleached (PB), and TfR-GFP–containing carriers entering the photobleach box were imaged at 1.5-s intervals. The five upper strips, extracted from Movie S2, show frames before photobleaching (pre-PB) and after 15, 60, 90, and 120 s of fluorescence recovery. The lower panels, also from Movie S2, show negative grayscale kymographs after up to 450 s of fluorescence recovery. (E) Quantification of the number of TfR-GFP–containing anterograde and retrograde carriers entering the photobleach box. Values are the mean ± SEM from 9–12 axons imaged as in D. *P < 0.01 per Student’s t test.
Fig. S3.
Fig. S3.
Spatial distribution of TfR-GFP–containing retrograde carriers along the axon. Rat hippocampal neurons were cotransfected at DIV5 with plasmids encoding TfR-GFP and mCherry-tubulin, surface-labeled at DIV8 with CF640-conjugated antibody to the AIS marker neurofascin (NF), and analyzed by live-cell imaging. The movement of TfR-containing carriers was analyzed in three axonal segments: the AIS, the midaxon (∼200 μm beyond the AIS), and the axon terminus. The four upper strips show single frames of TfR-GFP, mCherry-tubulin, CF640-NF, and a merged image. The bottom panels show negative grayscale kymographs for up to 200 s of imaging. Lines with negative and positive slopes represent carriers moving in anterograde and retrograde directions, respectively. Vertical lines represent stationary foci.
Fig. S4.
Fig. S4.
Decreased axonal retrograde transport of the TfR in the proximal axon and AIS of Rab5-depleted neurons. Rat hippocampal neurons were transfected at DIV5 with plasmids encoding TfR-GFP together with mCherry-tubulin (control) (A) or mCherry-expressing Rab5-shRNA plasmids (B) and were imaged live at DIV8 after surface-labeling with CF640-conjugated antibody to the AIS marker neurofascin (NF). The AIS and axonal segments 75 μm beyond the AIS were photobleached, and TfR-GFP–containing carriers entering the photobleach box were imaged at 1-s intervals. The four strips at the top, from Movie S3, show single frames of TfR-GFP before photobleaching (pre-PB), TfR-GFP immediately after photobleaching (PB), CF640-NF, and mCherry-tubulin. The bottom panels, also from Movie S3, show negative grayscale kymographs of up to 200 s of fluorescence recovery. Lines with negative and positive slopes represent carriers moving in anterograde and retrograde directions, respectively. Vertical lines represent stationary foci.
Fig. S5.
Fig. S5.
Axonal uptake of Tf upon depletion or inactivation of Rab5. (AD, Upper) Rat hippocampal neurons were cotransfected at DIV5 with plasmids encoding TfR-GFP together with mCherry-tubulin (control) (A), mCherry-Rab5A-S34N (B), mCherry-expressing scrambled shRNA control (C), or mCherry-expressing Rab5-shRNA plasmids (D). At DIV9, neurons were incubated with Alexa 647-conjugated transferrin (Tf-Alexa 647) for 30 min at 37 °C. Cells were analyzed by confocal microscopy after fixation. TfR-GFP, Tf-Alexa 647, mCherry, and merged images are shown. White in the merged images indicates colocalization. Arrows mark the position of the AIS, and arrowheads indicate the axon. (Scale bars: 20 μm.) (AD, Lower) Fifty-micrometer segments of dendrites and axons immediately distal to the AIS were magnified from images in the upper panels.
Fig. S6.
Fig. S6.
Colocalization of internalized Tf with TfR-GFP on axonal retrograde carriers. (A) Rat hippocampal neurons were cotransfected at DIV5 with plasmids encoding TfR-GFP and mCherry-tubulin and were incubated at DIV8 with Alexa 647-conjugated transferrin (Tf-Alexa 647) for 30 min at 37 °C. After washing with PBS, cells were analyzed by live-cell imaging. TfR-GFP, Tf-Alexa 647, mCherry-tubulin, and merged images are shown in A. Arrows indicate the position of the AIS. (Scale bar: 10 μm.) (B) Magnifications of the boxed regions in A. The top upper strips show single frames, and the two middle panels show negative grayscale kymographs for up to 200 s of imaging from Movie S4. The bottom panel shows the merged trajectories of carriers having both TfR-GFP and Tf-Alexa 647 (yellow lines), only TfR-GFP (green lines), or only Tf-Alexa 647 (red lines). Lines with negative and positive slopes represent carriers moving in anterograde and retrograde directions, respectively. Vertical lines represent stationary foci.
Fig. 5.
Fig. 5.
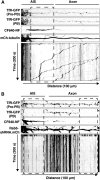
Somatodendritic polarity of the TfR depends on dynein–dynactin. (A) Rat hippocampal neurons were transfected at DIV4 with a plasmid encoding the IC2C dynein intermediate chain fused to GFP (indicated as GFP-Dynein) together with plasmids encoding mCherry (mCh)-Rab5A and were examined at DIV8 by live-cell imaging and kymograph analysis. Dual-color images of midaxon segments were acquired sequentially at 1-s intervals for 120 s. The top three strips show single frames, and the two middle panels show negative grayscale kymographs (all from Movie S5). The bottom panel represents the trajectories of carriers having mCherry-Rab5A together with GFP-Dynein (yellow lines) or only mCherry-Rab5A (red lines). (B) Rat hippocampal neurons were cotransfected at DIV4 with plasmids encoding TfR-GFP together with tubulin (control), the p50 subunit of dynactin, or the CC1 domain of the p150Glued subunit of dynactin, all tagged with mCherry. At DIV8, neurons were fixed and immunostained for AnkG and were imaged by confocal microscopy. Images are shown in negative grayscale. Arrows mark the position of the AIS, and arrowheads indicate the axon. (Scale bar: 20 μm.) (C) Dendrite/axon polarity indexes for TfR from experiments such as that described in B are represented as the mean ± SEM from 20 neurons in at least three independent experiments. *P < 0.01 per one-way ANOVA followed by Dunnett’s test.
Fig. 6.
Fig. 6.
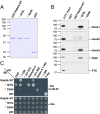
A complex containing Hook1/3 and FHIP behaves as a Rab5 effector. (A) Coomassie blue staining of GST fusion proteins used in the experiment. (B) Pulldown of FHF complex subunits from HEK293T cell extracts by GST-Rab5A proteins. Bound proteins were eluted and were analyzed by SDS/PAGE and immunoblotting with antibodies to the proteins indicated at right. The positions of molecular mass markers (in kilodaltons) are indicated at left. The signal in pulled-down complexes relative to input (first lane at left) indicates preferential interaction of GST-Rab5A-Q79L with Hook1, Hook3, and FHIP. (C) Yeast two-hybrid assays demonstrate direct, activation-dependent interaction of Rab5A with FHIP. Growth on selective plates without His (−His) is indicative of interactions (Upper), and incubation on plates containing His (+His) is a control for growth/loading of double transformants (Lower). The −His plates were supplemented with 3 mM 3-amino-1,2,4-triazole (AT), a competitive inhibitor of the His3 protein, to increase the stringency of the assay. The Rabaptin-5 full-length and 551–862 fragments (84) were used as controls for preferential interaction with Rab5A-Q79L. The Rabex-5 constructs 1–460 and 1–399 (69) served as controls for preferential interaction with Rab5A-S34N (longer incubation times were required to detect interaction with Rabex-5 1–399). Double transformations of Gal4-binding domain (BD) constructs with SV40 large T-antigen (T-Ag) and of Gal4 activation domain (AD) constructs with p53 provided negative controls. Double transformation with T-Ag and p53 plasmids served as an additional positive control.
Fig. 7.
Fig. 7.
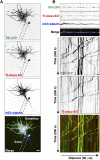
Somatodendritic polarity of the TfR depends on components of the FHF complex. (A) Rat hippocampal neurons were transfected at DIV4 with plasmids encoding GFP-Rab5A together with Hook1, Hook3, or FHIP, all tagged with mCherry, and were examined by live-cell imaging and kymograph analysis at DIV8. Dual-color images of midaxon segments were acquired sequentially at 1-s intervals for 120 s (Movie S6). For each FHF component, the three top strips show single frames, the two middle panels show negative grayscale kymographs, and the bottom panel represents the trajectories of carriers having both GFP-Rab5A and an mCherry-tagged FHF subunit (yellow lines) or only GFP-Rab5A (green lines). (B) Rat hippocampal neurons were cotransfected at DIV4 with plasmids encoding mCherry-TfR together with plasmids encoding shRNAs targeting Hook1, Hook3, or FHIP as well as GFP. Fixed neurons were immunostained at DIV8 for AnkG and were imaged by confocal microscopy. In this figure images for mCherry and GFP are shown in negative grayscale. Arrows indicate the position of the AIS, and arrowheads indicate the trajectory of the axon. (Scale bar: 20 μm.) (C) Dendrite/axon polarity indexes for TfR from experiments such as those described in B are represented as the mean ± SEM from 20 neurons in at least three independent experiments. *P < 0.01 per one-way ANOVA followed by Dunnett’s test.
Fig. 8.
Fig. 8.
Schematic representation of the role of Rab5, the FHF complex, and dynein–dynactin in axonal retrieval of the TfR. A population of somatodendritic proteins that escape into the axon is packed into Rab5-associated retrograde carriers. The GTP-bound form of Rab5 recruits its effector FHF complex via an interaction with the FHIP subunit. The Hook subunits of FHF then bind the minus end-directed microtubule motor dynein–dynactin (–44), promoting retrograde movement of the transport carriers. Rab5 and FHF thus function as a regulated adaptor complex for coupling of TfR-containing retrograde carriers to dynein–dynactin.

Similar articles

Cited by

References

    1. Lasiecka ZM, Winckler B. Mechanisms of polarized membrane trafficking in neurons -- focusing in on endosomes. Mol Cell Neurosci. 2011;48(4):278–287. - PMC - PubMed
    1. Bonifacino JS. Adaptor proteins involved in polarized sorting. J Cell Biol. 2014;204(1):7–17. - PMC - PubMed
    1. Maeder CI, Shen K, Hoogenraad CC. Axon and dendritic trafficking. Curr Opin Neurobiol. 2014;27:165–170. - PubMed
    1. Silverman MA, et al. Sorting and directed transport of membrane proteins during development of hippocampal neurons in culture. Proc Natl Acad Sci USA. 2001;98(13):7051–7057. - PMC - PubMed
    1. Sampo B, Kaech S, Kunz S, Banker G. Two distinct mechanisms target membrane proteins to the axonal surface. Neuron. 2003;37(4):611–624. - PubMed

Publication types

LinkOut - more resources