. 2017 Jan 9;45(1):395-416.
doi: 10.1093/nar/gkw731. Epub 2016 Aug 23.

RNA-sequencing of a mouse-model of spinal muscular atrophy reveals tissue-wide changes in splicing of U12-dependent introns

Affiliations

RNA-sequencing of a mouse-model of spinal muscular atrophy reveals tissue-wide changes in splicing of U12-dependent introns

Thomas Koed Doktor et al. Nucleic Acids Res. .

Abstract

Spinal Muscular Atrophy (SMA) is a neuromuscular disorder caused by insufficient levels of the Survival of Motor Neuron (SMN) protein. SMN is expressed ubiquitously and functions in RNA processing pathways that include trafficking of mRNA and assembly of snRNP complexes. Importantly, SMA severity is correlated with decreased snRNP assembly activity. In particular, the minor spliceosomal snRNPs are affected, and some U12-dependent introns have been reported to be aberrantly spliced in patient cells and animal models. SMA is characterized by loss of motor neurons, but the underlying mechanism is largely unknown. It is likely that aberrant splicing of genes expressed in motor neurons is involved in SMA pathogenesis, but increasing evidence indicates that pathologies also exist in other tissues. We present here a comprehensive RNA-seq study that covers multiple tissues in an SMA mouse model. We show elevated U12-intron retention in all examined tissues from SMA mice, and that U12-dependent intron retention is induced upon siRNA knock-down of SMN in HeLa cells. Furthermore, we show that retention of U12-dependent introns is mitigated by ASO treatment of SMA mice and that many transcriptional changes are reversed. Finally, we report on missplicing of several Ca2+ channel genes that may explain disrupted Ca2+ homeostasis in SMA and activation of Cdk5.


Figures

Figure 1.
Figure 1.
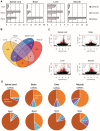
Gene expression analysis. (A) Barplot showing the number of differentially expressed genes in SMA-like mice at PND1 and PND5 in spinal cord, brain, liver and muscle. The number of down- and up-regulated genes is indicated below the barplot. (B) Venn diagrams of the overlap of significant genes in different tissues at PND1 and PND5. (C) Scatterplots of log2 fold-change estimates in spinal cord, brain, liver and muscle. Genes that were significant in both conditions are indicated in purple, genes that were significant only in the condition on the x axis are indicated in red, genes significant only in the condition on the y axis are indicated in blue. (D) Scatterplots of log2 fold-changes of genes in the indicated tissues that were statistically significantly different at PND1 versus the log2 fold-changes at PND5. Genes that were also statistically significantly different at PND5 are indicated in red. The dashed grey line indicates a completely linear relationship, the blue line indicates the linear regression model based on the genes significant at PND1, and the red line indicates the linear regression model based on genes that were significant at both PND1 and PND5. Pearsons rho is indicated in black for all genes significant at PND1, and in red for genes significant at both time points.
Figure 2.
Figure 2.
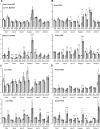
Expression of axon guidance genes is down-regulated in SMA-like mice at PND5 while stress genes are up-regulated. (A) Schematic depiction of the axon guidance pathway in mice from the KEGG database. Gene regulation is indicated by a color gradient going from down-regulated (blue) to up-regulated (red) with the extremity thresholds of log2 fold-changes set to −1.5 and 1.5, respectively. (B) qPCR validation of differentially expressed genes in SMA-like mice at PND5. (C) qPCR validation of differentially expressed genes in SMA-like mice at PND1. Error bars indicate SEM, n ≥ 3, **P-value < 0.01, *P-value < 0.05. White bars indicate heterozygous control mice, grey bars indicate SMA-like mice.
Figure 3.
Figure 3.
Aberrant splicing with increased U2-intron retention in SMA-like mice. (A) Barplots showing the number of regions relative to the RefSeq annotation, either the total set of annotated regions, or those significantly alternatively spliced at PND1 or PND5 in the indicated tissues. (B) Venn diagram showing the overlap of genes with alternative splicing between tissues at PND5. (C) Volcano plots of exonic regions in spinal cord, brain, liver and muscle at PND5. Significantly differentially expressed regions overlapping known transcripts are indicated in red, novel significant regions are indicated in blue. Values exceeding chart limits are plotted at the corresponding edge and indicated by either up or downward facing triangle, or left/right facing arrow heads. Number of known and novel regions that are up or down-regulated are indicated in red (known) and blue (novel) in either the upper-left (down) or upper-right (up). (D) Piecharts of observed alternative splicing patterns in spinal cord, brain, liver and muscle at PND5 in either the full Cufflinks annotation or only the novel regions not overlapping previously annotated transcripts.
Figure 4.
Figure 4.
U12-intron retention increases with disease progression. (A) Volcano plots of U12-intron retention SMA-like mice at PND1 in spinal cord, brain, liver and muscle. Significantly differentially expressed introns are indicated in red. Non-significant introns with foldchanges > 2 are indicated in blue. Values exceeding chart limits are plotted at the corresponding edge and indicated by either up or downward facing triangle, or left/right facing arrow heads. (B) Volcano plots of U12-intron retention in SMA-like mice at PND5 in spinal cord, brain, liver and muscle. Significantly differentially expressed introns are indicated in red. Non-significant introns with fold-changes >2 are indicated in blue. Values exceeding chart limits are plotted at the corresponding edge and indicated by either up or downward facing triangle, or left/right facing arrow heads. (C) Venn diagram of the overlap of common significant alternative U12-intron retention across tissue at PND1. (D) Venn diagram of the overlap of common significant alternative U12-intron retention across tissue at PND1.
Figure 5.
Figure 5.
Increased U12-dependent intron retention in SMA mice. (A) qPCR validation of U12-dependent intron retention at PND1 and PND5 in spinal cord. (B) qPCR validation of U12-dependent intron retention at PND1 and PND5 in brain. (C) qPCR validation of U12-dependent intron retention at PND1 and PND5 in liver. (D) qPCR validation of U12-dependent intron retention at PND1 and PND5 in muscle. Error bars indicate SEM, n ≥ 3, ***P-value < 0.001, **P-value < 0.01, *P-value < 0.05. White bars indicate heterozygous control mice, gray bars indicate SMA-like mice. Spl = spliced, Unspl = unspliced/retained intron.
Figure 6.
Figure 6.
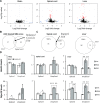
Knockdown of SMN in HeLa cells recapitulate the findings in SMA mice. (A) Western blot of SMN-targeting siRNA (SMN) versus non-targeting siRNA (NT) samples showing reduced expression of SMN protein. (B) Volcano-plot of U12-dependent intron retention in SMN-deficient HeLa cells. Significantly differentially retained introns are indicated in red. Non-significant introns with fold-changes >2 are indicated in blue. Values exceeding chart limits are plotted at the corresponding edge and indicated by upward facing triangle. (C) Venn diagram showing overlap of genes with U12-dependent intron retention in SMA mice at PND5 and SMN depleted HeLa cells.
Figure 7.
Figure 7.
ASO treatment reverses the expression and splicing profiles of SMA. (A) ASO treatment increases inclusion of SMN2 exon 7. Inclusion percentage were estimated from RT-PCR product sizes quantitated on a fragment analyzer. (B) Scatter plot of log2 fold-changes of significant genes in spinal cord of ASO treated mice relative to saline treated SMA mice and log2 fold-changes of the same genes in SMA mice relative to heterozygous controls. Genes that are significant in both comparisons are indicated in red and Pearson's correlation is indicated for these genes. (C) Heatmap of the average gene expression of genes in pathways significantly altered in the spinal cord of SMA mice relative to healthy controls. Gene expression values are derived from regularized log values and the normalized across samples setting the average to zero. (D) Barplot showing unadjusted P-values for the testing of reversal of the pathway in ASO treated mice relative to untreated SMA mice. (E) qPCR measurements of genes previously found to be deregulated in the spinal cord of SMA mice.
Figure 8.
Figure 8.
ASO treatment restores correct splicing of U12-dependent introns in SMA mice. (A) Volcano plots of U12-dependent introns in brain, spinal cord and liver of ASO treated SMA mice. Significantly differentially retained introns are indicated in red. Non-significant introns with fold-changes >2 are indicated in blue. Values exceeding chart limits are plotted at the corresponding edge and indicated by upward facing triangle. (B) Overlap of introns with significantly improved splicing in liver and spinal cord of ASO treated SMA mice. SMA = saline treated SMA mice, ASO = ASO treated SMA mice. (C) Overlap of introns significantly retained in SMA mice and introns significantly improved in ASO treated SMA mice in spinal cord and liver. (D) qPCR analysis of BAZ1B/Baz1b and MYO10/Myo10 U12-dependent intron splicing in HeLa SMN-KD samples, and spinal cord and liver in ASO treated SMA mice.

Similar articles

Cited by

References

    1. Pearn J. Incidence, prevalence, and gene frequency studies of chronic childhood spinal muscular atrophy. J. Med. Genet. 1978;15:409–413. - PMC - PubMed
    1. Crawford T.O., Pardo C.A. The neurobiology of childhood spinal muscular atrophy. Neurobiol. Dis. 1996;3:97–110. - PubMed
    1. Lefebvre S., Burglen L., Reboullet S., Clermont O., Burlet P., Viollet L., Benichou B., Cruaud C., Millasseau P., Zeviani M., et al. Identification and characterization of a spinal muscular atrophy-determining gene. Cell. 1995;80:155–165. - PubMed
    1. Lefebvre S., Burlet P., Liu Q., Bertrandy S., Clermont O., Munnich A., Dreyfuss G., Melki J. Correlation between severity and SMN protein level in spinal muscular atrophy. Nat. Genet. 1997;16:265–269. - PubMed
    1. Lorson C.L., Hahnen E., Androphy E.J., Wirth B. A single nucleotide in the SMN gene regulates splicing and is responsible for spinal muscular atrophy. Proc. Natl. Acad. Sci. U.S.A. 1999;96:6307–6311. - PMC - PubMed

MeSH terms